Astronomical Institute of Czechoslovakia,
Vol 41, No 3, 149-157, 1990
DIOGENESS Soft X-ray Spectrometer-photometer for Studies of Flare Energy Balance
J.
Sylwester1), F. Farnik2)
1) Space Research Centre of the Polish Academy of Sciences, Wroclaw, Poland
2) Astronomical Institute, Czechoslovak Academy of Sciences, 251 65 Ondfejov, Czechoslovakia
Received 31 May 1989
We describe the scientific objectives and the technical characteristics of the DIOGENESS (Diagnostic of Energy Sources and Sinks in flares) instrument which is under development for the CORONAS-I solar observatory to be launched in the early 1990's as part of the INTERCOSMOS programme.
Key words: X-ray spectrometry — broad-band photometry — solar flares: energy balance
1. Introduction
In the late 1980's INTERCOSMOS announced tentative project of launching two satellites, CORONAS I and CORONAS F, designed to study the solar atmosphere during and after the maximum of solar activity cycle 22. In response to this, the Space Research Centre of the Polish Academy of Sciences (SRC) and the Astronomical Institute of the CzechoSlovak Academy of Sciences (AI CsAS) developed jointly a proposal of the DIOGENESS instrument devoted to the studies of the global energy balance in flares (Tab. I).
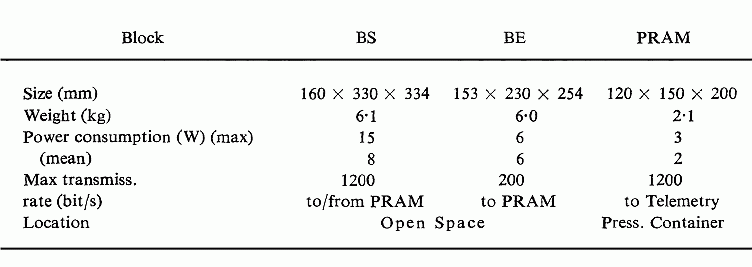
The instrument consists of three physically
separate units: a Bragg high-resolution spectrometer (BS), a soft-hard X-ray
photometer (BF), and a microcomputer (PR AM) for steering and control, as well
as data processing for the two units mentioned above and for some other
instruments aboard CORONAS. The BS and BF units are planned as part of the
instrument payload (open space), while PRAM is to be located in the pressurized,
thermally controlled section of the satellite. This paper describes the
scientific aspects of the DIOGENESS instrument and contains general information
on the construction of the spectrometer block which is under development in the
SRC, as well as the photometer block and the PRAM, which are being developed at
the AI CsAS under a design similar to that adopted for the broadband X-ray
photometers for the PROGNOZ and INTERBOL missions (see Farnik et al. 1984).
DIOGENESS shares a part (12 Mbits) of the SSNI telemetry memory (SSNI is one of
the two main telemetry systems with receiving ground stations in the USSR) to
store the results of measurements between the telemetry transmissions. A special
two-way telemetry radio-link under development at the AI CsAS, allows for
transmission of the content of the PRAM data memory to the telemetry stations in
Czechoslovakia and/or Poland during radio visibility (at least twice a day) and
for two-way communication with the PRAM computer which enables us to receive a
part of the measured data in Czechoslovakia or Poland without any delay. The
two-way communication makes it possible to relay commands to the PRAM and, if
necessary, to update on-board software. The PRAM is linked with the BF by a
parallel communication line and with the BS via a sequential communication
line served by the BS inner microprocessor (type Z 80).
2. Scientific Objectives
The ultimate goal of the DIOGENESS instrument is to provide measurements which will allow the balance of the solar flare energy, contained in its main thermal reservoir, to be studied. Studies of the energy balance are important for a better understanding of the flare mechanisms and processes leading to energy deposition, transport and redistribution between its various forms. It has been extensively discussed in the literature that important components of the flare plasma energy are: the thermal energy Eth, the energy deposited in the form of heat at the volumetric rate EH (ergscm-3 s-1), the energy radiated by the plasma at the rate ER, the energy conducted away at the rate Ec, the energy which flows in or out at the rate Econv (into/out of the region, with the moving plasma), the energy contained in the turbulent motions of the plasma ETurb, and the energy contained in the accelerated particles EAcc. As follows from Chapter 5 of "Energetic Phenomena on the Sun", (1986), the energy terms related to the increase of the potential energy of the evaporated plasma and the kinetic energy of the inflowing plasma may be regarded as insignificant in comparison with the other energies. B. Sylwester at al. (1987, 1988) have used the following relations for calculating the individual energy terms based on the observable physical characteristics of the flaring plasma: The thermal energy
![]()
where Tav is the average plasma temperature in the plasma region
with temperatures above Tmin,
![]() is the emission measure
of this plasma and
V is the volume occupied by this plasma: k is the Boltzman
constant. The minimum temperature Tmin represents the
equivalent minimum temperature of the source plasma which can be determined for
each of the studied lines or broad-band channels, see B. Sylwester et al.
(1989). In the case of DIOGENESS Tmin should be between 4 MK
and 10 MK. The volumetric rate of heating
is the emission measure
of this plasma and
V is the volume occupied by this plasma: k is the Boltzman
constant. The minimum temperature Tmin represents the
equivalent minimum temperature of the source plasma which can be determined for
each of the studied lines or broad-band channels, see B. Sylwester et al.
(1989). In the case of DIOGENESS Tmin should be between 4 MK
and 10 MK. The volumetric rate of heating
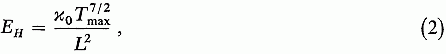
where x0 is the coefficient in the expression for classical thermal conductivity, Tmax is the actual maximum temperature of the thermal plasma in the flaring volume and L is the characteristic semilength of the flaring structure (loop). The radiative losses rate
![]()
where Pr is the radiative loss power which may be estimated for known Tmin as shown by B. Sylwester et al. (1987). The conductive losses rate
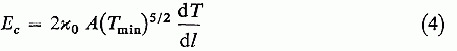
can be expressed in terms of the observables as:
![]()
where A is the cross-section of the flaring flux tube and
 represents an average
scaling factor related to the approximate treatment of the local temperature
gradient (see the above reference for details). The convective rate
represents an average
scaling factor related to the approximate treatment of the local temperature
gradient (see the above reference for details). The convective rate
![]()
where α is the
fraction of the flux conducted from the higher temperature region which returns
back convectively and is close to 1 (see the above reference). For some flares
the effective geometrical parameters may be estimated by integrating the energy
balance equation in time based on the evolution of the three parameters namely
Tmax, Tav and
![]() .
The procedure leading to the estimation of A and L, and
consequently to the solution of the energy balance equation has been described
by B. Sylwester et al. (1986, 1988) and constitutes the base for the analysis of
the parameters derived from the DIOGENESS measurements.
.
The procedure leading to the estimation of A and L, and
consequently to the solution of the energy balance equation has been described
by B. Sylwester et al. (1986, 1988) and constitutes the base for the analysis of
the parameters derived from the DIOGENESS measurements.
The analysis of emission line profiles in the soft X-ray spectrum of flares
provides information on the magnitude of directed and turbulent motions present
in the thermal plasma. The measured intrinsic FWHM of the line may be expressed
in terms of the  , which is
the average velocity of the turbulent motion:
, which is
the average velocity of the turbulent motion:
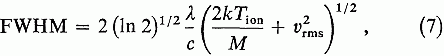
where Tion is the characteristic temperature of kinetic motions of ions producing the line, M is the atomic mass of the corresponding element. It is often assumed that Tion = T. This assumption may be verified by DIOGENESS measurements of line widths for elements of various atomic masses. The spectra of initial flare phases observed by the Solar Maximum Mission Bent Crystal Spectrometer and the Solflex instrument aboard the P-78 satellite indicate that for most flares observed on the solar disc, a small blue-shifted component of strong lines is present. The characteristic velocity of the plasma responsible for the blue-shifted emission may vary between 150 to 300 km/s and is commonly related to the average velocity of the material being evaporated from the dense transition region. The kinetic energy carried by the in-flowing plasma in a column of length 1 may be estimated as:
Table II
The list of important lines to by measured by DIOGENESS.
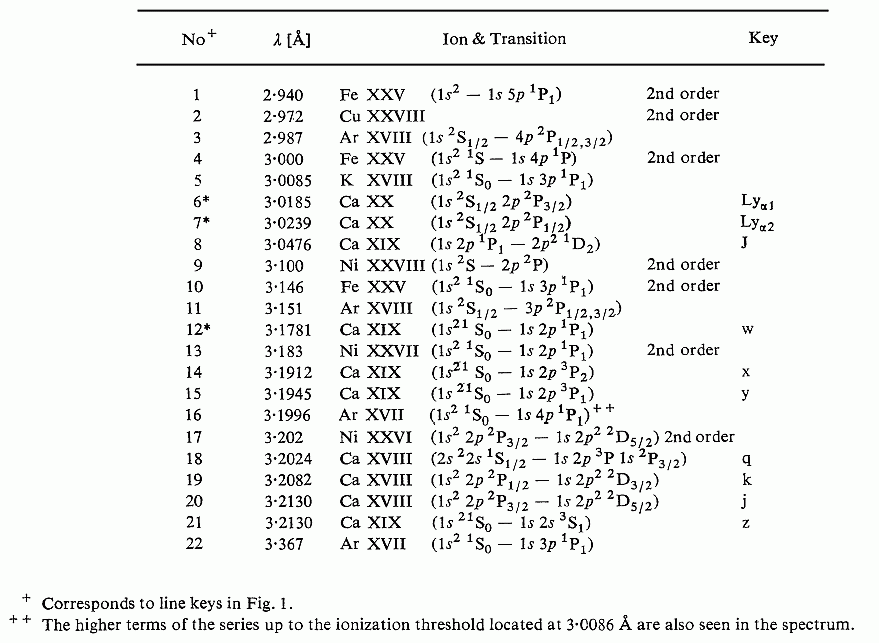
![]()
Therefore, the measurements of the blue-shifts may lead to the estimation of EKin. The incident high-energy X-ray spectrum may usually be approximated by a power law:
![]()
where Ix(E) is the differential flux of
photons with energy
E in keV, and
![]() and
are parameters
determined from least-squares fits to the spectral data. The corresponding
spectrum of non-thermal electrons that results in the observed photon spectrum
is also a power law, of the form
and
are parameters
determined from least-squares fits to the spectral data. The corresponding
spectrum of non-thermal electrons that results in the observed photon spectrum
is also a power law, of the form
![]()
where is
the differential flux of electrons with energy E that enter the thick target.
The parameters β and
δ are related to
![]() and y by the following equations:
and y by the following equations:
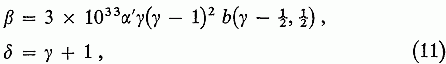
where b is the beta function. The total energy of electrons that enter a thick target during a flare is obtained from:
![]()
In this expression, the lower energy cut-off, Eo,
must be imposed on the spectrum to ensure that the energy EAcc
remains finite. It is very difficult to determine the correct value of Eo
from the observations, but it is usually taken as between 10 and 25 keV. The
analysis of DIOGENESS hard X-ray spectra recorded by the photometer may help to
define the effective Eo value based on energy balance considerations. From the
discussion and Equations (1) to (12) one can see that the combined analysis of
the soft and hard X-ray spectra may lead to the solution of the energy balance
equations for the flares, all of whose prerequisite parameters are known. The
line intensity and continuum level measurements may be used to analyse the
plasma composition. It seems possible that flare abundances may be determined
for the following elements: Ca, Ar, K, and possibly Fe, Ni and Cu, if very big
flares are observed.
The special construction of the spectrometer allows even small motions of
the plasma to be detected, which may help in studying the early phases of
transients, possibly related to the eruption of the flare loop system.
3. Estimation of the Characteristic Parameters
In this section we discuss the methods which will be used to estimate the value of the individual characteristic parameters based on the measured line and broad-band fluxes. The portion of the observed solar spectrum, which will be measured by BS, is shown in Fig. 1.
Average Temperature
We are going to estimate Tav
using the following three ratios:
— the k to w line intensity ratio as determined from the high
resolution spectra of the Ca XVIII to Ca
XIX ions in the 3-16 —3-23 Å
range (line identification is given in Tab. II);
— the Ca XX
 to Ca XIX
w line intensity ratio;
to Ca XIX
w line intensity ratio;
— the ratio of fluxes measured in bands 2 — 4 keV and 4-8 keV.
The reference temperature scale will be based on temperatures obtained from the
k to w line ratio. The value of the Ly to w ratio may be
used to study the ionization state of the plasma. The broad band ratio will be
extremely useful in estimating Tav in early phases of flare
evolution when the spectra are weak (below the sensitivity threshold of the
spectrometer). The broad band ratio temperature scale should be calibrated
using the k to w temperatures during the later phases of flare evolution (close
to flare maximum). The expected time resolution of the broad-band measurements
is 0-1 s, while for the spectral measurements it is 10 to 60 s depending on the
flare intensity.
Emission Measure
The emission measure
 estimations will be based on
the value of the absolute fluxes measured in the individual strong spectral
lines and on the fluxes measured in low energy broad-band channels. For the e
determination it is necessary to know the average temperature Tav
(see previous section). It should be noted that the derived emission measure
values depend on the absolute calibration of the spectrometer and/or photometer.
Therefore substantial efforts are planned to perform a detailed laboratory
calibration of all important instrument characteristics (see Chapter 6).
estimations will be based on
the value of the absolute fluxes measured in the individual strong spectral
lines and on the fluxes measured in low energy broad-band channels. For the e
determination it is necessary to know the average temperature Tav
(see previous section). It should be noted that the derived emission measure
values depend on the absolute calibration of the spectrometer and/or photometer.
Therefore substantial efforts are planned to perform a detailed laboratory
calibration of all important instrument characteristics (see Chapter 6).
Maximum Temperature
The maximum temperature of the thermal plasma component Tmax will be estimated using the satellite-to-resonance line intensity ratio in the Ca hydrogen-like ion (J-to-Ly ratio) in the range 3-00-3-05 Å. High time resolution values will be obtained from the broad-band ratio X2/X3 (see Tab. III).
Table III
Energy bands of the photometer block
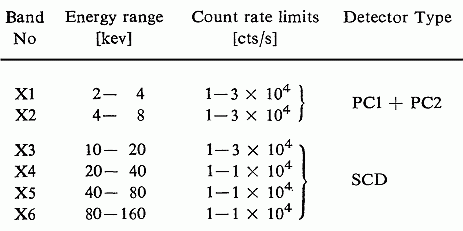
Power Law Fitting
By fitting the power law to the observed high-energy X-ray
spectra measured by the photometer (channels X3 —X6), it will be possible to
derive the appropriate parameters (![]() and
and
![]() )
which allow the energy carried by the non-thermal electrons to be estimated. The
broad band X-ray spectra will be measured in the bands given in Tab. III.
)
which allow the energy carried by the non-thermal electrons to be estimated. The
broad band X-ray spectra will be measured in the bands given in Tab. III.
Line Widths and Blue-Shifts
We are going to estimate the line widths in the process of fitting the synthetic theoretical spectrum to the measured profile, based on the known instrument response function (for details see Fludra et al. 1989). The expected time resolution of the line profile measurements may be as high as 10 s for stronger flares close to maximum. We will try to measure a profile of a single chosen strong spectral line (see asterisks in Tab. II) as frequently as the count statistics allows.
Abundance Determinations
The appropriate
spectra will be recorded mostly in the decay phase of flares, when the
characteristic time of variation of the physical conditions in the source is
longer than the time to record the individual spectrum. The spectra will be
recorded in a relatively wide wavelength interval containing lines from
different elements (see Tab. II). In these later phases of flare evolution, when
the count rates are high, precise measurements of Doppler line shifts will be
especially accurate. Effects of the orbital motion of the Coronas satellite
should be pronounced
4. Design of the Instrument
The Photometer Block
This block contains three types of detectors: two proportional
counters (PC) for the soft X-ray region, one scintillation detector (SCD) for
the hard X-ray region and three semicondutor detectors for detecting charged
particles. The proportional counters are filled with an Ar + 10% CO2 mixture at
350 Torr and their beryllium windows, 100
µm thick, have areas of 01 and 001 cm2.
During low activity the signal from the counter with the larger window is
recorded and fed into the telemetry system and during larger flares the second
(small-window) counter is recorded. If one of these two counters fails, only the
second one is used constantly. Both proportional counters are double-body
double-window type with the Fe55 source on the second window. It enables
constant in-flight calibration. The scintillation detector consists of a Nal(TI)
crystal (8 mm thickness, 50 mm diameter) and a TESLA-VUVET photo-multiplier. The
background level in the detector is passively lowered by using a special
multilayer heavy shielding of Nal crystal. A small mechanical arm with the Am241 radioactive source can be moved out of the shielding to calibrate the
scintillation channel. Six energy bands are derived from both types of detectors
using an amplitude analysis, see Tab. III. All functions of the photometer are
controlled by the on-board computer PRAM. In particular, after switching-on, the
performance of the detectors and electronics is checked and the detectors are
calibrated using built-in radioactive sources. During the in-orbit operation,
the computer selects only the data which contain useful information, reformats
them and feeds them to the telemetry with an assigned time mark. The time
resolution of the measurements may be changed according to the program,
depending on the actual level of the count rate. The detector's high voltage
supply is switched off during passages through the radiation belts. In the
harder channels (X3 — X6) the time resolution may be decreased down to 0-1 s
whereas in the soft channels down to 1 s. Three semiconductor detectors (two
redundant) are used mainly to flag the radiation belt passage, but may also be
used for uncalibrated measurements of the energetic solar particle fluxes
following big flares.
The Spectrometer Block
The general layout of the spectrometer is shown in Fig. 2. It consists of four identical quartz (1011) crystals (first order 2d = 6.6859 Å) organized in two
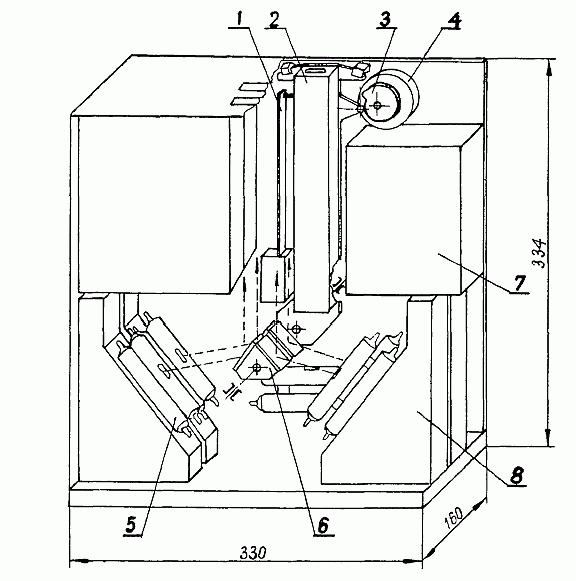
Fig. 2. Isometric drawing showing the Photometer Block of DIOGENESS (dimensions are in millimeters). The numbers in the figure represent the following units: (1) — strain gauge doubly compensated sensor system (2) — scanning collimator mounted on the crystal mobile arm, (3) — Archimedian cam activating the arm motions, (4) — stepper motor and reduction gear, (5) — double proportional counters, (6) — four crystals on a common mount organized into two dopplero-meter sections, (7) — microprocessor controller with related electronics, (8) — pre-amplifier and high-voltage supply units for individual detectors.
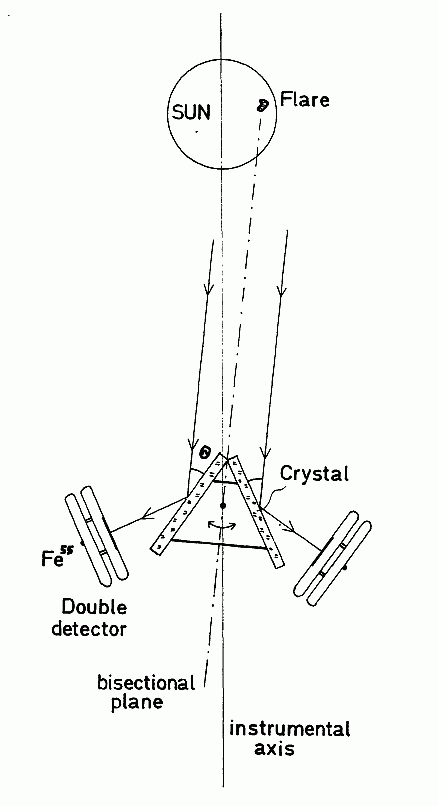
Fig. 3. Diagram of one Dopplerometer section. The situation is shown, when the bisector plane of the crystal section points towards the source. Therefore, the Bragg condition for the chosen strong resonance line is fulfilled for both crystals, and the maxima of the lines are recorded at the same time. If the lines are doppler-shifted, the maxima of the lines are the measure of the radial velocity of the source.
dopplerometer sections. A diagram of the dopplerometer section is shown in Fig. 3. The section consists of the two crystals fixed mechanically to a common shaft at angle
![]()
where the Bragg angle of incidence is given by:
![]()
For the Ca XX section,
 = 26°50'17" corresponding
to the Ca
XX Lyal line, and for the Ca XIX
section
= 26°50'17" corresponding
to the Ca
XX Lyal line, and for the Ca XIX
section
![]() =
28°22'55" corresponding to the Ca
XIX w line (for the first order reflection). Both sections
are mounted on the common shaft rotated by a stepper motor. By rotating the
crystal section, the X-ray spectra are obtained after "reflection" from each of
the crystals. The spectra are recorded by the same type of proportional counters
as used in the BF block. The spectra are scanned in the opposite directions
after reflection from each of the crystals in the section. This arrangement of
the crystals in section (see Fig. 3) allows precise measurements of the possible
Doppler shifts of the measured lines. Any Doppler shift will cause the maxima of
the lines to be recorded at different times during scanning, which enables easy
assignment of the velocity. The positions of the lines within the scan vary
depending on the location of the flare on the disc and the direction in which
the spacecraft is pointing. Possible flare off-sets will not alter the accuracy
of the velocity measurements. The range of scanning is chosen such that if the
instrument is pointed at the Sun's centre, the lines produced by flares
occurring anywhere on the Sun, including those above the limb, will certainly
fall within this range. The largest possible angular range of scanning has been
chosen as ~2° (-15': +105') which corresponds to the wavelength ranges for the
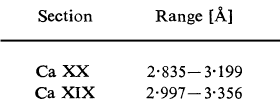
individual sections, shown in Tab. IV. One can see that the
=
28°22'55" corresponding to the Ca
XIX w line (for the first order reflection). Both sections
are mounted on the common shaft rotated by a stepper motor. By rotating the
crystal section, the X-ray spectra are obtained after "reflection" from each of
the crystals. The spectra are recorded by the same type of proportional counters
as used in the BF block. The spectra are scanned in the opposite directions
after reflection from each of the crystals in the section. This arrangement of
the crystals in section (see Fig. 3) allows precise measurements of the possible
Doppler shifts of the measured lines. Any Doppler shift will cause the maxima of
the lines to be recorded at different times during scanning, which enables easy
assignment of the velocity. The positions of the lines within the scan vary
depending on the location of the flare on the disc and the direction in which
the spacecraft is pointing. Possible flare off-sets will not alter the accuracy
of the velocity measurements. The range of scanning is chosen such that if the
instrument is pointed at the Sun's centre, the lines produced by flares
occurring anywhere on the Sun, including those above the limb, will certainly
fall within this range. The largest possible angular range of scanning has been
chosen as ~2° (-15': +105') which corresponds to the wavelength ranges for the
individual sections, shown in Tab. IV. One can see that the
Table IV
scanned wavelength bands
wavelength ranges overlap significantly which allows
cross-calibration of the sensitivities. The range of any single scan may be
chosen by the inner µP
according to the program. The angular step of the scan is 5". The data gathering
interval (DGI = data readout) may be selected between 1/10 and 10 sec.
The observed widths of the spectral lines will depend on the intrinsic line
widths (thermal and non-thermal broadening), on the crystal rocking curve
widths, and the source sizes. However, the thermal widths are larger than the
rocking curve widths (see Tabs V and VI), and the source size (<30'). Thus the
observed line profiles will reflect almost entirely the intrinsic line profiles.
The X-ray brightness profile of the source will be measured with the help of the
scanning slit collimator mounted on the rotating arm with the crystals. The
resolution of the collimator is 5" and the geometrical
Table V
Measured characteristics of the reflection properties of
selected
Quartz (lOTl) crystals*
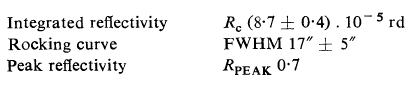
* Synthetic crystals have been manufactured in the Scientific-Production Centre of Electronic Materials at Warsaw. The reflection properties were measured by S. Plocieniak in the Wroclaw Solar Physics Laboratory of SRC, using a double crystal vacuum spectrometer. All values given in the table represent single crystal characteristics derived from double crystal measurements performed for Ca Kα characteristic radiation.
Table VI
Intrinsic thermal widths (in arc sec) and expected count rates (cts/s) at the maximum of strong lines
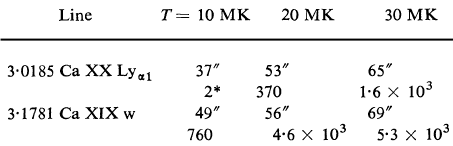
* Count rates at maximum of the line have been calculated for the emission measure 1050cm-3, using the emission functions of Mewe et al. (1985) assuming the detector area to be 0.3 cm2, and the quartz crystal parameters from Tab. V..
transmission 8-5%. The diffraction effects will
decrease the transmission down to ~4% if the energy is around 4 keV. The axis
of the collimator will be precisely co-aligned according to the bisectional of
the crystal planes. Therefore, the brightness maximum should be observed at the
same time as the maximum of the line profile for stationary source. The
information on the distribution of the X-ray brightness profile will help to
separate its contribution to the observed spectral line profile.
For the purpose of proper line shift and profile interpretation
it is of special importance to have precise measurements of the actual angular
position of the crystals and of the collimator relative to the main axis of the
instrument. There are three systems which provide the information on the shaft
angle:
1. The counter of the pulses fed to the stepper motor gives
information on the number of steps from the initial position.
2. A system of masks (holes) mounted on the common axis with an
Archimedian cam driving the shaft.
The relative position of the holes is
expected to be known with an accuracy better than 10".
3. A special strain gauge doubly compensated sensor system allowing the position
of the crystals to be read with an accuracy of ~ 5".
The absolute calibration of the angular position read-out systems will be
possible through the laboratory alignment procedure and the spectral line
position Doppler shifts due to satellite orbital motion. We expect to measure
the shaft angles with a precision better than 10" throughout the whole range of
the scan (2°).
5. Strategy of Instrument Operations
In Tab. VII we present the expected count
rates in all channels of the DIOGENESS instrument for typical and strong flares.
The predictions are based on the calculations of the theoretical spectra of Mewe
et al. (1985). In the calculations we have assumed the calcium abundance
relative to hydrogen as Aca = 7 x 10⁻⁶
(Sylwester 1987). The parameters ( ,
Tav, Tm) of the flares chosen as examples
have been taken from B. Sylwester (private comm. 1989) and correspond to the
maximum phase.
,
Tav, Tm) of the flares chosen as examples
have been taken from B. Sylwester (private comm. 1989) and correspond to the
maximum phase.
The data presented in Tab. VII indicate that channel XI of the BF may be
saturated during the largest flares. The line fluxes at the maximum of the
Table VII
Expected count rates (cts/s) in the individual channels of DIOGENESS
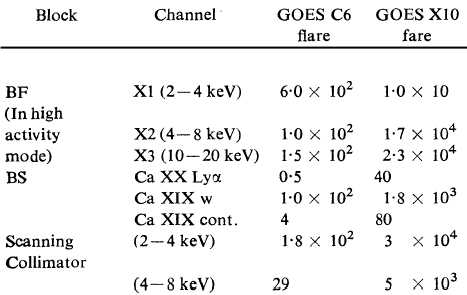
strongest line are of the order of the background for the Ca XX channel, therefore for the weaker flares (smaller than M class in the GOES classification) these lines are not expected to be significant. The Ca XIX w line is nevertheless strong enough for the entire line profile to be observed every 2—3 sees with about 100 counts recorded per line. Therefore, the scan covering the line and the short-wavelength near continuum may be executed every 5 to 10 sees. During initial flare phases when the fluxes are much smaller the scans should be executed in a slower mode. For the large flares, we hope to measure the line profiles, continuum and the blue-shifted line component every few seconds during the rise phase. One of the automatic sequences of scanning will adjust the scan velocity (i.e. the DGI) based on the actually measured count rate at the line maximum. This sequence will be initiated after the flare flag is received from the BF (when the XI or X2 channel fluxes exceed the programmed thresholds). During flare decays the scans will be executed to cover the main resonance and satellite lines (40') lasting ~20 s. These scans will provide the satellite to resonance line intensity ratios allowing the characteristic temperatures of the plasma to be estimated (cf. Section 3). For very strong flares (X-class flares), full scans, containing the complete spectra, will be executed. When the soft X-ray fluxes decrease below the corresponding thresholds, the scanning will be stopped, and the crystals will be moved to the sit and stare position. From time to time, scans will be performed to gather information on the actual distribution of the X-ray sources using the scanning collimator. During satellite nights and/or passages through the radiation belts, full scans will be performed (with the detectors switched off). These lubrication scans are expected to smooth-out the cam surface irregularities which might build-up during limited range scanning and will allow possible slips, which may occur in the stepper motor, to be cancelled.
6. Calibration and Alignment
The intension is that all measuring channels
will be accurately calibrated. The spectral efficiences of all the detectors
will be determined theoretically and checked experimentally using radioactive
standards. These precise measurements will enable us to correct possible errors
caused, for example, by impurities in the Be-window. Window areas will be
precisely determined. Special attention will be given to proper adjustment of
the discrimination levels of the amplitude analyzer. We expect to achieve 1%
absolute accuracy of setting these levels using standard radioactive sources
and a multichannel analyzer for energy calibration.
Continuous inflight calibration guarantees that the pre-flight adjustment will
not be changed during the flight because the signals from the radioactive
sources influence the high voltage power supply in the feedback circuits so
that the energy calibration adjustment is kept constant. All crystals have
already been measured with the use of a double crystal vacuum spectrometer. The
orientation of the crystal planes relative to the optical plane is known with a
precision better than 10". The crystal spacing has been checked, the width of
the rocking curve and the value of the total reflection coefficient have been
determined. Methods have been developed which allow the angle between the
crystals in the single dopplerometer section to be adjusted with the accuracy of
10". The temperature sensors glued to the crystals will constantly measure
their actual temperature to allow corrections for possible temperature
variations of the 2nd — spacing. The characteristic surface of the drive cam has
been measured and the cam will be co-aligned with the disc hole pattern and the
strain gauge and stepper counter control positions. The scanning collimator has
been carefully aligned, the optical plane has been determined, and methods are
being developed which will allow this plane to be aligned with the bisectional
plane of the crystal sections with an accuracy of the order of 10". The
precision of the alignment procedures has been verified during the flight of the
prototype of the instrument aboard the Vertical-11 rocket in 1983 (see J.
Sylwester et al. 1989).
Acknowledgments
We would like to acknowledge the
contribution of J. Ullrich, I. Stupka, J. Soral, L. Karas, A. Abramowicz, J.
Bakala, M. Kowalinski, S. Nowak,
![]() and W. Trzebinski who are involved
in the instrument construction. Mr S. Plocieniak kindly supplied the results of
this measurements of the crystal reflective properties before publication. Dr.
Z. Kordylewski provided the data on the construction of the scanning
collimator. We greatly appreciate the comments of Prof. J. Jakimiec on the
operating schedules for the instrument and thank Dr. B. Sylwester for allowing
us to use the results of her work before they were published.
and W. Trzebinski who are involved
in the instrument construction. Mr S. Plocieniak kindly supplied the results of
this measurements of the crystal reflective properties before publication. Dr.
Z. Kordylewski provided the data on the construction of the scanning
collimator. We greatly appreciate the comments of Prof. J. Jakimiec on the
operating schedules for the instrument and thank Dr. B. Sylwester for allowing
us to use the results of her work before they were published.
REFERENCES
Farnik F., Valnicek B., Sylwester B.,
Sylwester J., Jakimiec J. 1984. Bull. Astron. Inst. Czechosl. 35, 158
Feldman U., Doshek G. A., Kreplin R. W. 1980 Astrophys. J. 238, 365
Fludra A., Lemen J. R., Jakimiec J., Bentley R. D., Sylwester J. 1989
Astrophys. J. 344, 991
1986 Energetic Phenomena on the Sun, (Eds M. Kundu and B. Woodgate) B., The
Solar Maximum mission Flare Workshop Proceedings, NASA Conference Publication
2439
Jakimiec J., Sylwester B., Sylwester J., Mewe R., Peres G., Serio S., Schrijver
J. 1986 COSPAR-86 Proc, in Adv. Space Res., 6, 237
Lemen J. R., Sylwester J., Bentley R. D. 1986 COSPAR-86 Proc, in Adv. Space Res.
6, 245
Mewe R., Gronenshild E. H. B. M., van den Oord G. J. H. 1985 Astron. Astrophys.
Suppl. Ser. 62, 197
Sylwester B., Sylwester J., Jakimiec J., Flundra A., Peres G., Serio S. 1987
Proc. 10-th Europ. Reg. IAU Meeting Vol. 1 (Eds. L. Hejna and M. Sobotka), Pub!.
Astron. Inst. Czechosl. Acad. Sci. No 66, p. 229
Sylwester B., Sylwester J., Jakimiec J. 1988 Proc. IAU Colloquium No. 102 on UV
and X-Ray Spectroscopy of Astro-physical and Laboratory Plasmas
(Beaulieu-sur-Mer, France, September 9—11, 1987) /. de Phys., Colloque C 1, Vol.
49, Suppl. No 3, p. 309
Sylwester B., Sylwester J., Jakimiec J., Bentley R. D., 1990 Solar Phys. 126,
177
Sylwester J. 1987 Artif. Satel., Space Phys. 22, No. 7, Part 3, p. 17
Sylwester J., Hlond M., Kordylewski Z., Kucia W., Nowak S., Ploceniak S.,
Siarkowski M., Trzebinski W. 1991 Art. Satel. in press