IAU Colloq. 144 "Solar Coronal Structures"
V.Rusin, P. Heinzel, & J.-C. Vial (eds.), 257-261, 1994
MANIFESTATION OF MULTIPLE ENERGY RELEASE ON THE EVOLUTION OF FLARES IN THE DIAGNOSTIC
DIAGRAMS
Space Research Centre, Polish Academy of Sciences,
51-662 Wroclaw, Kopernika 11, Poland
Abstract
In the present contribution we advance the investigation of evolution of flares in the emission measure-temperature diagrams. Models are considered in which the flare heating consists of a pair of elementary heating episodes (EHE) taking place in separate loops within flaring region. The parameters of the modelling are: the time profile of heating within individual episode, the time elapsed between individual energy releases and the amount of energy released. Earlier, we have shown that some of the X-ray flares observed by the BCS on SMM display evolutionary patterns
, in the emission measure-temperature diagrams which are hard to interpret in the framework of model with single energy episode. Present analysis offers a possibility to interpret some of these patterns.
Key words: Sun - Flares - Heating Diagnostics
1 Introduction
This contribution advances flare heating diagnostics based on the interpretation of density-temperature (N-T) diagrams. Basic concepts of this diagnostic method have
been described by Jakimiec et al. (1987). In the associated papers detailed results of flare modelling performed using Palermo-Harvard hydrodynamic code (PH) have been discussed (Jakimiec et al., 1992) and applied (Sylwester et al., 1993) to interpretation of number of flares observed by Bent Crystal Spectrometer (BCS) aboard the SMM. In the (N-T) diagrams the density, N, and the temperature, T, characterize plasma conditions at the summit of the flaring loop. Direct estimates of plasma density are usually not available from X-ray observations. Instead, Öe, (e = Ne2L for 1 cm2 cross-sectional area) may be used to characterize the density in cases when the flaring volume does not vary substantially during the event.
In the paper by Sylwester et al. (1993), it was shown that for about half of the observed flares a correspondence exists between modelled and observed patterns of evolution in the (Öe-T) diagrams.

Figure 1. Adopted time profile of the heating function (a) and
examples of the emission measure-temperature diagrams (b-f) for cases when the portions of energy released in the first and the second heating episodes, ( b) and (1 - b), are changing (see values indicated in
the upper left corners in each plot). Dotted line represents the evolutionary pattern in case when the second energy release does not happen.
This indicates that simple, one-dimensional hydrodynamic models are adequate to describe many of the observed flares and the variation of flare heating functions during rise and decay phases can be investigated
in this way. The most important assumptions made in the PH flare modelling are:
the plasma is bounded witha single loop of constant cross-section, single episode of the energy release takes place close to the loop summit, the energy release is uniform across the loop and symmetric relative to the loop summit where the maximum of heating is located.
However, for some of flares the observed inclination during a decay phase is beyond the characteristic limiting values (for OFF or QSS cases, as discussed in Sylwester et al., 1993), or the evolutionary path is composed of a number of distinctive branches.
Possible non-uniformity of the heating across the loop (as discussed in Sylwester et al., 1990a,b)can not usually help to interpret such evolutionary patterns.
In the present work we investigate patterns of evolution in the (Öeca-Tca)
diagrams for cases when the flare energy release is composed of two elementary heating episodes (EHE) separated in time by Dt. Each EHE is assumed to take place in a separate loop stucture and its time profile follows preselected pattern (one of these described by Jakimiec et al.,1992). We treat as a parameter the partial cross-sectional area, b, of the loop where the first EHE takes place (the summed area occupied by the first, and the second EHE is assumed to be 1 cm2). By selecting b we are able to vary the portion of energy released in the first and the second EHE.
2. Models with Double Energy Release
It is well known that during the impulsive phase of some flares multipeak structure is observed in the hard X-ray light curves. These elementary flare bursts (after de Jager, 1979) may correspond to individual EHE which take place in magnetically separated loop systems, often not resolved spatially due to instrumental limitations. To simplify the problem, in the present paper we investigate flare models in which the energy release consists of two EHE. In order to derive the expected pattern of flare evolution in the (Öe-T) diagram we have adopted the following procedure.
At first, we have calculated the expected time variations of individual line fluxes (Fw,k) in lines "w" and "k" of Ca XIX ion (separately for each of the EHE) according to the expression:
|
Fw,k(t) = |
ó
õ
|
fw,k(T)×Ne2(l,t)dl |
| (1) |
Here fw k(T) are the emission functions for "w" and "k" lines known from the theory,T is the plasma temperature, and Ne is the plasma density in the element dl of the loop. Values of T and Ne have been taken from the PH modelling. The integration has been performed over the coronal part of the loop. Next, we superposed the partial contributions to the total flare flux due to both EHE:
|
Fw,k(t) = b×Fw,k(t)+(1-b) ×Fw,k(t-Dt) |
| (2) |
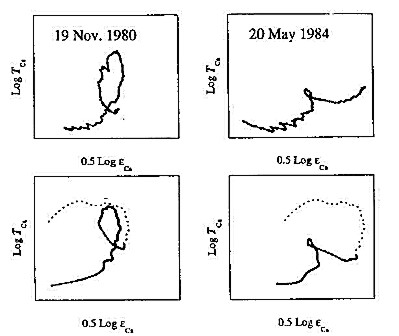
Figure 2.The observed (upper row) and the modelled behaviour of emisssion measure-temperature patterns for two flares. Dotted line represents the modelled evolutionary pattern during the initial period not covered by the observations.
For t £ Dt, only the first term in eq. (2) is taken into account. We have interpreted the values of Fw,k(t) in terms of a standard isothermal approximation.In this way we were able to derive the history of temperature, Tca(t), and emission measure,eca(t), variations for the modelled flare and to plot (Öeca-Tca) diagrams.
In Fig. 1 examples of (Öeca-Tca) diagrams are shown for the choosen model.
The time dependence of the heating in each of the EHE has a triangular shape of duration 100 s (see Fig. la). In Figs 1b -1g we illustrate how the pattern of evolution varies depending on partial contribution b.
We have analysed a number of combinations for the assumed time profile and the portion of energy being released in the first and the second EHE. We have analysed also the role of the elapsed time, Dt.
The overall goal was to reproduce the observed behaviour of flares in the (Öeca-Tca) diagram for events belonging to the "not explained" catagory in the paper by
Sylwester et al., (1993), i.e., those which were not accounted for in the framework of a single flare energy relase scenario.
In Fig. 2 we present two examples of the (Öeca-Tca) diagrams derived from
observations (the upper row) and for the comparison, corresponding modelled diagrams. It is seen that decay parts on the modelled diagrams (heavy line) reproduce the observed patterns. For the flare on 19 November 1980 (left column) the heating is most probably composed of two pulses characterized by a constant level of heating lasting for 180 s with the following exponential decrease of the heating rate (e-folding decay time of 60 s), The time elapsed between individual EHE is Dt = 470 s in this case and b = 0.6. In the case of 20 May 1984 flare, (right column) the first energy pulse has the same time profile as for 19 November 1980 flare, but the second energy pulse is of rectangular shape characteraized by the value of the maximum heating rate
an order of magnitude smaller (i.e., 1 erg cm-3s-1). The second EHE in this case is delayed by Dt = 530 s and b = 0.2.
3. Conclusions
We have modelled evolution of flares in the (Öeca-Tca) diagrams for flares with double elementary heating episodes (EHE) following shortly each other. The time profile of individual EHE corresponds to selected flare scenario described in Jakimiec et al. (1992). Depending on a choice of the parameters characterizing adopted flare model (i.e., the time profiles of elementary heating episodes, the time elapsed between them and the part of energy released in the first and the second episodes) diverse evolutionary patterns are traced in the (Öeca-Tca) diagrams. Some of them are found to closely reproduce the observed behaviour, as derived based on the analysis of Ca XIX ion spectra obtained by the BCS on SMM.
Still, not all flares observed by the BCS can be satisfactory explained within the framework of double or even multiple process of elementary energy releases. Interpretation of (Öeca-Tca) diagrams for such events may most probably be possible in the case when the EHE lasts for much shorter times (5 s - 20 s) than those incorporated in the present study.
References
de Jager, C.: 1979, Sol. Phys. 64, 135
Jakimiec, J., Sylwester, B., Sylwester, J., Lemen, J. R., Mewe, R., Bentley, R. D., Peres, G.,
Serio, S., and Schrijver, J.: 1987, in Solar Maximum Analysis, eds.: V. E. Stepanov, V.
N. Obridko, VNU Science Press, Utrecht, 91
Jakimiec, J., Sylwester, B., Sylwester, J., Serio, S., Peres, G., and Reale, F.: 1992, Astron.
Astrophys. 253, 269
Sylwester, B., Sylwester, J., Serio, S., Reale, F., Bentley, R. D., and Fludra, A.: 1993, Astron.
Astrophys. 267, 586
Sylwester, B., Sylwester, J., Jakimiec, J., Serio, S., Reale, F., Bentley, R. D, and Fludra, A.:
1990, in The Dynamic Sun, ed.: L, Dezso, Publ. Debrecen Obs., Vol. 7, Debrecen, 255
Sylwester, B., Sylwester, J., Bentley, R. D., and Fludra, A.: 1990, Sol. Phys. 126, 177
BACK

