ACTA ASTRONOMICA
Vol. 46 (1996) pp. 15-28
Improvement of SXT Image Alignment in Order to Obtain High-Resolution Temperature Maps
by
M. Siarkowski and J. Sylwester
Space Research Center of Polish Academy of Sciences. Solar Physics Division, ul. Kopernika 11,51-622 Wrocław, Poland e-mail: ms@cbk.pan.wroc.pl
J. Jakimiec and M. Tomczak
Astronomical Institute, Wrocław University, ul. Kopernika 11, 51-622 Wrocław, Poland e-mail: tomczak@astro.uni.wroc.pl
Received January 15, J996
ABSTRACT
Examples are shown and discussed which indicate that published temperature maps derived using SXT intensity ratio technique may be substantially biased if standard image processing routines are used to coalign the images. Methods are discussed which allow for independent of the Yohkoh satellite pointing information, precise (0.12 arcsec), alignment of images obtained in selected energy bands (filters). Examples are presented illustrating the differences in the temperature maps derived using standard and additional pointing correction (APC).
Key words: Sun: corona — Sun: X-rays, gamma rays
1. Introduction
Ratios of intensities measured in two di fferent energy bands contain information
on the temperature of emitting plasma provided that the same region contributes to both bands. For images from the telescopes like SXT, the temperature determination from frames obtained with the highest possible resolution (2.45 x 2.45 arcsec) is delicate since derived values of temperature are extremely sensitive to proper relative alignment of the images as registered through different filters. For the Yohkoh SXT instrument (Tsuneta et al. 1991), we have to interpolate the emission patterns since the images obtained through different filters are not recorded simultaneously (see Fig. 1). Between recordings, the mechanical activator rotates the
filter wheel(s) what causes substantial pointing jitter. It is shown below that the accuracy of image alignment in the standard Yohkoh reduction procedure may be improved to assure that the temperature maps obtained by "filter ratio" technique are correct.
For the study described here we have selected the SXT flare images obtained through Al12 and Be119 filters since sequences of these images are commonly used to study evolution of the physical characteristics in the flaring area. The selected filters are the most useful in determination of temperature distribution in flares. In Section 2 a short description of data reduction and image alignment is given and in Section 3 we describe the profound consequences of small misalignment on derived distribution of temperature. In Section 4 we describe improved techniques of image coalignment. Examples of temperature maps obtained using both standard and improved techniques are compared in Section 5 for three flares observed by SXT. In Section 6 we summarize and discuss the obtained
results.
2. Data Reduction and the Accuracy of Standard Alignment
Following the Yohkoh SXT Team recommendations, we used a standard reduction procedure
(Morrison, 1994) to reduce the data:
• we extracted sequences of All2 and Bel19 images using Yohkoh IDL program YODAT,
• we calibrated the data using SXT.PREP procedure (for decompression, dark current and pin
hole leak subtraction, time normalization [DN/sec.], identification of saturated pixels). We have used the key: /reg to
remove S/C jitters and SXT fine pointing time variations,
• we have interpolated hi time the intensities of A112 signal in order to match the times of Bel19 image registrations
• we used SXT _TEEM procedure to compute maps of temperature distribution from the corrected SXT images.
We have noticed specific behavior of the satellite pointing during periods of frequent changes of filters (execution of flare sequences). This "filter activity" causes repeatable changes of the satellite pointing as illustrated in Fig. 1. The pattern of changes reflects the cadence of filter changes. As is seen for 13 January 1992, during the execution of flare sequence the satellite pointing jitter develops, with an amplitude of 1.6 arcsec. It is clearly seen (bottom panel) that the pointing behavior is directly related to execution of particular filter activation cadence. Our study (see below) indicates that application of standard corrections for alignment (contained in the
SXT_PREP package) does not fully accommodate for this jitter of the pointing. Additional, residual sub-arcsec shifts between Al and Be images are still present as detected by the methods illustrated in Section 4.
In order to better understand possible dependence of derived temperature distribution on precise alignment of images, we performed the exercise described in fhe next Section.
3. Dependence of Derived Temperature Map on Alignment of the Images
Selected signal ratio (Bel19/A112) provide the most sensitive SXT diagnostics of the temperature in the range T > 10 MK characteristic for flaring plasma. We have carried out the following investigation of the effect of small misalignment of the SXT images on the resulting temperature map:
1. we selected the calibrated All2 image as a reference (image corresponds to the rising phase
of 19 Nov. 1991 flare at 09:29:09)
2. we assumed, that the Bell9 signal is everywhere equal to 0.8 of the A112
signal, i.e., that the plasma temperature equals 13.87 MK everywhere in the map.
3. we introduced the offset of Al image in respect to Be image by certain, small amount (selected unit was 1/20 of SXT pixel i.e., ≈ 0.12 arcsec) and calculated temperature distribution from Bel19/AI12 signal
ratio.
To take into account die sub pixel shifts, we interpolated the original images using 20 times finer mesh using the TRLSURF IDL routine, moved the Al grid by desired offset and rebinned the shifted images to initial dimension using CONGRID IDL routine. By definition, for the null offset (i.e., images perfectly overlaid) the ratio of signals is uniform all over the frame, and therefore the derived temperature is uniform, being everywhere T = 13.87 MK. However, if the Al image is even slightly offset, a characteristic pattern of temperature structure develops, depending on the direction of the shift. In Fig. 2, a composite of eight temperature maps is shown in grey scale representation corresponding to appropriate (E-W, N-S) shifts of Al relative to Be image by 0.12 arcsec. It is clearly seen, that by shifting Al image to the East/West (right/left images in the middle row), ridges of higher/lower than the average temperature develops at the West/East edges of both arms of the flaring loop. White contour on each of the maps represents the same isointensity line drawn at 0.4 of me maximum Al intensity value. In the upper/lower row similar comparison is shown when additional shift of Al image by 0.12 arcsec to die North/South is applied.
It is important to note, that the temperature differences between the hotter and cooler regions shown in Fig. 2 correspond to ≈ 1.5, 3 and 6 MK for offsets of 0.12, 0.25 and 0.5 arcsec respectively. Such strong dependence of the derived temperature map to very small Al/Be relative image shifts indicates that precise alignment of images (up to 0.1 arcsec) is necessary to keep uncertainties due to misalignment lower than the expected accuracy of the temperature estimate from intensity ratio technique (≈ l MK).
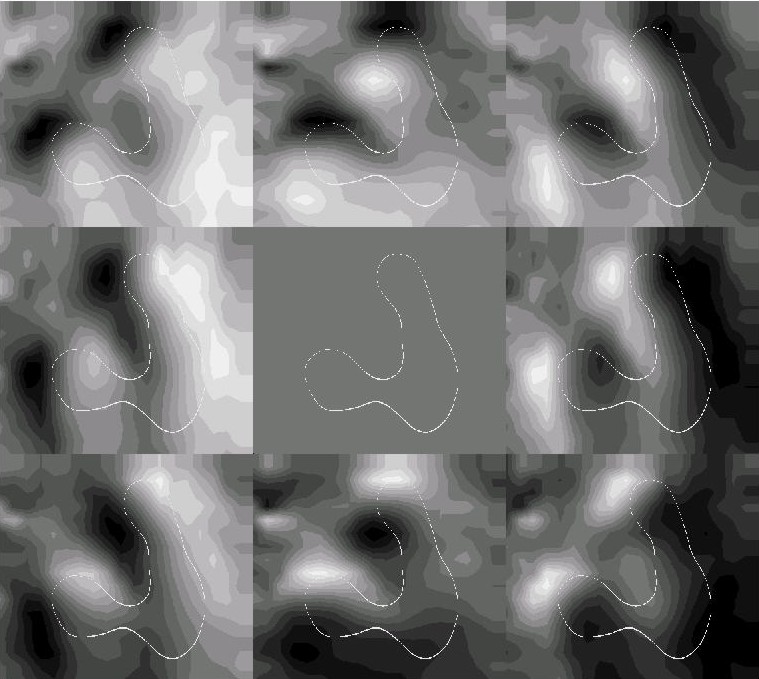
Fig. 2. A composite of eight temperature maps in gray scale representation (dark is cooler). Central image corresponds to null shift between images. Images to the left/right correspond to the case when the Al image has been moved relative to Be image by East/West respectively. Similarly upper/lower images represents the shifts in ihe North/South direction, etc. White contours on each of the maps represent the same isointensily line drawn at 0.4 of the maximum Al intensity value. The range of temperatures observed for 0.12 arcsec shift is 13 ÷ 14.5 MK.
4. Image Coalignment Methods
We have tested three methods of additional coaligninent between Bel19 and A112 images. These methods can easily be adopted to coalign images obtained through other filters. All three methods rely on the assumption that the contributions to both Al and Be signals are coming from optically thin flaring plasma. The distribution of the signal on the images reflects mainly the distribution of the emission measure since the temperature dependence of emissivity in both filters is similar. Therefore we postulate that the intensity distribution on both images should correlate closely. The alignment methods tested are as
follows:
• The "contour association" method. We define the shape and area of Be image contour at the assumed level
(we used 0.1 or 0.3 of the maximum value). Next, we search for the corresponding Al contour of the same area. Having both, using the IDL Astronomy User's Library subroutines COR-REL.IMAGES, CORREL_OPTIM1ZE and CORREL_ANALYZE written by Frank Varosi (STX NASA/GSFC), we try to find the optimum offset in terms of the value of cross-correlation function. Tenfold rebinning of images is applied. In the assumed convention axis x is in W/E (W - positive) and axis y in N/S (N - positive) direction, respectively. So the offset x = 0.5, y = 0.5 means that A112 image is to be shifted by 0.5 pixel to the West and by 0.5 pixel to the North in order to obtain the best overlapping with the Bell9 image. In die present analysis the BelI9 images were always treated as reference frames. For 0.1 SXT pixel mesh the array of values of the cross-correlation function is created. We search for coordinates of the extreme in this parameter surface which corresponds to the residual shifts dx, dy. The accuracy of location for the extremum is ≈ 0.05 of the SXT pixel
size.
• The maximization of the product of intensities in the Al and Be images. This product should reach maximum value for perfectly aligned images.
• The variance minimization method. This method directly addresses the problem of temperature
estimations. The criterion we use is to find the optimum offset between the images which results in the lowest total variance of the temperature within the area of significant signal (above 0.1 of the maximum value for given Be image). N.B. the value of this variance is null for the central image shown in Fig. 2.
From the comparison of the shape of the parameter surface for the three described optimization methods, we have found that the third criterion gives the sharpest minimum while the second gives rather smooth maximum. However, all of the three methods considered, when applied to the sequences of images for the three considered flares give similar values for the investigated additional pointing correction (APC). This is strong indication that:
• the additional Al/Be offset corrections are necessary
• their values are reliably determined by means of the above discussed methods.
After applying the APC procedure, the alignment accuracy between Al and Be images is of the order of 0.12 arcsec. This number follows from the comparison of optimization results for the first and the third of the described
methods.
5. Results
In Fig. 3 we illustrate the differences between the temperature maps as obtained from the "standard" and APC alignment processing for the sequence of 19
Nov. 1991 flare images. When applying the variance method, the distribution of temperature on the image corresponds to minimum of the total variance of the temperature and therefore, the actual differences in the temperature present on the temperature map might be considered as lower limits.
After APC, we have found that the distribution of temperature within flaring structure is substantially more uniform over the image as compared with the standard corrections (SXT_PREP). In Fig. 4 (upper panel) we plot derived offsets (dx,dy) for the 19Nov. 1991 sequence of flare images. Frame number represents the time (horizontal axis) while the derived APC's are expressed in SXT pixel size (2.45 arcsec). In the lower panel of Fig. 4 we show the time variations of the temperature for 19 Nov. 1991 flare. The temperatures plotted represent maximum values found over the area of significant signal. The upper curve (diamonds) corresponds to the case when standard reduction of the data (SXT.PREP alignment corrections) has been applied while the lower line (asterisks) to the case when APC procedures were subsequently used. It is seen that applying APC causes the maximum temperature in the flaring area to decrease substantially.
Similar study has been performed for the other flares as well. In Fig. 5 we show a sequence of the temperature maps derived for flare of 13 Jan. 1992 at about 17:30 UT and in Fig. 6 the derived values of APC (dx, dy) are shown together with the differences of maximum temperatures (as in Fig. 4). Nearly constant in time, systematic APC of about 0.4-0.5 pixel to the West has been found. Offsets along N-S direction are slightly smaller. Maximum values of temperatures after APC are generally lower. All temperature maps obtained before APC have the temperature maxima close to the West edge of the flaring loop as in the paper of Masuda et al. (1994). After the corrections, pixels with a higher temperature are still located near the edges of a loop, but they are distributed symmetrically relative to the loop axis. This edge enhanced temperature pattern is definitely of instrumental origin. It arises as a result of different widths of point spread function (PSF) of the SXT which depends on the energy and position within theFOV (cf. Martens et al. 1995). However, differences in PSF between channels do not influence substantially the results of APC procedure. In order to remove the effects of the PSF dependence, the deconvolution of images in respect of PSF is advised before derivation of final temperature pattern from the SXT images.
In Figs. 7 and 8 effects of APC applications are shown for the flare on 21 Feb. 1992 at 03:20 UT. This flare was already analyzed by Tsuneta et al. 1992. Forthis
event, rather large APC shift of 0.7 pixel is mostly necessary to overlay the images properly. Such a large shift causes substantial differences in the pattern of the temperature distribution as illustrated in Fig. 7. After applying the APC procedure, the maximum temperature is found to be located inside the flaring volume and not close to the northern edge of the
structure.
Fig. 3. The comparison of temperature distributions as obtained before and after applying the additional pointing correction. Frame in the particular flare sequence is indicated by the number. North is up, West is to the right.
Fig. 4. Top panel: Values of additional offsets in x (E/W) (*) and y (N/S) (◊) direcdons obtained by applying described additional pointing correction (APC) methods.
Bottom panel: Values of maximum temperatures as obtained for each pair of images before (*) and after (◊) correction for
APC.
Fig. 5. The comparison of temperature distributions as obtained before and after applying the additional pointing correction. Frame in the particular flare sequence is indicated by the number. North is up, West is to the right.
Fig. 6. Top panel: Values of additional offsets in x (EAV)(*)and y (N/S) (◊) directions obtained by applying described additional pointing correction (APC) methods.
Bottom panel: Values of maximum temperatures as obtained for each pair of images before (*) and after (◊) correction for
APC.
Fig. 7. The comparison of temperature distributions as obtained before and after applying the additional pointing correction. Frame in the particular flare sequence is indicated by the number. North is up, West is to the right.
Fig. 8. Top panel: Values of additional offsets in x (E/W)(*)and y (N/S) (◊) d by applying described additional pointing correction (APC) methods. Bottom panel: Values of maximum temperatures as obtained for each pair of images before (*) and after (◊) correction for APC.
6. Discussion
In a number of papers already published, the high-resolution temperature maps obtained from image ratio analysis based on standard treatment of SXT alignment have been presented and discussed. Present considerations indicate, however, that corrections for Yohkoh pointing jitter (as derived from the attitude control system) are sometimes incapable (in the high-spatial resolution flare mode) to align images to desired accuracy and therefore, the temperature maps derived may show distorted picture. Patterns resembling those presented in Fig. 2 can be easily identified on the published flare temperature maps (e.g., Tsuneta et al. 1992, McTiernan et al. 1993,Tomczak l994, Masuda et al. 1994, Feldman et al. 1995).
It is important to note that the best overlap between Be and Al images is achieved for the APC's of ≈ 0.2 ÷ 0.7 pixel for the three flares considered. The magnitude of this residual correction is within the amplitude of pointing jitter shown in Fig. 1. So the most probable explanation of the necessity of the APC is that the amplitudes of the shifts between individual CCD exposures are larger than the amplitudes indicated at die location of the pointing control system.
Therefore, we advice to apply the APC for image alignment before the temperature maps are derived from the SXT intensity ratio. We are working now on the algorithm of fine SXT image coalignment which we intend to implement into the standard SXT analysis package. In the studies of the temperature distribution with lower spatial resolution (> 5 arcsec), the APC do not improve the results
substantially.
Acknowledgements. The work was supported in part by The British Council - Polish Committee for Scientific Research (KBN) visit exchange program, in part by KBN grant 1007/S/IA/94 to Wroclaw University, and in part by KBN grant 2.P03D.006.10.
REFERENCES
Feldman, U., Seely, J.F., Doschek, G.A., Brown, C.M., Phillips, K.J.H., Lang, J. 1995, Astrophys. J.,
446,860.
Martens, P.C., Acton, L.W., and Lemen, J.R. 1995, Solar Phys., 157, 141. Masuda, S., Kosugi, T., Kara, H., Tsuneta, S., Ogawara, Y. 1994, Nature, 371, 495. McTiernan, J.M., Kane, S.R., Loran, J.M., Lernen, J.R., Acion, L.W., Hara, M., Tsuneta, S., and
Kosugi, T. 1993, Astrophys. J. Letters, 416, L91.
Morrison, M., 1994, Yohkoh Analysis Guide, Lockheed Palo Alto Research Laboratory. Tomczak, M., 1994, PhD thesis, Wroclaw University. Tsuneta, S., Hara, M., Shimizu, T., Acton, L.W., Strong, K.T, Hudson, H.S, and Ogawara, Y. 1992,
Publ Astron. Soc. Japan, 44, L63.