 fig1.eps.gz
We have analysed the eight flares which occurred in the active
region NOAA 6919 during its passage across the solar disc between
8th and 20th November 1991. The main data
set used consists of X-ray images as recorded by SXT and HXT on Yohkoh.
The optical filter images have been available during this early
period of SXT operation. Before performing detailed analysis, the
SXT images have been deconvolved (resolution increased down to
1 arcsec) and carefully coaligned. The hard X-ray emission
pattern has been reconstructed from HXT data using the maximum
entropy method (MEM). Hard and soft X-ray images have been
coaligned and the locations of hard and soft X-ray sources have
been intercompared. Next the time variations of hard and soft
maximum brightness locations have been investigated. For the
flares reported we noticed distinctive pattern of evolution for
both soft and hard X-rays most probably representing the
systematic rearrangement of global magnetic field organisation
within this active region.
Key words: solar physics; flares; deconvolution; flare kernels dynamic
One of the particularly well observed active region during the initial period of Yohkoh operation was active region NOAA 6919. In this early period of operation the optical aspect sensor data have been available which allow for direct comparison of X-ray emision sources relative to sunspots. The NOAA 6919 emerged from behind the eastern limb as already well evolved active region. This region has been quite active producing 47 flares during its passage across the disc in the period between 8th to 20th November 1991. The solar meridian crossing took place on 14th November. On 20th November the region has been occulted by the western limb, still producing the flares visible in the corona. In the paper by Hara et al., (1992) this active region has been analysed during non flaring periods. The filter ratio method has been applied to the original images made using five available filters of SXT. Here we have focused on the analysis of the flare mode observations which have been prior deconvolved using ANDRIL maximum likelihood package (Sylwester and Sylwester, 1998, 1999). From among 47 flares which occured in AR 6919 most of them were small events (subflares) in addition to one 1B, two 2B and one 3B flares. In the GOES classification these flares belong to C and M class mainly. Only one flare (on 15th November 1991) has been classified as X1.5. This was particularly interesting and distinguished flare as it has been observed in white light emission as well. To our knowledge a total of 17 papers have devoted to its extensive analysis in various energy bands. (The first was by Sakao et al., 1992 and the last by Moon et al., 1999.) For eight flares Yohkoh executed very good flare sequences starting from the beginning of the impulsive phase. These sequences have been analysed in the present paper. In Table 1 the main characteristics for these flares are reported.
| No. | Data | Time | GOES | Ha | Coordinates |
| 1 | 10Nov91 | 20:13 | M7.9 | 1N | S15 E43 |
| 2 | 13Nov91 | 21:26 | M1.3 | - | S14 E11* |
| 3 | 15Nov91 | 22:39 | X1.5 | 3B | S13 W19 |
| 4 | 16Nov91 | 19:46 | C5.3 | SN | S13 W29 |
| 5 | 17Nov91 | 02:01 | M1.5 | 2B | S13 W33 |
| 6 | 18Nov91 | 10:58 | M1.1 | 1B | S15 W50 |
| 7 | 19Nov91 | 09:32 | C8.5 | 1F | S12 W60 |
| 8 | 19Nov91 | 19:26 | C5.2 | SF | S15 W69 |
* The coordinates have been interpolated.
The basic data we have used in our analysis are the Soft X-ray Telescope (SXT) images recorded in the flare mode (64 x 64 pixels). They have been deconvolved using ANDRIL algorithm (Sylwester and Sylwester, 1998, 1999). The deconvolution removed the image blurring due to the instrument PSF and increased numerically the spatial resolution of the images up to below 1 arcsec. As the result of deconvolution we obtain the array of 320 x 320 subpixels for the sequence of frames. The deconvolved images have been carefully coaligned to within the fraction of arcsec. During the analysed period the optical filter on Yohkoh has been operating so we were able to compare the location of soft X-ray sources with the white light images which indicate for solar spots of active region. (The optical images have been deconvolved as well but only a limited iteration steps, usually 10, have been performed.) We have used also the Hard X-ray Telescope (HXT) data for individual events. The hard X-ray images have been reconstructed using maximum entropy method (MEM) of Yohkoh software. Then they have been coaligned with soft X-ray images and the location of hard and soft X-ray emission sources have been intercompared. In Fig. 1 we present the eight flare frames taken during the early impulsive phase of each of the events (the time usually corresponds to the first MEM reconstructed HXT image available).
fig1.eps.gz
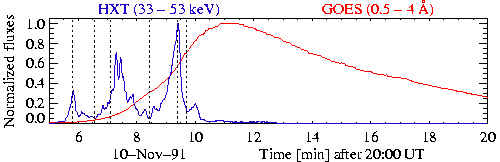 fig2.eps.gz
 fig3.eps.gz
The aspect sensor and SXT images are taken as the closest in time (usually few seconds apart). The size of individual image is the same for all flares and represents 54 x 54 arcsec area (39000 x 39000 km on the Sun). The soft X-ray contours represent the SXT Al12 deconvolved image while the hard X-ray isophots correspond to M2 HXT channel (33 - 53 keV) where available. All contours are drawn at 0.3, 0.5, 0.7 and 0.9 of the maximum intensity within the considered area. The source emission for 18th November flare is much more extended in comparison with rather compact hard X-ray patches for other flares. This broader appearence reflects the fact that only the lower L channel emission (14 - 23 keV) has been strong enough to allow for this flare the image reconstruction. The HXT data for 17th November have been unfortunatelly corrupted and for 19th November flare at 19:05 UT the HXT signal was at the noise threshold. It is seen that for all investigated flares the soft X-ray structures are quite complicated in shape and in no case a simple loop-like emitting structure can be assumed to represent the data even qualitatively. The hard X-ray emission is generally not cospatial with the soft emission component however they appear to be related. The X-ray emission usually tends to avoid sunspots. Only for the white light flare on 15th November 1991 there is the coincidence of the location for one of the soft X-ray emission kernels with the sunspot (this is very uncommon).
In Fig. 3 the sequence of six images representing evolution of soft and hard X-ray emission during 10th November 1991 flare is shown. Presented images cover about 5 min of evolution when the hard X-ray emission was prominent. The HXT and GOES light curves covering the period of analysed flare are shown in Fig. 2. The SXT and HXT contours are overlied on the corresponding optical image displayed in the grey scale. The solid line represents contours drawn at 0.3, 0.5, 0.7 and 0.9 of maximum intensity levels for Al12 filter. The dashed line represents the same contours for M2 channel of HXT (33 - 53 keV). It is clearly seen that the main soft X-ray emission patch is located between the solar spots. It looks rather elongated and changes its shape substantially during the flare rise. At the times of first two impulsive spikes the hard X-ray emission is concentrated in the upper/central part of the field of view. Later on the hard X-ray emission is seen to switch towards the lower end of the SXT patch. The right image in the middle panel corresponds to the valley preceded the most intense hard X-ray spike. At this time the hard X-ray emission is already seen far from the soft X-ray emission pattern. The left image in the low panel corresponds to the third, most intense hard X-ray spike. Although this flare has not been reported as white light one the white light emission in proximity to the hard X-ray patch is well seen during this third spike occurrence.
In Fig. 5 the 13th November's 1991 flare images for the four characteristic times during the evolution are presented (cf. peaks and valleys on the hard X-ray light curve indicated by dashed vertical lines in Fig. 4). The individual pictures are composed as before. During presented 8 min of the flare evolution the remarkable change of emission pattern in both soft and hard X-ray bands took place. One can notice the change of X-ray emission location relative to the sunspots. Once again it is seen that the X-ray emission patches avoid the umbra locations and the hard X-rays come usually from slightly different locations in comparison with soft X-rays. However, the SXT and HXT patches coincide in projection on the solar disc at the very end of impusive phase (at the maximum of soft X-ray radiation as seen in Fig. 4). This is seen on the last image of the sequence presented in Fig. 5.
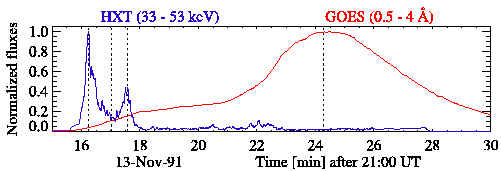 fig4.eps.gz
 fig5.eps.gz
In Fig. 7 the relative location of optical, soft and hard X-ray emission during the evolution of white light flare observed on 15th November 1991 is presented. The images for the six times indicated by vertical dashed lines in Fig. 6 are shown. During the very early phase of the evolution (the first row which corresponds to the low level of hard X-ray flux) especially dynamic changes of the soft and hard X-ray patterns took place. As the flare progress the general simplification of the shape of both emissions is seen. During the main spikes and the decay of hard X-ray emission (the second and third rows in Fig. 7) the pattern of soft and hard X-ray emissions do not change so much. Similar to the other discussed flares the soft and hard X-rays are not cospatial. As has been already mentioned for this particular flare one of the soft X-ray kernel is located (in projection) within the sunspot's umbra (see the first image in Fig. 7). The centers of soft and hard X-ray emissions change their locations evidently pointing towards the local restructuring the magnetic fields topology during analysed period.
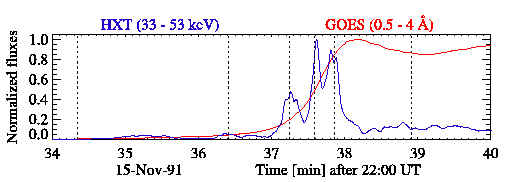 fig6.eps.gz
 fig7.eps.gz
In Fig. 8 we present pictures illustrating the time variations of SXT emission during all analysed events. They cover both rise and part of the decay phase of each events (these for which the SXT data were available). The evolution of maximum brightness location is displayd as contours drawn at 0.8 of maximum intensity for SXT Al12 deconvolved images. The contours are overlied atop the emission pattern (in grey scale) of the first unsaturated image within the sequence. The shades of grey of the contours represent time (usually several minutes of evolution). Only for the flare on 10th November, more than 30 min of evolution is covered. Contours corresponding to the event start are dark becoming brighter towards the end of presented sequence. The change of maximum emission location during flare evolution is clear for all investigated cases. The pattern of changes does not seem random and has definite organisation. This evolutionary pattern reflects a highly complicated, however systematically varying topology of local magnetic fields within NOAA 6919 for all investigated flares. For the sake of better visualization the complementary to presented in this contribution pictures but coloured ones are available at http://www.cbk.pan.wroc.pl/publications/1999/properties.htm.
We have analysed the morphology and the dynamics of soft and hard X-ray emitting plasma for eight flares produced within active region NOAA 6919 during its crossing the solar disc. The flares have been observed by the instruments aboard the Yohkoh satellite. The main data set used in the present study consists of the time sequences of deconvolved SXT images recorded in the flaring mode and HXT M2 channel images reconstructed using MEM. The analysed solar flaring structures have been observed in projection on the solar disc. The morphology of observed structures is seen to be very complicated. The structures are composed of emitting blobs of plasma (kernels) and the connecting elongated structures, usually of fainter emission. Some of these connections take a form of loops. For all events analysed the observed patterns of SXT emission are similar in size. General morphological similarity of the evolutionary pattern of SXT/HXT emissions for various flares is noticable. Remarkably similar form of overall X-ray emission is observed for pairs of flares on [10 and 13], [16 and 17], 19 at [09:30 UT and 19:05 UT]. As the solar corona is structured by the magnetic fields the similarity of observed shapes points towards the existence of rather stable global magnetic fields topology (on the timescales of days). During individual events the same structures are sometimes activated multiple times. Our analysis show that the dominating coronal kernels change their location in the corona. The observed transversal displacements are very much the same as seen on the images obtained using various SXT filters.
The main findings of the present study are the following:
 fig8.eps.gz
This work has been supported by the Grant: Organisation of Magnetic Fields in the Corona 2.P03D.024.17 of Polish Committee for Scientific Research.
e-mail bs@cbk.pan.wroc.pl
File translated from TEX by TTH, version 2.25.
On 22 Sep 1999, 10:03.