 figcol1.ps(20k)
We present and discuss evolution of flaring structures morphology as observed on deconvolved soft X-ray images. The X-ray images have been obtained using the Soft X-ray Telescope (SXT) on Yohkoh. The deconvolution has been made using the iterative maximum likelihood algorithm ANDRIL. On the reconstructed images it is possible to study the position of individual fine structures for the first time with the resolution superior to the SXT pixel size. We show example of the analysis of deconvolved images for one disc flare on 11 July 1992 at 15:25 UT. Corresponding figures and animations for two other flares are available at the address www.cbk.pan.wroc.pl and on the Acta Astronomica Archive (see second cover page for details). These flares occured on 19 November 1991 and on 13 January 1992 and have been located near/at the limb. We conclude about the differences of physical conditions of the flaring plasma confined in compact bright regions (kernels) located in the footpoint and summit areas.
Key words: X-rays: Flares: SXT - kernels - evolution -
physical conditions
In the previous papers by Sylwester and Sylwester (1998a, c) we have described details of the ANDRIL algorithm used for deconvolution of images obtained by the SXT instrument. The SXT operates at present on board Japanese Yohkoh satellite. Deconvolution is performed in order to remove the image blurring due to the instrument point spread function and increase numerically the spatial resolution of the images. By applying appropriate pixel subdivision scheme it is possible to increase angular resolution in the restored (deconvolved) images by factor 2¸3 bringing it down below 1 arcsec threshold. We have used ANDRIL algorithm with ''pedestal'' (Sylwester and Sylwester, 1998c) for the massive SXT image processing. We have adopted N = 3 and T = 0.2 values for parameters regulating the damping of the noise within ANDRIL and selected the accelerated convergence scheme in the deconvolution.
The purpose of this paper is to present results of analysis of deconvolved flare images. We concentrate on the evolution of three representative well observed solar flares of relatively simple geometry. The first flare occurred in the active region located near the disc center, the second close to the limb and the third on the limb. The flares selected by us have been described in the literature as ''apparently simple loop'' events thought suitable for comparison with results of theoretical modelling. This paper presents the first detailed investigation of the morphology of these ''simple'' events stressing the importance of so called emission kernels. We analyze the overall flare evolution although we focus attention on the interpretation of images registered during the rise phase. This is the most dynamic part of evolution and the morphology changes are the most prominent during this phase. In addition during rise phase strong blueshifted components (line asymmetry) is observed in resonance lines of soft X-ray flare spectra as has been reported for some time now. These blueshifts are interpreted as evidence of chromospheric evaporation and have been studied by many authors (Culhane et al. 1992, Doschek et al. 1994, Fludra et al. 1995, Sterling et al. 1996, Harra-Murnion, Akita and Watanabe 1997, Silva et al. 1997).
It is generally thought that the most prominent feature on SXT flare images are the bright knots (kernels) apparently located at the summit of solar flare loops (Acton et al. 1992, Feldman et al. 1994, 1995, Khan et al. 1995, Doschek and Feldman 1996, Jakimiec et al. 1998). These are compact regions containing the hotter portion of the soft X-ray flare. Summit kernels are reported to reveal themselves shortly after the flare onset and persist well into the decay phase, so they are usually well observed.
From the point of view of flare SXT imaging the footpoint regions did not receive a lot of attention. These footpoint areas are bright (dominating) only during a short time at the flare onset and except few cases (Masuda et al. 1994) are not well covered by the observations because of the flare trigger logging scheme used by SXT. However they often have their counterparts seen in hard X-rays. Dedicated paper devoted to analysis of footpoint characteristics of a particular flare event has been published by Harra-Murnion et al. (1997). The microwave and hard X-ray observations of footpoint emission from two solar flares have been analyzed by Kundu et al. (1995).
Up to now all investigations of SXT data by other authors relied on the images with ''standard'' resolution. The size of SXT pixel is 2.45 arcsec which corresponds to ~ 1800 km on the Sun. However the most of physical processes responsible for the heating of solar flares are supposed to act on much smaller length scales. In this respect any method proven to allow for the increase of spatial resolution on the already collected images is worth to be applied. Results may provide better understanding of processes leading to the flare heating.
In the present study we use the deconvolved images for events observed by SXT on Yohkoh. We determine the thermodynamic parameters of individual bright kernels located in footpoint areas and at summit regions and investigate their time variations. The observed compressed signal for regions where the bright kernels are located (as well at the summit as at the footpoint areas) is in the most cases well above 100. As discussed by Sylwester and Sylwester (1999) the results of deconvolution are reliable for these signal levels. For the presentation we selected one event on 11 July 1992 at 15:25 UT.
In the subsequent sections we briefly introduce the methodology of analysis of physical conditions in flare kernels, show the results of the analysis for chosen flare and in conclusions present the most important results.The observations consist of Yohkoh SXT images recorded in the flare mode. When on-board flare flag is issued the SXT automatically determines the flare location (i.e. its brightest area) and records the partial frames (64×64 pixels) centered on the brightest pixel. The exposure times are adjusted automatically in order to use full available dynamic range of the CCD. A typical flare sequence consists of images recorded using several filters transmitting in a wavelength range from 3 Ĺ to 45 Ĺ . The SXT images we use in the present paper have been obtained with Be 119 mm (later on Be119), Al 11.6 mm (thick Al or Al12) and Al 1265 Ĺ (thin Al or Al01). This order is arranged regarding plasma temperature ''sensitivity'' which means that the Be119 filter is sensitive to higher temperature plasma than Al12 and Al01 respectively. We have used the ratio of fluxes measured using Be119 and Al12 filters in order to determine average plasma temperature and emission measure for individual structures. Thin Al filter is very convenient when analyzing comprehensively the morphological structures since its cadence is usually the highest. More details concerning the SXT instrument can be found in the paper by Tsuneta et al. (1991).
In order to study the variations of physical characteristics of flaring plasma the fluxes determined from deconvolved Al12 images have been interpolated for the times when Be119 images have been recorded. Deconvolved images have been carefully coaligned using standard image processing routines of Yohkoh software package, incorporating the satellite pointing information. Additional pointing corrections (APC) as described by Siarkowski et al. (1996) have been furthermore applied in order to coalign images to within the fraction of arcsec. In this way we have coaligned precisely all the images relative to the initial Be119 flare frame. This allows to study in detail changes of flare morphology and physical characteristics of its fine structures.
Coaligned sequences of deconvolved images have been analyzed as follows.
While determining physical properties of plasma we fix the position of the contour surrounding the kernel at some time (usually at the initial flare frame or at the time when the kernel reaches maximum brightness). We follow time variations of plasma characteristics at this fixed location.
The temperature values are derived with less assumptions than corresponding densities (no guess on the source geometry or value of filling factor is needed to determine the plasma temperature).
We have chosen this flare for the presentation as it is an example of purportedly simple, well observed event which occurred in the active region located near the center of solar disc. As seen on unprocessed SXT images single loop-like structure is visible in projection.
In Fig. 1 time profiles of the BATSE low energy channel ( »25 ¸50 keV), Yohkoh Hard X-ray Telescope (HXT) L channel (»14¸23 keV), GOES 7 ( »0.5¸4 Ĺ ) and FOV integrated Yohkoh SXT Be and Al intensities are presented for this flare. Short discussion of this event has been given in the papers by Doschek, Strong and Tsuneta (1995), Khan et al. (1996) and Sylwester and Sylwester (1997a, b). The flare took place in the evolved active region NOAA 7220 (S11 E03) around 15:25 UT. It was rather extended event as seen in X-rays but not very intense (C5.3 importance in GOES classification). On the SXT images presented by Doschek, Strong and Tsuneta (1995) and Khan et al. (1996) the flare appears as consisting of a single dominant bright loop oriented East-West. There are two bright footpoint areas and the brightening at the summit as seen on the initial SXT image recorded only slightly (few minutes) after the flare onset. During the flare evolution the fainter loop, situated somewhat to the south and roughly parallel to the main one becomes visible. At the flare onset an intense blueshifted component has been observed in the BCS spectra. Khan et al. (1996) noticed that the main loop shifts its position but it was difficult to distinguish whether this shift is related to the motion of a flux tube or to the consecutive activation of new loop system.
The footpoint structure of this flare for
selected moment during the rise phase has been presented in the
paper by Sylwester and Sylwester (1997a). Deconvolved
 figcol1.ps(20k)
Figure 1:
Time profiles of the BATSE low energy channel ( »25¸50 keV,
solid line), Yohkoh Hard X-ray Telescope (HXT) L
channel
(»14¸23 keV,
ragged line), GOES 7 ( »0.5¸4 Ĺ , dotted) and total SXT Be119
(pluses) and Al12 (circles) intensities for the flare on 11 July
1992.
All the fluxes are normalized to their own maxima.
averaged images of this flare as observed with thin Al filter
have been presented in the paper by Sylwester and Sylwester
(1997b). Here we focus on the analysis of fine structures seen on
individual deconvolved images and on evolution of their
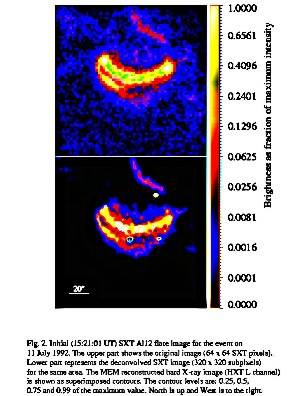
brightness pattern. In Fig. 2 we compare the flare soft X-ray
morphology as seen before and after deconvolution using ANDRIL
algorithm for the initial Al12 flare image.
Comparison of the images (before and after
deconvolution) indicates that individual fine structures not
resolved on the original SXT image can be easy identified on
deconvolved one. In particular brightest parts within footpoint
areas are seen as double structures after the deconvolution (see
the pairs of small kernels in the western/right and eastern/left
foot of the main loop). These compact emissions separated
respectively by about 5500 km and 3500 km constitute
most probably footpoints of tiny loops. The fainter elongated
parallel loop is seen south to the main loop at the distance of
about 9000 km. The weak and diffuse structure north to the
main loop is seen as very thin and well-defined after
deconvolution. The contours of hard X-ray emission for HXT L
channel ( »14¸23 keV)
are superposed on the deconvolved image. They have been
reconstructed using the maximum entropy method (MEM) from Yohkoh
data analysis library. The flux used for hard X-ray image
reconstruction has been collected between 15:20:40 UT and
15:25:09 UT i.e. throughout the main peak of L channel light
curve. It is seen that hard X-ray sources constitute distinctive
features. Most of them are located close to but not exactly at
the summit of the soft X-ray coronal structure. The faint source
can be
 figcol2.ps(39k)
 Figure 2:
Initial (15:21:01 UT) SXT Al12 flare image for the event on
11 July 1992 presented in grey scale. The upper part
shows the original image (64×64 SXT pixels). Lower part
represents the deconvolved SXT image (320×320 subpixels) for the
same area. In order to increase visibility of faint structures
both images have been compressed. The MEM reconstructed hard
X-ray image (HXT L channel) is shown as superimposed
contours. The contour levels are: 0.25, 0.5, 0.75 and 0.99 of the
maximum value. North is up and West is to the right.
seen near by the left footpoint of soft X-ray loop. Also the
small but relatively intense hard X-ray source is located north
to the main soft X-ray loop in the vicinity of thin structure of
enhance soft X-ray emission. This thin structure matches the
neutral (magnetic division) line shape as has been shown in the
paper by Sylwester and Sylwester (1997b). In the forthcoming
paper we will investigate the spatial and temporal relations
between the hard and soft X-ray radiation in more detail for a
number of individual events. Such a comparison is important for
clarifying whether the same particle populations are engaged in
contributing to both soft and hard emissions and further on for
determining the magnetic connectivity pattern.
 figcol3.ps(186k)
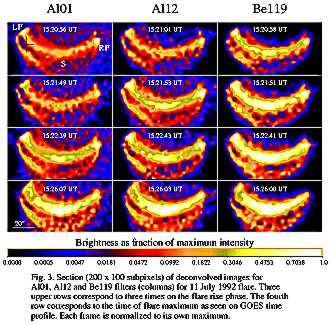
Figure 3: Section (200×100 subpixels) of deconvolved images for Al01, Al12 and Be119 filters (columns) for 11 July 1992 flare. Three upper rows correspond to three times on the flare rise phase. The fourth row corresponds to the time of flare maximum as seen on GOES time profile.
In Fig. 3 the parts (98×49 arcsec) of deconvolved images containing the main flare structure are presented for Al01, Al12 and Be119 filters. In order to bring up fainter structures the images are presented as negatives. The four rows correspond to three different times on the flare rise phase and the time of the maximum on GOES light curve respectively. It is seen that during the rise phase the emission localized at footpoint areas (LF and RF) is the most prominent whereas the summit region of the main loop is the brightest during the maximum phase. The main flaring loop (seen as uniform on the original images) is resolved into many localized compact emission centers often arranged as ''pearl chains''. During the maximum phase this main loop is splitted at the eastern footpoint area which is especially well seen on Be119 and Al12 images (see the LF region in Fig. 3). The upper right small kernel (above the RF region on Al01 image) is not initially clearly seen in the Be image however it is evidently distinguished on thin and thick Al images. Therefore we regard it as a real structure. The plasma temperature for this structure as estimated from Be119/Al12 intensity ratio is quite low. The average value of temperature over the initial 15 min of evolution is 6.1 ±1.3 MK. The plasma density in this localized kernel is (9.4 ±2.0)×1010 cm-3, less than the values characteristic for the other kernels.
It is seen in Fig. 3 that during illustrated short time period the most intense emission is concentrated in RF kernel within the western area. In Fig. 4 we present time variations of important characteristics of plasma confined in this kernel. The top panel presents time variations of Al12 and Be119 intensities with the flux of Yohkoh HXT L channel (»14¸23 keV) superposed. HXT flux has been integrated over the entire Sun. The plasma temperature is initially not very high (»6.5 MK). The mean temperature over 10 min of evolution when the X-ray flux in the kernel is significant has been estimated to be T=7.4±1.6 MK. The behaviour of temperature does not match HXT light curve. The volume of RF kernel has been estimated to be 3×1024 cm-3. At the bottom time variations of the density for RF kernel are presented. The plasma appears to be already dense at the start of flaring sequence (2×1011 cm-3) and the density decreases by factor of ~ 2.5 during initial 10 min of evolution. By comparing the soft (SXT) and hard (HXT) light curves for selected kernel one may hope to better understand the physical relationship between the regions where both type of radiation are formed. In the case of the most intense kernel (RF) which parameters are presented in Fig. 4 the soft X-ray radiation peaks before the maximum of integrated HXT flux in the energy band 14¸23 keV. This lack of temporal correspondence is in agreement with location of the soft and hard X-ray sources as seen in Fig. 2 (the harder X-ray emission does not spatially coincide with the position of the brightest soft X-ray kernel RF). However the soft X-ray emission of RF kernel may possibly be related to harder, non-thermal component of X-ray radiation observed by BATSE in the 25¸50 keV band about two minutes before the SXT flare cadence started.
As concerns kernels located at the opposite, eastern footpoint area (e.g. LF region in Fig. 3) time variations of their thermodynamic characteristics are similar to that presented for kernel RF.
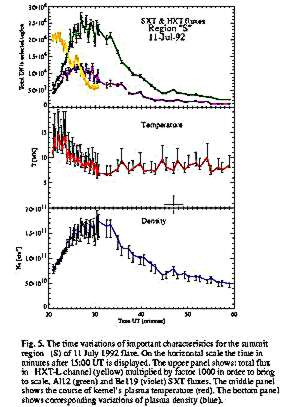
The envisaged loop summit region (S in Fig. 3) becomes the most intense substantially later in comparison with footpoint areas. The variations of derived thermodynamic characteristics for plasma located at this place are shown in Fig. 5. The SXT intensity peak is delayed by about 8 min and 6 min relative to the main intensity peak of BATSE and HXT L flux respectively (cf. Fig. 1). For this summit kernel the maximum of Be flux coincides with the secondary HXT peak which is comprehensible in the context of localization of hard and soft X-ray sources (Fig. 2). However the decay time of HXT light curve is much shorter. The middle and bottom panels of Fig. 5 present corresponding variations of the temperature and density of plasma located at the summit. It is seen that in this case the overall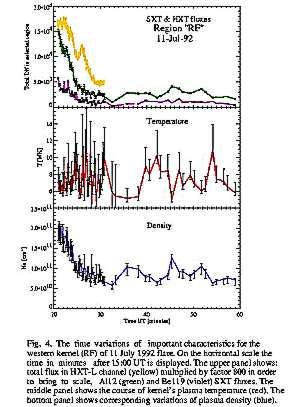 figcol4.ps(20k)
 Figure
4: The time variations of important characteristics for
the western kernel (RF) of 11 July 1992 flare. On the
horizontal scale the time in minutes after 15:00 UT is
displayed. The upper panel shows: total flux in HXT L
channel multiplied by factor 800 in order to bring to scale (top
curve), Al12 (middle curve) and Be119 (bottom curve) SXT fluxes.
The middle panel shows the course of kernel's plasma temperature.
The bottom panel shows corresponding variations of plasma
density.
 figcol5.ps(21k)
In Fig. 6 nine consecutive Be119 deconvolved images (frames separated in time by 8¸9 sec) recorded during the rise phase are shown. The picture presents the enlargement of eastern part of main loop including the LF region. Fast evolutionary changes of the X-ray emission morphology are clearly evident. Initially (15:20:58 UT) the northern sub-kernel is the most intense. After 19 sec (15:21:17 UT) the emission of the coupled sub-kernel becomes dominant. At 15:21:51 UT the intensity of both sub-kernels is nearly equal whereas at 15:22:07 UT the northern kernel again becomes the main source of emission in this part of region. There are intermittent periods when the whole loop like structure is bright. The analysis of similar sequences obtained using other filters supports reliability of the presented pattern of brightness variations. As pointed out in the paper by Sylwester and Sylwester (1998c) the results of deconvolution are reliable for regions where the compressed input signal is above ~ 100. For the regions presented in Fig. 6 the compressed signal has been above 120 in the neighborhood of the bright kernels. In the most cases for regions where the bright kernels are located the compressed signal is well above 100.
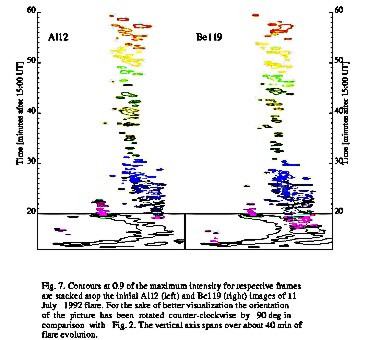
In Fig. 7 we present the sequences of stacked isophotes each drawn at 90% of maximum intensity for respective frames in order to illustrate more clearly the pattern of brightness variations for the entire flaring area. At the bottom standard contours for the initial images for Al12 (left) and Be119 (right) are shown as reference. The vertical axis represents the time elapsed since the start of flare mode observations. It spans over about 40 min of flare evolution. Stacked contours are shown by successively brighter colours as the time progress. Corresponding displacements of loop's maximum brightness locations with time are clearly seen in Be119, Al12 and Al01 (not shown) sequences. To clearly see the dynamic of kernels for analysed flare the reader is referred to the colour animation www.cbk.pan.wroc.pl/publications/1999/flaring/flare920711.avi showing the contour time evolution in every detail. At the same address one can find the colour versions of all figures presented in the present paper (Figcol1 to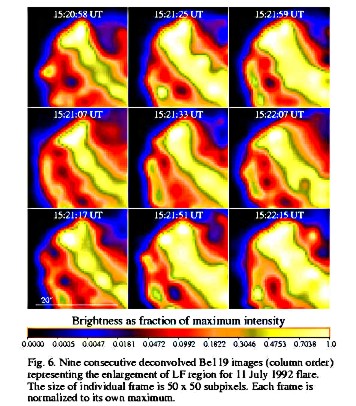 figcol6.ps(21k)
 Figure 6:
Nine consecutive deconvolved Be119 images (column order)
representing the enlargement of LF region of
11 July 1992 flare. The size of individual frame is
50×50 subpixels (24.5 ×24.5 arcsec). Each image is
noralized to its own maximum.
Figcol9). In order to study in detail small displacements of
maximum brightness location in the eastern and western footpoint
areas we selected appropriate parts of deconvolved images. We
traced the changes and for case of Al12 filter and high cadence
mode observations (initial 12 min) we illustrate them in
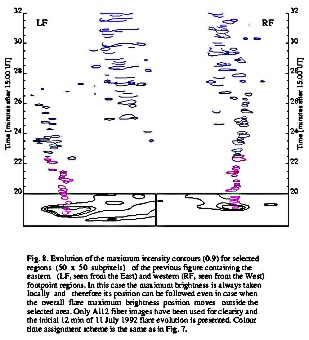
Fig. 8. Again, definite systematic variations of the maximum
brightness position are pronounced for this and the other
filters' sequences.
As is seen in Fig. 8 the position of maximum intensity within the eastern area is fixed for the initial 2 min and then ,,jumps'' to another place. The position of maximum brightness within the western area is stable to within 1 subpixel for short initial period and is homing more or less smoothly to different location later on. It is clear from inspection of Fig. 8 that the variations of maximum brightness position for selected footpoint areas represent definite systematic pattern.
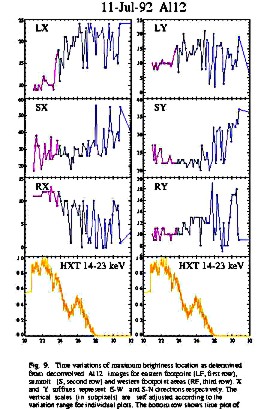
In order to study quantitatively the
displacement of maximum intensity locations
 figcol7.ps(29k)
 figcol8.ps(11k)
 Figure 8:
Evolution of the maximum intensity contours (0.9) for selected
regions (50 x 50 subpixels) of the previous figure containing the
eastern (LF, seen from the East) and western (RF, seen from the
West) footpoint regions. In this case the maximum brightness is
always taken locally and therefore its position can be followed
even in case when the overall flare maximum brightness position
moves outside the selected area. Only Al12 filter images have
been used for clearity and the initial 12 min of flare evolution
is presented.
is better than ±0.5 arcsec. Therefore
we conclude that observed displacements are not illusory. We
interpret them promptly as a result of subsequent activation of
individual energy deposition sites. However the observed
time/spatial variations of maximum brightness locations can be
also related with actual motions of the heated plasma. This
interpretational dichotomy problem will be addressed in the
forthcoming studies.
 figcol9.ps(62k)
Summary
We have presented preliminary results of detailed flaring region study based on the analysis of sequences of deconvolved SXT images for three flares of moderate importance. These flares have been already studied by other authors (Doschek, Strong and Tsuneta (1995), Khan et al. (1996), Masuda et al., (1994), Doschek and Feldman (1996), Tsuneta et al., 1997) but none of them analyzed the flare soft X-ray morphology with such a high resolution as we presently do. For the fist time it has been possible to investigate the soft X-ray flare evolution with the spatial resolution »1 arcsec. The events selected for presentation have been previously described in the literature as ''apparently simple events''. Results of the present study indicate however that none of these events belongs to ''simple loop'' class. We didn't find such ''simple event'' even for the entire set of more than 50 yet analysed flares. We conclude therefore that most probably there are no ''simple loop'' flare events present on the Sun. In addition our analysis revealed that the flaring loops are hardly ever seen as uniform structures during the flare evolution. On the deconvolved SXT images flares are composed of numerous patches of the emission located close to the footpoint regions and at the summit. These are the blobs (knots) of plasma which we refer to as kernels.
The footpoint kernels as seen in soft X-rays are observed mostly during the rise and maximum phase and they usually fade away during the decay phase. They constitute well localized, small sources with the characteristic size of »1.5 arcsec (as obtained from FWHM of cross sectional profile). The analysis of their thermodynamic properties shows that during the phase of significant soft X-ray emission they are composed of dense (maximum density »1¸5 ×1011 cm-3) but not especially hot (T»6 ¸9 MK) plasma.
Somewhat hotter kernels (than the footpoint ones) are those located at the flaring loop summit. Their temperature is usually »10¸15 MK during the rise phase and falls below 10 MK during the maximum and decay phase of the event. Their emission measures (Ne2×V) are commonly larger than for footpoint kernels but the difference in the densities is not remarkable. The characteristic sizes of summit kernels are larger than for the footpoint ones being typically »1.5¸2.5 arcsec. The summit kernels are generally observed during the entire event evolution.
Presence of tiny well localized sources within what is apparently a loop structure has been already pointed out and discussed by Feldman et al. (1994) based on the Yohkoh data for 38 impulsive solar flares. However only now with the improved resolution capability of the deconvolved SXT images it was possible to identify the finest morphological structures unambiguously, the first time for the footpoint areas. It is noticeable especially well for the initial flare sequence images recorded during the rise phase when the image collecting time is sufficiently long. We have found the morphology of footpoint areas much more complicated than was previously thought. The detailed investigation of sequences of images showing the double structure of footpoint regions led us to postulate a new model (Sylwester and Sylwester, 1997a, 1998b) of hierarchical organization of the coronal loop systems. In this model the roots of larger loops are being anchored at the summit kernels of lower lying structures. Hierarchical model will be a subject of comprehensive verification in the future as, if appropriate, it will change conventional picture regarding magnetic ''connectivity pattern'' in the corona.
The observed differences of physical conditions for footpoint and summit kernels and their characteristic time variation patterns (see also Sylwester and Sylwester, 1998d) can be beneficial for discriminating their category for disc flares. With the additional use of high resolution magnetograms this may allow for better reconstruction of the magnetic field organisation above the photosphere.
We have found that the brightest fine structures observed on deconvolved images change their position during flare evolution. For the analyzed flares both footpoint and summit located kernels displace considerably as the event progress. We attribute the observed variations of maximum brightness location to a complex, time and spatial dependent pattern of subsequent energy releases taking place in a net of magnetically linked turbulent kernels. The instant position and brightness of these active kernels are connected with ongoing process of overall reconfiguration of the coronal magnetic fields. In the forthcoming papers we will study in more detail the relation between observed brightness and displacement of kernels with the X-ray line Doppler shifts as determined from Yohkoh Bent Crystal Spectrometer spectra.
The deconvolved images allow for the first time for detailed investigations of spatial relationship between the soft and hard X-ray emission centers. Results of present analysis indicate that they do not exactly overlap. Their relative arrangement indicates however for existence of definite physical associations. The hard X-ray sources are usually placed above the corresponding maxima of softer emission both for the summit and footpoint regions. Detailed comparison needs further investigations.
Based on the discussed examples it is sure that application of deconvolution algorithm (like ANDRIL) into the analysis of SXT images provides a powerful tool for detailed studies of flare morphology and physical conditions in the soft X- ray structures down to 1 arcsec resolution. This opens new perspectives for refined analysis of more than two million SXT solar images recorded by now.
Acknowledgments. This work has been supported by Polish
KBN grant 2.P03D.006.10. We have presented the data obtained
through the CGRO BATSE Solar Flare Data Archive
maintained by the Solar Data Analysis Center at NASA-Goddard
Space Flight Center and provided by the BATSE team
headed by Dr. G. Fishman. The Yohkoh data we
used have been gathered from YDAC Data Center at MSSL coordinated
by Dr. R.D. Bentley. We would like to thank
A. Kepa for her help in preparing animations accompanying
present publication.
BACK
Page created by Jaroslaw Bakala (
jb@cbk.pan.wroc.pl)
Web Curator:Janusz Sylwester (
js@cbk.pan.wroc.pl)
File translated from TEX by TTH, version 1.57.