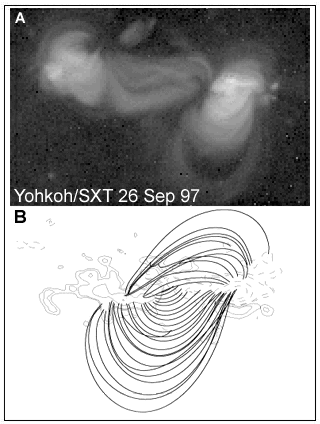
Exploring the X-ray and Ha observations of the C7.2 class solar flare in NOAA 8088 on 25 September 1997 we have previously build a self-consistent 3D model of its evolution and configuration of the magnetic fields. At present we describe results of the comprehensive 3-D numerical modelling of the magnetic fields of the same active region. Taking into account all limitations of the numerical modelling, we found two possible, different scenarios of the evolution and interactions of the magnetic fields during the flare. We found that selection of the genuine numerical model of the flare was possible only using results of the analysis of the broad set of the various observational data. A problem of evaluation of the true model of the event could be considered as very common.
Using X-ray data taken with INTERBALL-Tail satellite we
extended also our previous analysis of the relation between hard
X-ray and microwave emission during the flash phase of the flare
as well as temperatures during the early phase of the flare. We
find that registrated pulses of hard X-ray and 3 GHz microwave
fluxes show tendency to quasi-periodical repetition. Assuming
thermal emission we calculated the effective electron temperature
with one second time resolution. The obtained values indicates
that group of pre-maximum peaks of the flare may be connected to
non-thermal heating phase (lasting approximately 2-3 minutes)
followed by thermal emission phase with temperatures decreasing
from 45 to 25 MK during next 8 to 10 minutes.
Key words: chromosphere; corona; flares; magnetic fields; X-ray.
Various interactions and conversions of the magnetic fields are commonly accepted as a main cause of the active regions' evolution, particularly of the solar flares' releases. Despite many years of the observational and theoretical investigations, many basic problems of the physics of the solar flares are still not fully solved. Even seemingly easy evaluation of the real 3-D topology of the interacting magnetic fields in a solar flare may be solved for a selected and perhaps simplest cases only. The 3-D structure and evolution of the magnetic fields can be investigated by an analysis of the 2-D images of various magnetic structures filled by emitting plasma or/and by a numerical modelling of the topology of the magnetic fields, based on the extrapolation of the photospheric magnetic fields.
The diverse topologies and physics of the really interacting magnetic loops in the solar flare may be described using three basic configurations only: X, Y or I (Sakai and de Jager, 1996). Exploring the X-ray and Ha observations of the C7.2 class solar flare in NOAA 8088 active region on 25 September 1997 we have previously build a self-consistent 3-D model (so-called Model 0) of the configuration and temporal evolution of its magnetic fields (Falewicz and Rudawy, 1999; Paper I). On the strength of analysed data we found that this flare was caused by two successive X-type interactions of the magnetic loops.
In the present work we compare our “Model 0” with the results of the extended 3-D numerical modelling of the magnetic fields of the same region. Such a comparison should allow one to estimate a conformity level of the two methods of the investigation of the active regions’ and flares’ magnetic fields' topology and evolution. Using X-ray data taken with INTERBALL-Tail satellite we extended also our previous analysis of the relation between hard X-ray and microwave emission during the flash phase of the flare as well as temperatures during the early phase of the flare. Also we analysed the effective electron temperature with one second time resolution during the early phase of the flare. We also improved an estimation of the cooling time of the emission kernel observed in soft X-rays by SXT.
We have made a crompehensive numerical model of the 3-D
structure of the magnetic field of NOAA 8088 active region (AR)
on 25 September, 1997.
The computation was done using as boundary
condition the line of sight component of the photospheric field,
as observed by SOHO/MDI around one hour after the flare. The
observed field was extrapolated to the corona using the discrete
fast Fourier transform method under the linear force-free
hypothesis
(Ñ×B = aB), as proposed by Alissandrakis
(1981). As the studied AR was located at S28 E03, away from the
solar-disk centre, we have used a transformation of coordinates
from the observed frame to the local one. This technique has been
discussed by Démoulin (1996). The value of the free parameter of
the model, mainly a which measures the
degree of shear of the configuration, has been varied from 0
(potential configuration) and up to 0.02 Mm-1 in order
to fit the computed field lines to the loops observed by SOHO/EIT
in 171 A, 195 A, 284 A lines, as well as by Yohkoh/SXT.

Despite the global structure of the field of AR 8088 was best represented by a = 0.01 Mm-1 (see Fig. 1), we have found that sets of loops observed by different instruments could be fitted with different values of a, in such a way that the magnetic shear seems to decrease with height (see also Schmieder, 1996). Thus, we can suppose that there could be numerous low-lying chromospheric threads with a highly non-potential field in the analysed region.
We have also computed the location of quasi-separatrix layers (QSLs) (Démoulin, 1997) in the magnetic configuration of AR 8088. QSLs are thin volumes where there is a drastic change in the mapping of field lines from one boundary to another of a given magnetic volume. It has been demonstrated, both from a theoretical (Priest and Démoulin, 1995) and observational (Mandrini et al., 1997; Démoulin, 1997) point of view, that these topological structures are the likely places where magnetic field reconnection can occur. Figure 2 shows the intersection of QSLs with the photospheric plane, it can be seen that the locations and shapes of the computed structures in general agrees well with those of the brightenings observed before the flare, and also with the a flare kernels (see Paper I). This agreement let us suppose that these brightenings were the result of the release of magnetic free energy, due to magnetic reconnection going on at QSLs, which was then transported (at least partially) along the magnetic loops towards the chromosphere.
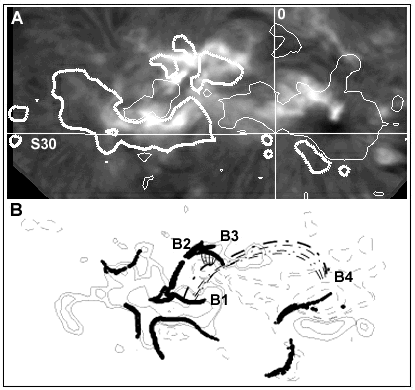
The main aim of our numerical model of the magnetic 3-D configuration of AR 8088 was to evaluate which is the most probable scenario for the occurrence of the observed flare. After careful study of our numerical results and confrontation with observations, we have found two possible scenarios for the analysed event.
Two sets of modelled loops were involved in the flare (see Fig. 3, panel A). The first set of longer loops had footpoints close to brightenings B3 and B4, while the second one of shorter loops had their footpoints close to brightenings B1 and B2. Due to changes in the photospheric field, of which the observed manifestation could be the subsequent eruption of a system of a threads described in Paper I, the first set of loops was forced to interact via magnetic reconnection with the second one.
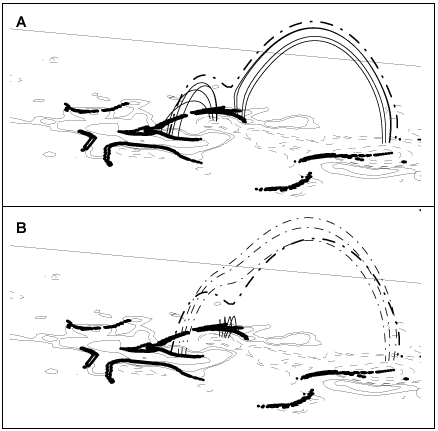
After reconnection, two new systems of loops appeared: the long loops connecting brightenings B1 and B4 and the much shorter loops connecting brightenings B2 and B3 (see Fig. 3, panel B). The described process occurred at coronal heights in two consecutive episodes (see Paper I), which generated two independent observed soft X-ray sources. We speculate that interaction of the first described system of loops might have happened at an X-type neutral (or quasi-neutral) point, as suggested by the shape of the modelled field lines (see Fig. 3, panels A and B), and that the observed X-ray sources were spatially associated to it. The global magnetic topology of AR 8088 was the one corresponding to a classical quadrupolar magnetic configuration (see eg. Gaizauskas, 1998; Démoulin 1997 and references therein). The energy released during the reconnection process flows along the reconnected loops towards the chromosphere, causing the emission at the location of a flare kernels and in the plasma inside these loops.
In the frame of this scenario (so-called Model 1), the higher and longer reconnected loops (see Fig. 3, panel B) joining brightenings B1 and B4, could be interpreted as to correspond to the HL1 and HL2 loops described in the phenomenological model presented in Paper I (so-called Model 0) (see Fig. 4). These loops, together with the much lower and shorter loops (also shown in Fig. 3) having footpoints at the locations of brightenings B2 and B3, were ``generated'' during the flare. In this scenario the long loop LL, observed by SXT and well described in Model 0 as a unique structure, cannot be modelled. In this case, we think that LL (mainly its central and western portion) could be formed by a combination of the shorter loops (the two sets of reconnecting loops described before) having footpoints close to brigthenings B1 - B2 and B3 - B4, respectively.
Part of the magnetic structures observed in the flare connot be represented by computed magnetic field lines, so we propose second scenario which correspond to the phenomenological model presented in Paper I (Model 0). The main reason why we have failed to model some of the observed structures can be due to the limitations of the linear force-free approach. According to our previous discussion about the variation of a with height, we can assume that the non-modelled structures are highly non-potential.
Before the flare a high and long system of loops stretched between the locations of brightenings B1 and B4 in the AR. This system would correspond to the HL loops described in Model 0, and are well represented by the long field lines in Figure 3 (panel B). We suppose in this case that the loops existed before the flare and could have been ``formed'' by a much slower and less energetic reconnection process in which shorter loops, similar to the ones shown in Figure 3 (panel A), were involved. The evidence of this less impulsive energy release process was the observation of Ha plage nucleii located, before the flare, at the same place where we have later observed the flare kernels.
Yohkoh/SXT observed another long and continuous loop after the flare, this would correspond to the LL loop described in Model 0. The central portion of this loop was nearly perpendicular to the HL loops. We assume that this structure was also present before the flare, being highly non-potential, and, therefore, not represented by our magnetic field model.
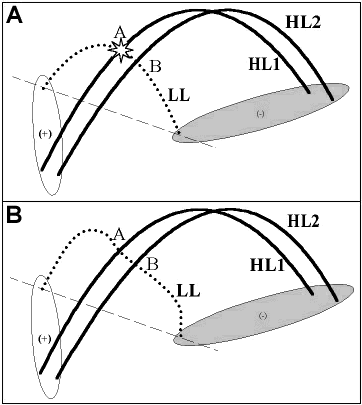
Figure 4: A scheme of the "Model 0" of the flare on 25 September 1997 (see main text). Panel A: X-type interaction of the HL1 loop with the expanding LL loop. Panel B: The configuartion of the loops after the flare.
Changes in the photospheric magnetic field could have forced its destabilization and expansion. The interaction of this loop with the higher lying ones was the origin of the first X-type interaction (see Paper I) (Sakai and de Jager, 1991). On the other hand, the same kind of photospheric variations could have caused the observed eruption of the a system of threads (see Paper I). This eruption could have ``pushed'' the loop from below and forced the second X-type interaction as described in Paper I.According to Paper I, only a small fraction of the magnetic energy contained in the structures was released during the interactions, this energy flowed along the loops towards the chromosphere causing the emission in the a flare kernels (mainly B1 and B4) and heating the plasma inside the loops. In this case, the loops survived the interactions without any significant global change. As mentioned before, in the frame of this scenario (so-called Model 2), the long system of loops stretching between the location of flare kernels B1 and B4 correspond to HL1 and HL2 loops (Model 0) but, in contradiction with Model 1, they were present in the AR long before the flare.
After making a comprehensive numerical model of the magnetic field of AR 8088 on September 25, 1997, we have found two possible scenarios that can explain the evolution of the flare and associated observed phenomena. The first scenario (Model 1) is the direct consequence of the magnetic field model of AR 8088; while the second scenario would explain the phenomenological model (Model 0) presented in Paper I, which was built on the basis of the analysis of a broad set of X-ray, ultraviolet and visible observations.
The main differences between both proposed scenarios (Model 1 and Model 2) when confronted with observations are as follows: 1) In Model 1 we are forced to assume that LL loop, visible as a continuous structure in SXT images, is a combination of two sets of shorter loops having footpoints close to the locations of Ha flare kernels (B1, B2, B3 and B4), these are represented by the field lines shown in panel A of Figure 3. In Model 2, the LL loop cannot be modelled with our linear force-free approach, only HL1 and HL2 can be represented by the field lines shown in panel B of Figure 3. In this later case we find no correspondence between flare kernels B2 and B3 with the footpoints of the loops involved in the interaction, only kernels B1 and B4 appeared to lie at the base of the reconnected field lines. 2) In Model 1 the energy is released at an X-type neutral (or quasi-neutral) point, being the global magnetic topology of AR 8088 that of a classical quadrupolar region. In Model 2 the energy is released in two X-type interactions occurring between nearly perpendicular magnetic loops. It is clear that the selection of the realistic scenario to explain the observed flare would require additional observational data with higher spatial and temporal resolution. A problem of evaluation of the true model of the event could be considered as very common during the investigations of the solar flares.
In Paper I we briefly described the correlation between hard X-ray and 3 GHz microwave fluxes, registrated with the BATSE instrument on board of the GRO satellite and with the RT3 radiotelescope of the Ondrejov Astronomical Institute during the flash phase of the analysed solar flare. The increase and oscillations of the 3 GHz microwave flux have been observed between 11:43 UT and 11:49 UT. The BATSE instrument registrated the hard X-ray flux of the range of 25-50 keV between 11:44:40 UT and 11:46:40 UT. At that moment the detector was switched off for some technical reasons (about 2 minutes before the drop of the radio flux to the level observed before the flare). For this reason we decided to compare the time variations of the 3 GHz microwave and hard X-ray fluxes, using data collected with RF15-I instrument on board of the INTERBALL-Tail satellite as well as to use the same data to evaluate temperatures during the early phase of the flare.
RF15-I Soft and Hard X-ray Photometer (Sylwester et al., 1999) has been developed jointly by the Czech Astronomical Institute and the Space Research Centre of Polish Academy of Sciences. It is placed aboard the INTERBALL-Tail spacecraft lunched on 3 August 1995 and it is operating continuously up to now. The photometer performs observations of whole disk solar flux in the energy range 2-240 keV in three soft X-ray and five hard X-ray energy channels.
The flare is distinguished in all soft and two hard (10-15 and 15-30 keV) energy channels. No emission was observed above 30 keV. At soft energy channels emission start at 11:43 UT, peaked at 11:49 UT and ended after 12:20 UT. In higher energy channels (H1: 10-15 and H2: 15-30 keV) emission peaked approximately at 11:47 UT (see Fig. ). In channel H2 emission appears from 11:44 to 12:01 UT. In H1 channel two bumps of emission are clearly visible at 11:59 and at 12:05 UT respectively. The first one is also present at H2 emission. There are also a group of peaks (spikes) before maximum at both these channels.
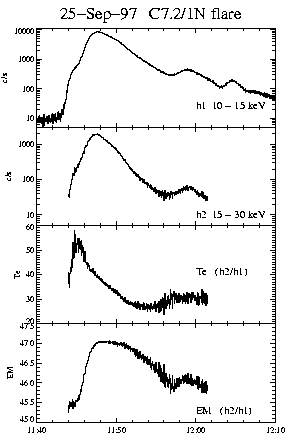
For comparison time dependence of H1 and H2 fluxes and for calculation temperatures from ratio of the fluxes we have rebinned H2 and interpolated H1 data to common time resolution of 1 second. Using transmission and response function of the scintillation detector and assuming thermal X-ray emission we can calculate formally the effective electron temperature from the ratio of the fluxes measured in two energy bands, even for hard X-ray channels. Fig. 6 shows time variations of temperature obtained from the ratio of H2/H1 with one second time resolution. The obtained values indicates that group of pre-maximum peaks may be connected to non-thermal heating phase (lasting approximately 2-3 minutes) followed by thermal emission phase with temperatures decreasing from 45 to 25 MK during next 8 to 10 minutes.
We have compared data taken with the H1 and H2 detectors of the RF15-I instrument and data taken with the RT3 radiotelescope. Raw observational data, taken with all the instruments, have been smoothed using boxcar average filter of the width of 5 seconds. General trends of the signals were also removed to expose short period variations of the observed fluxes (see Fig. 6).
The temporal variations of the fluxes registrated be the H1 and H2 detectors are very similar but not identical. Both the signals show several local maxims well correlated in time. The correlation of the temporal variations of these signal is equal to C12=0.81. It means that very probably both the emissions were actuated by the same physical process, but the localisation and temperatures of the both sources could be different.
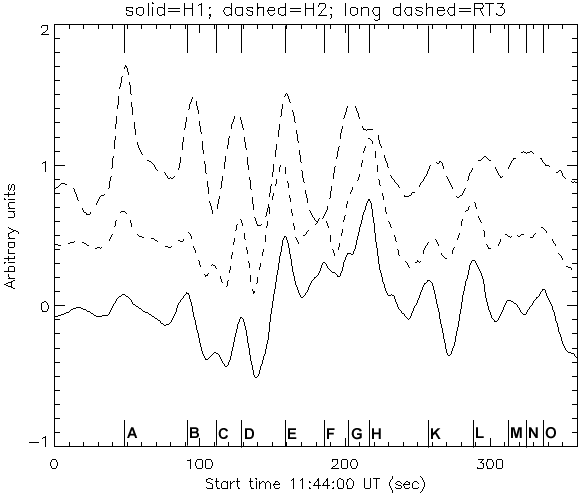
The temporal correlation of the signals registrated with the H1 detector and RT3 radiotelescope is equal to C13=0.38 while the correlation between signals registered with H2 and RT3 is equal to C23=0.43. The temporal correlation of the both X-ray fluxes with the microwave flux are much weaker than correlation between the both X-ray fluxes but the general temporal changes of these three signals are similar. The 10 main maxims of the X-ray fluxes, arbitrary selected by us (marked A, B, D, E, H, K, L, O) are separated by around 44, 36, 33, 59 (27 plus 32, taking into account the local maximum marked F), 44, 28 and 57 (31 plus 26, taking into account the local maximum M) seconds. The microwave signal reveal 8 main maxims (marked A, B, D, E, G, K, L, N) separated by 44, 36, 33, 46, 57, 35 and 35 seconds. Periodograms of the all three fluxes shows that the changes are quasi-periodical. The statistically most significant period of X-ray oscillations is close to 30 seconds.
The temporal correlation of the changes of the both X-ray fluxes is very high during all the period of observations and the local maxims of the both fluxes appeared at almost the same moments. The overall changes of the microwave flux are also very similar to the changes of the X-ray fluxes but same maxims of the X-ray signal have not a counterpart in microwave signal (marked C, F). What is interesting, one strong local maximum of the microwaves appears during very small increase of the X-ray flux (marked G).
The temporal variations of the analysed microwave and X-ray fluxes are consistent with the hypothesis that the energy of the analysed solar flare was produced in turbulent kernel. The quasi-periodical changes of the signals could be caused by series of the reconnections in many transient current sheets (Jakimiec et al., 1998). The observed time intervals between the local maxims were identical with relaxation times of the individual current sheets. The differences of the length of the intervals were caused by differences in local physical conditions. What is more, the slight differences of the temporal variations of the H1 and H2 X-ray fluxes may be caused by the size and non-uniformity of the source.
The 3-D structure and evolution of the magnetic fields in the solar flare can be investigated by an analysis of the 2-D images of various magnetic structures filled by emitting plasma and by a numerical modelling of the topology of the magnetic fields, based on the extrapolation of the photospheric fields.
Numerical modelling of the magnetic fields could produced more than one possible but different models of the analysed solar flare. Selection of the realistic (or genuine) model of the flare could be done only using various other observational data. A problem of evaluation of the true model of the event should be considered as very important during the investigations of the solar flares. Using hard X-ray and microwave data we find that local pulses of these emissions, observed during the flash phase of the flare show tendency to quasi- periodical repetition. Assuming thermal emission we calculated the effective electron temperature with one second time resolution. The obtained values indicates that group of pre-maximum peaks of the flare may be connected to non-thermal heating phase (lasting approximately 2-3 minutes) followed by thermal emission phase with temperatures decreasing from 45 to 25 MK during next 8 to 10 minutes.
PR has been supported by the grant No. 2 PO3D 005 15 of the Polish Committee of Scientific Research. RF has been supported by the grant No. 2 PO3D 016 14 of the Polish Committee of Scientific Research. MS has been supported by Polish KBN grant 2.P03C.006.13.
File translated from TEX by TTH, version 2.25.
On 09 Nov 1999, 12:44.