This paper addresses quantitatively the problem of influence of statistical uncertainties embedded in the recorded image on uncertainties of the reconstructed image. In the analysis we use iterative maximum likelihood algorithm ANDRIL (described by Sylwester and Sylwester 1998) developed for massive deconvolution of flare images obtained by the Soft X-ray Telescope (SXT) on Yohkoh. We illustrate the ''ill-conditioned'' nature of the image reconstruction problem and suggest ways to reduce, at least partly, propagation of noise to the reconstructed image.
Key words: Sun: X-rays - Techniques: image processing, noise propagationIn the preceding paper (Sylwester and Sylwester 1998, Paper I) we have described details of the Accelerated Noise Damped RIchardson-Lucy algorithm (ANDRIL) used for massive deconvolution of flare X-ray images obtained by the Soft X-ray Telescope (SXT). The instrument is operating at present on board the Japanese Yohkoh satellite. Deconvolution is performed in order to remove the image blurring due to the instrument point spread function (PSF) and increase numerically the spatial resolution of the images. The increase of resolution is achieved by allowing for pixel subsampling within the algorithm. It has been noticed in Paper I that using pixel subsampling approach it is possible to increase the angular resolution on the restored (deconvolved) SXT images by factor 2 ¸3 bringing it down below 1 arcsec threshold. In the present paper we discuss how the statistical uncertainties present in the data (the Poisson noise) influence the deconvolved image pattern. We illustrate the problem using test synthetic examples and suggest ways how to lessen the propagation of uncertainties in two scenarios: slowly and fast changing source brightness. In the individual synthetic examples considered, the statistical noise is imposed into the input images. Next, the comparisons are performed between the magnitude of root mean square (rms) input fluctuations and corresponding rms fluctuations in the deconvolved image. Derived conclusions are useful in the interpretation of deconvolved images for all SXT filters, including the most important pair of Al12 and Be119, normally used for determination of thermodynamic characteristics of bright fine structures.
In Paper I our discussion has been focused preferentially on
the formal description of the ANDRIL algorithm and these of its
properties which are important while restoring the data without
the noise (or when the noise was present for the background
signal only). In the present contribution we investigate the
situation when the input image for deconvolution (assumed for
convenience to be of 20 ×20 SXT pixels size) is subject to the
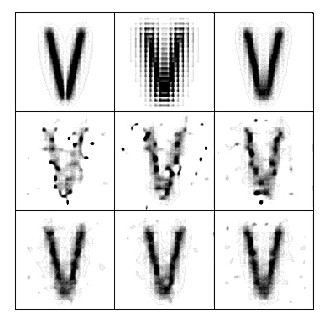
statistical Poisson noise. In Fig. 1 we present example
results of deconvolution in case when the test source has been
selected to be of ,,V'' shape with two symmetric arms. We have
decided to decrease the arms' intensities close to the crossing
point (see the upper leftmost image) in order to avoid problems
with artificial peak present on deconvolved images at the place
where linear structures intersect (see discussion in Paper I). In
the upper row of Fig. 1 the left image represents the
assumed source intensity pattern (the model), the middle is the
image as would be observed by the SXT Be119 filter and the right
is the ANDRIL deconvolved image obtained using subdivision of
each pixel into 5×5 subpixels (if not stated otherwise, this
pattern of subsampling has been generally adopted). The rightmost
image has been calculated assuming the noise to be absent (for
completeness). The middle and bottom rows show the deconvolved
images as obtained for cases when the statistical noise is
embedded individually (independent perturbation patterns) into
the corresponding input image. The maximum ,,observed'' signal (
Omax) has been chosen to be 100 and 1000 (counts) for
cases presented in the middle and bottom rows respectively (these
selections correspond to input signal to noise ratio of S/N » 10 and 30).
It is seen in the Figure that the intensity distribution in
deconvolved images is quite sensitive to the presence of noise.
It is especially pronounced (as expected), in case of low
statistics (low S/N). One may observe that spurious, localized
brightenings arise in the process of deconvolution. This tendency
of the algorithm to develop high contrast well localized sources
is very much preserved notwithstanding that within the ANDRIL
algorithm special ,,damping'' of the noise is forced (as
described in Paper I). It is seen however, that with increasing
of S/N ratio from 10 to 30 (middle and bottom rows respectively)
the quality of restored image improves very much and the restored
pattern becomes closer to the test model.
Development of spurious maxima in the process of deconvolution
is very unpleasant characteristic of ANDRIL indeed. This property
should never be forgotten

Figure 1: Example showing the influence of the Poisson data noise on the results of deconvolution. In the upper row the left image shows the assumed source intensity pattern (model), the middle is the image (i.e. the input for deconvolution) as would be observed by SXT (appropriate Be119 filter PSF function has been adopted) and the right image is the result of deconvolution when the noise is absent. The lower two rows present deconvolved images for cases when the input image is noisy. The three images in each row correspond to three independent sets of random noise pattern.
In cases when the observing cadence of the same field is executed fast relative to time scale of source brightness variations, it seems natural to expect that it would be possible to smooth out the noisy component and come closer to the ,,true'' solution by frame averaging. One may consider two approaches to averaging:
| Omax | 100 | 500 | 1000 | 3000 |
| (10-9) | 50±12 | 6.4±1.4 | 2.3±0.4 | 0.73±0.09 |
| avaraging over: | 1 | 5 | 10 | 20 | 40 |
| q (10-9) | 50 | 9.7 | 6.8 | 3.6 | 2.4 |
C: Averaged and deconvolved, Omax = 100
| avaraging over: | 1 | 5 | 10 | 20 | 40 |
| q (10-9) | 50 | 9.2 | 5.7 | 2.8 | 1.7 |
 |
(1) |

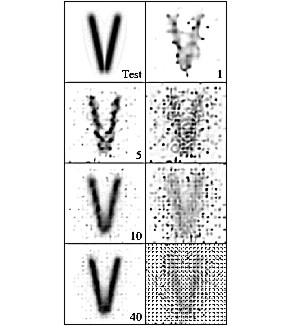
Figure 2: In the upper row the comparison of the test model (left) with a particular deconvolved image obtained from the noisy input with maximum S/N ~ 10 (right) is shown. In the lower rows, the left panel represents the average deconvolved image as obtained from 5, 10 and 40 individual deconvolution runs. The images to the right show corresponding maps of the relative standard deviations. The darker shades correspond to larger relative fluctuations in the deconvolved images due to the noise present. In the bottom right image the input observational pixel grid (dotted) is superposed for the comparison.
where Mi stands for the model test brightness in subpixel ,,i'' and the summation is performed over all subpixels bright enough in the initial model, i.e. those where number of counts are at least one (ni represents the number of such image elements). Distribution `fi represents the average deconvolved intensities in the corresponding pixels. The integral of both Mi and `fi in Eq. (1) are normalized to 1 in order to allow cross-comparison between cases with different maximum intensities. For distributions having the same shape q º 0 and value of q grows as the shapes differ more and more. In the case of deconvolution without noise, this value is q = 3.8×10⁻¹⁰.
In Table 1 the results of image reconstruction are compared for various types of tests described above and in the rest of the paper. From part A of the Table it is seen that the quality of reconstruction improves fast as the intensity in the input image increases. Part B shows to what extent the averaging over a number of deconvolved images improves the quality of reconstruction and in part C we present corresponding results when deconvolution is performed over the averaged input frames .As discussed in Paper I, in order to avoid problems with negative signals after dark current subtraction, we introduced the dark current handling deep into the root of the ANDRIL algorithm. Appropriate correction has been inserted into the expression where the primary correction factors are evaluated (cf. Eq. (12), in Paper I). During the tests of the method, we noticed that by applying appropriate small additive ,,pedestal background'' (B) it is possible to lessen the influence of input noise on the deconvolved pattern of intensities. While applying pedestal we substitute Eq. (12), in Paper I with the following expression:
 |
(2) |

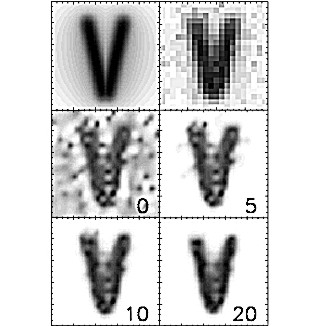
Figure 3: Illustration of the effect of using the various levels of artificial pedestal while performing noisy image deconvolution. Upper left and right patterns represent the test intensity model and typical noisy input image respectively. The maximum level of the input signal Omax has been assumed to be ~ 100 (counts). The patterns below are the results of deconvolutions obtained from the same noisy input image but with increasing pedestal levels adopted (0, 5, 10 and 20 counts respectively).

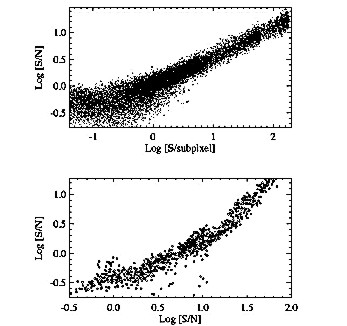
Figure 4: Dependence of the deconvolved S/N on the value of S (upper panel) and on the value of input S/N (lower panel). See the text for details.
Based on numerous runs where the input signal has been a subject to noise we have determined the dependence of S/N (signal to rms noise after deconvolution) on the magnitude of deconvolved signal S. The rms noise N has been determined (for all examples discussed below) based on 40 perturbed runs. In Fig. 4 (upper panel) we present log-log scatter plot of (S/N) vs S containing 3×10⁴ points representing collected results for three separate cases in which the maximum of intensity on the input image has been taken as 100, 1000 and 3000 (counts). It is seen that for deconvolved signal exceeding 1¸2 (counts/subpixel) the Poisson character of the noise (after deconvolution) is preserved (N » Ö{S}).
This derived dependence allows to assign the rms uncertainty in the deconvolved image based entirely on the deconvolved value only i.e. one can assign uncertainty to each deconvolved intensity value. It is also seen from the dependence that below the threshold of few counts per subpixel, the results of deconvolution are rather uncertain.
It is instructive to correlate the (S/N) after deconvolution with the (S/N) characteristic of the data (input image). By appropriate averaging of the (S/N) over corresponding input pixel area (5 ×5 subpixels). The plot is shown in the bottom panel in Fig. 4. The horizontal axis represents in this case the (S/N) as taken from input while the vertical axis represents averaged deconvolved (S/N). The 1200 points plotted represent the same three cases as in the panel above. Except for pixels placed at the edges of the deconvolution field (points lying off the main cloud), a well defined dependence is observed. This dependence indicates that for cases when the input S/N » 30 (1000 counts/pixel) the corresponding value of S/ N after deconvolution is » 7 i.e. by factor 4¸5 less. This large value of ,,noise enhancement factor'' (NEF) is related partly to the ill-conditioned nature of the deconvolution and partly to pixel subsampling. After making appropriate tests we have found that:
This behaviour of NEF illustrates the ill-conditioned nature of deconvolution problem.
The analysis performed indicates that:
Based on the results of present study one may estimate that in order to expect » 20% accuracy in the deconvolved intensity image, one have to use the input data accurate to few percent. For SXT such a high signal accuracy is representative for regions with the compressed signal being above ~ 100 DN (data number, cf. Paper I) threshold. For most real SXT images, due to automatic exposure selection scheme, the brightest areas are usually well above this limit and therefore deconvolution offers new insight into detailed morphology of these bright sources.
Presented results of noise propagation within the ANDRIL algorithm help in better understanding of limits for the physical interpretation of deconvolution. It is possible now to assign uncertainty to each of the intensity values as determined using standard ANDRIL discussed in Paper I.
Image averaging can be used effectively in cases when the cadence of the observations is fast enough in order to assume the source brightness distribution unchanged between exposures. This is unfortunately usually not the case for SXT flare observing sequences. Therefore the ,,background pedestal'' approach has been mostly used for massive SXT deconvolution task with value B of pedestal selected at approximately twice the level of the dark current.
Acknowledgments. We wold like to thank the unknown Referee for valuable comments which helped us to clarify the presentation. This work has been supported by Polish KBN grant 2.P03D.006.10.
Page created by Jaroslaw Bakala (
jb@cbk.pan.wroc.pl)
Web Curator: Janusz Sylwester (
js@cbk.pan.wroc.pl)
File translated from TEX by TTH, version 1.57.