To be published in:
ESA SP-446
by October 1999
TRANSVERSAL AND RADIAL MOTIONS OF FLARING KERNELS FOR 11 AUGUST 1992 EVENT
TRANSVERSAL AND RADIAL MOTIONS OF FLARING KERNELS
FOR 11 AUGUST 1992 EVENT
Space Research Centre, Polish Academy of Sciences,
Kopernika 11, 51-622 Wroclaw, Poland
e-mail: (js,bs)@cbk.pan.wroc.pl
Abstract
We have studied time variations of the maximum brightness location for
pronounced flare emission kernel seen on deconvolved Yohkoh Soft X-ray
Telescope images for 11 August 1992 10:25 UT event. Derived patterns of
maximum brightness displacements as observed on Al01, Al12 and Be119
filter images have been intercompared. In addition, we have incorporated
into the analysis the MEM-reconstructed Hard X-ray Telescope images and
the data from the SXT aspect sensor. The analysis of the data reveals
systematic variation of the brightest source position seen in the
coronal portion of the active region, close to the eastern limb. This
variations can be followed in all considered energy bands. Derived
displacement pattern indicates for presence of striking similarities
and/or differences. We relate the observed transversal kernels' location
with Doppler displacements (radial velocity component) as determined
from analysis of soft X-ray spectra obtained by Yohkoh Bent Crystal
Spectrometer (BCS). Thanks to a new approach, we were able to study line
shifts and widths early in the flare evolution, even before the maximum
of the impulsive hard X-ray phase. We notice presence of relationship
between transversal motion of the brightest kernel (as determined from
SXT images) and the radial displacement (as determined from
time-integrated Doppler Ca XIX w line shifts). This observation
represents unique argument in favour of the dynamic nature of the
observed transversal motion of flaring kernel. We identify the moving
kernel as the source of Ca XIX and SXT emission.
Key words: solar physics; flares; deconvolution; flare kernels dynamic
1 ANALYSIS OF IMAGES
One of the important questions concerning the displacements often seen
for flaring kernels is whether they represent real plasma motions or the
exciter motion. With the aim to answer this question we have studied
evolution of a bright kernel for 11 August 1992 flare seen close to the
limb.Investigated M1.4 flare occurred in active region NOAA 7260.
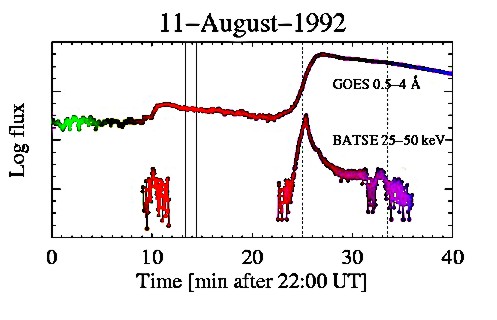 Figure 1: Variations of the X-ray solar flux with time during investigated period as recorded by GOES and BATSE instruments. Thin vertical lines indicate the preflare period for which the summed Al01 image is shown separately. The dotted vertical lines indicate the interval when SXT flare sequence has been executed. The precursor event can be recognized at 22:10 UT.
Preliminary
analysis of this flare has been presented by Sylwester and Sylwester,
(1998b). In Fig 1 we present time variations of X-ray fluxes as
recorded from GOES and BATSE. Small precursor is seen around
22:10 UT followed by the main event 15 min. later. This precursor has
originated at the same location as the following flare. The overall
complexity of the active region during pre-flare period is shown in
Fig. 2. Presented Al01 128 x 128 pixels image represents average
for the interval indicated in Fig. 1. In order to increase the spatial
resolution, the images going to the average have been prior deconvolved
using ANDRIL maximum likelihood package (Sylwester and Sylwester,
1998a, 1999). Spatial resolution in this image is therefore below
1 arcsec. It is seen that the pre-flare structure of the corona was very
complicated with many loop-like structures of various
dimensions and brightness seen. There are a number of compact emission
patches apparently close to the surface which, according to us,
represent unresolved low-lying (arcades of) loops.
We have selected five characteristic intervals in Fig. 3 based on
signatures of time variability and the statistical significance. The
selection made allowed us to reconstruct the HXT images using the
maximum entropy approach (MEM). The intervals chosen relate to: the
impulsive rise phase (a), the maximum of impulsive phase (
b), the plateau (c) as seen in the 14-23 keV (L) band and two
periods during hard X-ray decay (d) and (e).
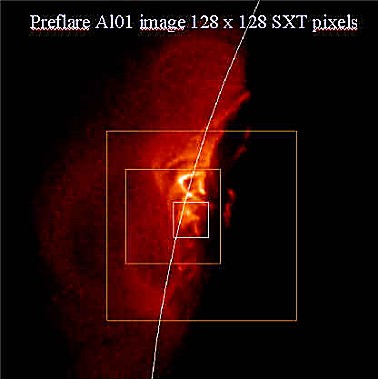
Figure 2: The appearance of AR 7260 before the investigated flare. The outer box inside main FOV denotes the area covered during flare mode sequence (64 x 64 SXT pixels). The middle box represents the area (32 x 32 pixels) where HXT and SXT cross-comparison has been performed. The inner (white) box outlines the area (12 x 12 pixels, i.e. 21 x 21 Mm), where the transversal displacements of the brightest kernel have been investigated in detail. As well the precursor as the main soft X-ray flare has been located in the center of this area.
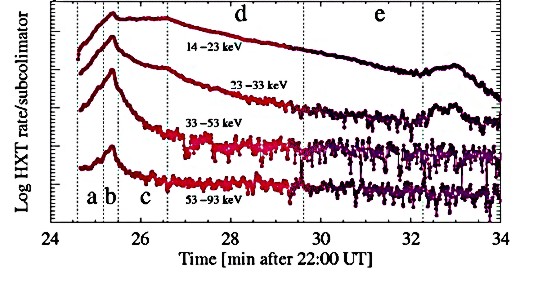 Figure 3: Time variations of hard X-ray flux recorded during indicated period by HXT on Yohkoh. The time intervals bounded by dotted vertical lines have been denoted by letters (a - e). They indicate times over which the fluxes in individual channels have been integrated in order to reconstruct the hard X-ray images presented in Fig. 4.
During rise phase of impulsive burst, several modulations in the light curve can be
traced. They correspond to characteristic variations of the spectral
appearance of this flare as seen in the BCS measurements (see later).
Modulations are also seen on the plateau. We overlaid SXT an HXT images
taken at the same time. In this respect, we used standard SXT_PREP
Yohkoh software. In addition we used the data obtained from the SXT
aspect sensor which represent the CN narrow band (NaBan) optical images.
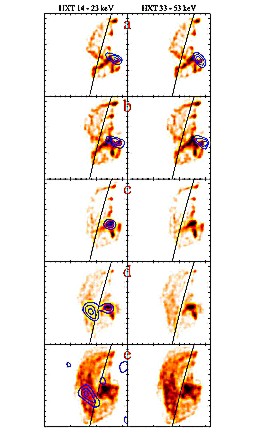
Figure 4: HXT contours (drawn at 0.5, 0.7 and 0.9 of maximum intensity) overlayed atop corresponding SXT Be119 deconvolved images (in gray). The Be119 images have been summed over the time intervals appropriate for the corresponding HXT image. The position of solar eastern limb is drawn. Key codes are as in Fig. 3.
Position of the limb is clearly seen in these images. When processing
NaBan images, we noticed presence of localized emission kernels above
the average. The investigation of this localized components revealed
that their brightness follow time changes of hard X-ray emission -
therefore they are flare related. Position of these CN-bright patches is
shown in Fig. 5.
In Fig. 4 the most intense regions of analysed flare are displayed.
Substantial change of source location is seen. Soft X-ray emission is
confined in separate structures at the flare rise and maximum phase as
seen on the gray images. During the decay (d and e phase)
flaring structure is extended. The position of dominating soft X-ray
source is on disc (in projection) during all the time although it
changes the location.
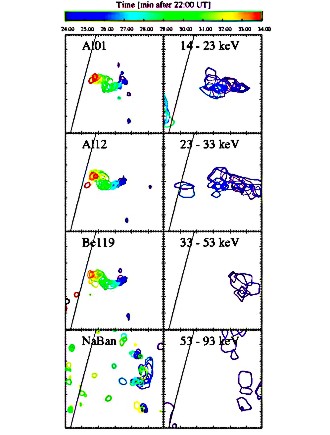
Figure 5:
Time sequence of the contours drawn at 0.9 of the maximum intensity
for consecutive frames of available SXT (Al01, Al12, Be119, NaBan
filter) and HXT (L, M1, M2, H channel) sequences. The size of
individual frame is 12 x 12 pixels i.e 21 Mm x 21 Mm on
the Sun. The rise time contours are drawn black and their shades
become lighter during the decay.
Hard X-ray emission (L channel) during the rise,
maximum and plateau is concentrated in a compact patch close to
brightest soft X-ray source although not cospatial. During decay the
source seen in L channel is more extended and seen above the limb,
apart from the soft counterpart. The harder X-ray emission (right column
of Fig. 4) is also compact during rise and maximum phase. It is much
more extended however during plateau.
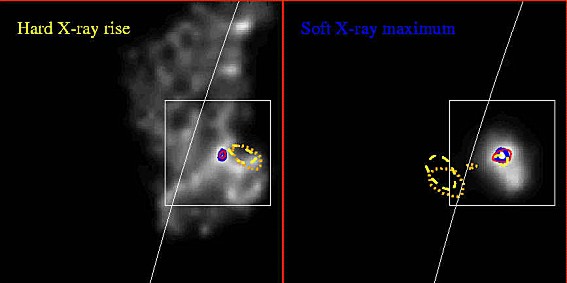
Figure 6: Respective locations of SXT and HXT brightest areas for two phases of the flare. Contours are drawn at 0.8 of maximum intensity. In gray, compressed SXT Al01 deconvolved image is shown as background. The dashed and dotted contours correspond to HXT sources in L and M1 bands. The solid contours correspond to Al12 and Be119 images. The left panel is for the hard X-ray rise phase (a in Fig. 3) and the right panel corresponds to the maximum phase seen on the GOES light curve. The box inside represents the 12 x 12 pixel area shown in Fig. 5.
During decay phase the MEM image reconstruction has been unreliable at this channel (no contours plotted). Displacement of brightest source is best seen on sequences of
SXT deconvolved images presented in Fig. 5. Darker contours in the
Figure correspond to times closer to start of the event. The Figure
covers about 10 min of flare evolution. After few minutes, the position
of maximum in hard X-rays moves away of the area (cf. Fig. 6). The
evolution in hard X-rays is faster than in soft bands and for about 5
min. only corresponding brightest patch is present within the box
displayed. Complementary colour Figure is available at
http://www.cbk.pan.wroc.pl/ publications/1999/transversal.htm.
In Fig. 5 it is seen that the character of displacements is the same for all SXT channels. The hard patch seen in L channel is of similar extension and position. The M1 patch is more elongated and inclined. The M2 patch is rather vertical instead.
Patterns of brightest source locations are compared in Fig. 6 for two
phases of the flare. The comparison indicate that soft and hard X-ray
patches are not cospatial although they are located relatively close
during rise of hard X-ray emission. Five minutes later (at soft X-ray
maximum) the hard X-ray patches are displaced above the limb, far from
the soft X-ray source. However, a secondary small patch seen in L HXT
channel nearly perfectly coincide with location of soft X-ray source at
this time.
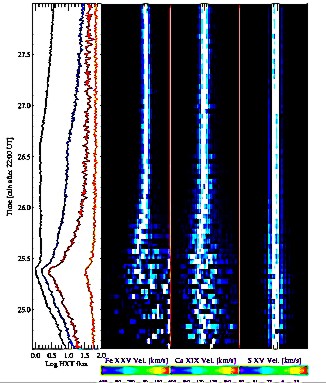
Figure 7: An example of ßpectral images" in which the time evolution of BCS
spectra (three rightmost panels) is compared with the corresponding
light curve of the HXT flux in L, M1, M2 and H channels (left panel).
The horizontal axes in the spectral images represent the wavelength bin
scale in vicinity of the resonance lines of Fe XXV, Ca XIX and S XV ions
(1.850 Å, 3.176 Å and 5.061 Å respectively). Vertical scale
represents time. In gray are presented the normalized line intensities.
The horizontal shifts in the line position may be translated to Doppler
velocities. See respective velocity bars at the bottom.
2 ANALYSIS OF BCS SPECTRA
Bulk and turbulent motions of the hot flaring plasma influence the spectral line position and/or shape. The standard way of analysis of spectra measured by BCS is synthetic spectra fitting. Limitation of such approach is that in order to get the fitting process to converge, the count statistic have to be large. This means, that during rise phase when the line flux just starts to increase, integration time has to be long (tens of seconds) smearing possible time variations. In order to overcome this difficulty we used proxies for line position and line width. The definitions of these proxies are following: line position - location of line centre of gravity (COG) calculated in spectral range containing the resonance line and its shortwavelenght portion of the spectrum; line width - number of spectral bins standing above 1/2 of the maximum signal recorded in selected spectral range. These two proxies can be (formally) calculated for any statistical distributions of the signal within the selected spectral range. They proved to be representative for their parent parameters even for low signal levels, much lower than necessary for spectral fitting.
Calibration of proxies using spectral fitting results will be described in more details elsewhere. Using introduced proxies we have extended the analysis of line average positions and widths well into the flare rise phase. To this end we have used the shortest time scale available i.e. the instrument spectral data gather interval (3 s). One should be aware that using described proxies it is possible to oversimplify the interpretation of actual spectral pattern. For instance the average position of two spectral line component present at the same time has no clear physical sense for the estimate of the Doppler shift. In order to identify such cases, we have constructed the so called spectral images. These images represent the stacked spectral plots, in which each spectrum is normalized to its own maximum, and the line intensity is represented by the shade of gray. Spectral images are shown in time
order from bottom to top. In Fig. 7 combined spectral plots for Fe XXV,
Ca XIX and S XV resonance lines are presented. The time interval
selected covers entire impulsive phase. The continuum contribution to
spectra has been removed. In this respect we used spectral bins far away
form lines. Early in flare, two or more features can be distinguished in
Ca XIX plots, indicating
possibly for presence of separate plasma blobs moving with well-defined
though different velocities. For the period following the hard phase,
line shapes are more regular. In Fig. 8 we present combined diagram
showing time dependence of proxies for Fe XXV, Ca XIX and S XV lines.
Derived variations are similar during the hard phase for both the
position of individual peaks and the effective width. Peaks coincide,
however their relative amplitude differ. Peaks observed for line shifts
tend to coincide with valleys in the line width plots. This may
indicate that proxies inappropriately handle the complexity of velocity
pattern present in the data. Time coincidence of variations points
however towards common physical origin of the changes. Detailed
interpretation of these variations will be given elsewhere. Using
results from the proxy calibration exercise, we assigned absolute ranges
of variation for Doppler shifts and line widths presented in Fig. 8.
Derived values are: 1000, 140 and 40 km/s for velocities and 770, 290
and 240 km/s for non-thermal turbulent line widths (order: Fe XXV,
Ca XIX and S XV).
Derived time variations of the line shift may be integrated over time yielding relative radial displacement. We set integration constant to zero at the start of the flare. Results of the integration we present in Fig. 9.
It is seen that individual radial displacements behave differently. This may be understand if plasma of different temperatures moves independently. The hottest component contributing to the Fe XXV line experience the fastest and most violent dynamical behaviour. Ca XIX and S XV lines vary more gently. Velocity variations are smooth in the post-impulsive phase. In Fig. 10 we present comparison of transversal and radial displacements for this phase. As a measure of radial displacement we took the time-integrated Ca XIX Doppler shifts. A very good correspondence exists between the transversal and radial displacements derived. The correlation is insignificant for S XV and reverse for Fe XXV.
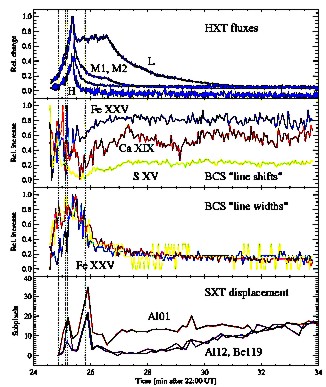
Figure 8:Time evolution of derived "proxy" characteristics (Doppler shift and line width) from Bent Crystal Spectrometer
observations. In the upper panel the light curves of three HXT channels
(L, M1, H) are plotted for the comparison. In the second panel derived
centre of gravity (COG) relative line positions (shifts) are displayed
for the three resonance lines investigated. In the third panel
respective line widths changes are overplotted. In the bottom panel the
transversal displacements of the brightest SXT components are plotted as
seen on Al01, Al12 and Be119 images. The SXT displacements are
calculated as a distance respective to the position of the maximum
brightness within the initial frame. The dotted vertical
lines represent the time of the hard X-ray peak and the time when the L
channel HXT flux decreased e-times.
3 SUMMARY AND CONCLUSIONS
We compared the dynamics of flaring kernels contributing to soft and
hard X-ray images and spectra. It has been possible to trace the
position of the dominating source to within 1 arcsec on deconvolved SXT
images. In order to trace weak line features early in flare, we
specially processed the spectral observations. The line shifts and
widths have been studied with 3 s time resolution. We compared
behaviour of transversal and radial motions. The conclusions are as
follows:
- Transversal displacements of the brightest kernel are seen in all available image sequences (Al01, Al12 and Be119 filters). The displacements are noticeable throughout the entire flare evolution. During the impulsive phase, observed displacements can be assigned to activation/brightening of individual kernels located close to the photosphere. Later on, displacements become more systematic, representing motion of a plasma blob.
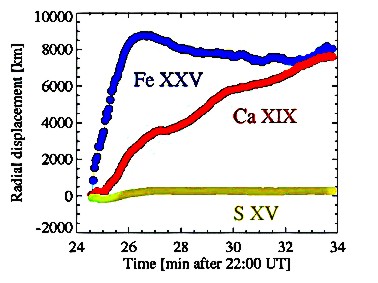
Figure 9: Time integrated Doppler line shifts representing the radial displacements of the plasma source for Fe XXV, Ca XIX and S XV resonance lines respectively. Positive inclination represent motion towards the observer.
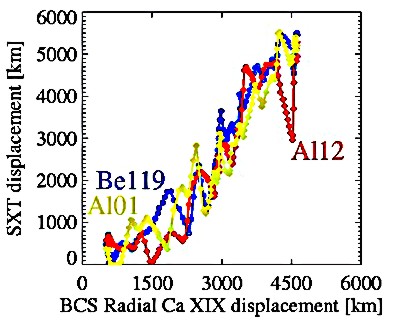
Figure 10: Transversal displacement of the brightest plasma component (as seen on Al01, Al12 and Be119 images) are compared with the radial displacement derived from Ca XIX resonance line. The plot is constructed for the observations starting from 22:27 UT. i.e. the times after the impulsive phase.
- During the post-impulsive phase the motions in all soft X-ray bands are similar. This indicates that the moving plasma blob contributes to all SXT spectral bands in a similar way. Projected average velocity of transversal displacements is 18 km/s.
- Locations of maximum brightness on MEM restored HXT images also show substantial transversal displacements. However these displacements are independent of the soft X-ray motions. The extend and location of "displacement trace" is similar for the soft and HXT L bands. The amplitude of displacement seen in M1 band is significantly larger.
- Soft and hard X-ray sources are cospatial during the plateau (phase c).
- Aspect sensor (CN band) differential images show flare related brightenings. The emission is concentrated in three patches: two stationary and the third (located between them) showing transversal displacements. It is not possible to align emission patches seen in the CN with the soft and/or bright sources. The trace of the CN emission source is elongated perpendicular to the direction of the trace of hard X-ray (M2 channel) source.
- During the rise of impulsive hard X-ray emission peculiar spectral features can be observed, best seen in Fe XXV and Ca XIX spectra. Isolated spectral components can be identified showing strong Doppler shifts. This may indicate presence of a low emission measure, hot (T > 10 MK) kernels undergoing acceleration and moving with different velocity.
- Line widths show systematic pattern of variations. During the rise of impulsive phase widths appear to be anti-correlated with the Doppler line shifts. This effect may be to some extent artificial provided that multiple velocity spectral components are present at the same time. It is hard to distinguish between the line shift and line width in such circumstances.
- Timing of fast changes in line widths and shifts is correlated with subtle changes of hard X-ray light curve. Peaks of harder emission are associated with peaks of the line widths during the rise of impulsive phase.
- Radial displacements are different for each of the three lines investigated. Fe XXV emitting source moves first in the direction towards the observer (during the rise of HXT emission) and outward later on. As observed for Ca XIX and S XV lines, source moves towards the observer all the time. This indicates that plasma components contributing to particular lines are separate.
- Transversal (SXT) and radial motions (Ca XIX) are correlated. This indicates that the same plasma contributes to the radiation in these bands. Observed relationship indicates that derived transversal displacements represent actual plasma motions. If so, we are in a position to derive all components of the full velocity vector for the thermal flaring kernel's plasma. Velocity vector inclination is ~ 45 deg towards the line of sight; |v| = 25 km/s.
Presented results confirm presence of plasma components (blobs) moving with substantial velocity parallel to the solar surface. (Bentley at al., 1986).
The results shown seem hard to be accommodated in many of the proposed theoretical scenarios for flare. The one which may help in explaining the results presented is the turbulent kernel model (Jakimiec at al., 1998). In this model, substantial part of energy release in flare takes place in a bright coronal kernel with a well developed MHD turbulence. In such kernel the magnetic field lines coming from below can be intermixed with these linking to the farther away regions. During flare magnetic links simplify within the kernel volume releasing stressed energy. The energy release takes place well into decay phase due to reconnection within the turbulent region. Coronal kernel moves in the corona (most probably) as a result of unbalanced magnetic forces acting upon it.
ACKNOWLEDGMENTS
This work has been supported by the Grant: Organisation of
Magnetic Fields in the Corona 2.P03D.024.17 of Polish Committee for
Scientific Research.
References
-
Bentley R.D. Lemen, J.R., Culhane J.L. and Phillips, K.J.H., 1986, Astron. Astrophys., 154, 255
-
Jakimiec, J., Tomczak, M., Falewicz, R., Phillips, K.J.H. and Fludra, A., 1998, Astron. Astrophys., 334, 1112
-
Siarkowski, M., Sylwester, J., Jakimiec, J. and Tomczak, M., 1996, Acta Astron., 46, 15
-
Sylwester, J. and Sylwester, B., 1998a, Acta Astron., 48, 519
-
Sylwester, J. and Sylwester, B., 1998b, Proceedings of the Astronomical Society of the Pacific, eds. C.E. Allissandrakis and B. Schmieder, Vol 155, 381
-
Sylwester, J. and Sylwester, B., 1999, Acta Astron., 49, in print
BACK
Page created by Jaroslaw Bakala (
jb@cbk.pan.wroc.pl)
Web Curator:Janusz Sylwester (
js@cbk.pan.wroc.pl)
File translated from TEX by TTH, version 1.57.