Space Research Centre, Polish Academy of Sciences, 51-662 Wroclaw, Kopernika 11, Poland
Mullard Space Science Laboratory,
Department of Space and Climate Physics, University College
London, RH5 6NT Holmbury St. Mary, UK
The analysis of Ca XIX helium-like ion soft X-ray spectra in vicinity of the resonance line at l=3.177 [Å] proved to be very useful in determinations of calcium absolute abundances. This spectral region have been extensively investigated using Bragg Crystal Spectrometers aboard the Solar Maximum Mission (SMM) and Yohkoh spacecraft. The analysis of the line-to-continuum intensity ratios yield however conflicting results as concern the average calcium abundance for flares observed by SMM and Yohkoh spectrometers (Bentley, Sylwester and Lemen, 1997).
In the present research we investigate the influence of
possible uncertainties in the shape of instrumental part of the
spectral line profile on derived Yohkoh abundances. We
conclude that by increasing the width of Lorentzian component of
the instrumental profile it is possible to lessen the mentioned
discrepancy.
Key words: Sun: X-ray; Yohkoh; Bragg Crystal Spectrometer; instrumental profile
The Bragg, soft X-ray crystal spectrometers developed at MSSL
are among the most suitable instruments for detailed study of the
solar flare spectra since they allow to measure instantly the
entire spectral region covered. The convex crystal spectrometer
has been placed aboard the NASA Solar Maximum Mission
(
SMM) satellite and collected thousands of flare spectra
during 1980 and 1984-1989 periods. Similar concave spectrometer
is observing active corona since October 1991 aboard the Japanese
Yohkoh spacecraft and already collected hundreds of
thousands of flare and active region spectra. In the rest of this
paper we shall call the SMM and Yohkoh
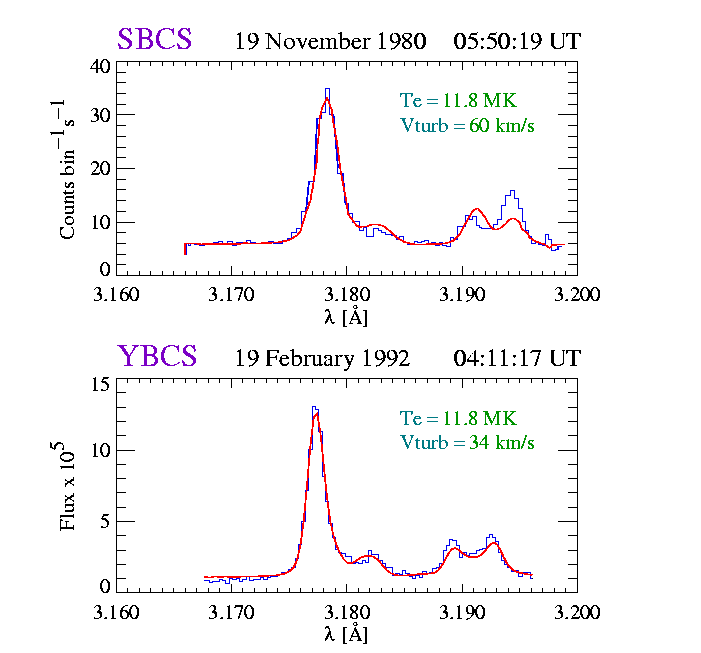
spectrometers SBCS and YBCS respectively. Several of the soft
X-ray wavelength bands measured by SBCS and YBCS are in common
(see the instrument description by Culhane et al. (1991). One of
these common spectral regions covers wavelengths in vicinity of
the prominent resonance line of Ca XIX helium-like ion (l=3.177 [Å] ) including respective
shortwavelength continuum. This particular range of X-ray
spectrum is especially interesting for studies of the calcium
elemental abundance since both the line and continuum emission
are formed in hot flaring plasma regions of about the same
temperature. This similar temperature dependence of the line and
the continuum emission eliminates to large extend the dependence
of the line-to-continuum ratio (L/C) on the temperature (for
detailed discussion see Sylwester et al., 1999). Based on the
interpretation of SBCS spectra we discovered that calcium plasma
composition vary between individual flares (Sylwester, Lemen and
Mewe, 1984), and noticed for particular active region a trend of
average flare calcium abundance to increase with time (Lemen,
Sylwester and Bentley, 1986). The early analysis of Yohkoh
spectra performed by Bentley, Lemen and Sylwester, (1997)
confirmed presence of flare-to-flare calcium abundance
differences. However a problem has been identified: the average
values of absolute Ca abundance as determined from SBCS and YBCS
have been found to disagree (`ACa = 5.77
±1.41 and 3.40 ±0.42
for SMM and Yohkoh) respectively . One may
think of a number of factors which may be responsible for the
noted difference. One of them can be related with the
instrumental shape of the spectrometer.
Determination of absolute calcium abundance from soft X-ray spectra in vicinity of Ca XIX resonance line is a complicated multi-step process involving precise knowledge of the spectrometer and appropriate atomic physics. Detailed description of the procedure leading to absolute Ca abundance determinations has been discussed by Sylwester et al. (1999). One of the most important steps in the abundance determination is the fitting of the synthetic spectra to the measured spectral signal.
In order to calculate the synthetic spectra the best available atomic data present at the time have been used for SMM and Yohkoh analyses respectively. The atomic physics factors which are important in spectral synthesis task are:
A number of assumptions concerning the physical conditions in the source are normally made:
In addition, in order to synthesize the spectrum for a particular spectrometer, the instrument spectral response function (ISRF) is to be known. The shape of ISRF depends on the particular details of the Bragg spectrometer construction. In case of bent spectrometers used aboard SBCS and YBCS the following factors are important:
It is assumed that the crystal rocking shape can be well approximated by a Voigt profile characterized by respective Lorentzian and Gaussian widths. The position readout profile has been assumed to be of a Gaussian shape.
Instrumental factors responsible for a shape of the ISRF have been carefully measured for both SBCS and YBCS spectrometers and their values which were used in analysis of Ca XIX spectra are put in Table 1
Table 1: Parameters defining instrument widths
for SBCS and YBCS.
| FWHM width | SMM | Yohkoh |
| [mÅ] | Ca XIX Channel | Ca XIX Channel |
| Lorentzian | 0.64* | 0.3889 |
| Gaussian | 0.2940 |
* from SMM X-ray Polychromator User's
Guide, Lockheed-MSSL-RAL 1980
The value represents the combined Lorentzian and Gaussian widths.
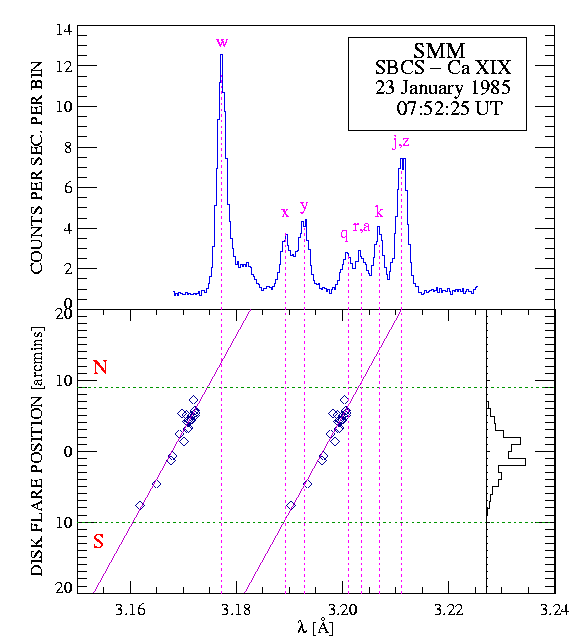
In addition, the observed spectral line profile shape may depend on the extend of the source as projected on the dispersion plane. For SBCS most of these problems are not relevant since the collimator placed in front of the spectrometer (6 ×6 arcmin FWHM) selected only particular active region at which the spectrometer has been pointed at the time of the measurements. In case of YBCS the FOV of the spectrometer covers entire Sun and therefore the source (flare) angular dimension provides ''self-collimation'' in most cases. However the portion of Ca XIX spectra illuminating the detector depends on the flare position along the dispersion axis (oriented N-S in case of YBCS). This effect is illustrated in Fig. 2.
In order to compare the results of fitting of the synthetic spectra to the measured counterparts for the two spectrometers mentioned one has to understand the differences between the atomic physics used in spectral synthesis and the differences in the spectrometer's construction. Except for the line positions (wavelengths) the atomic physics used in spectral synthesis is consistent between the SBCS and YBCS spectra fitting packages. The differences in line positions between SBCS and YBCS software packages do not influence the results of Ca abundance studies very much.
The observed line widths change during flare and between flares due to evolution of the plasma conditions in the source as the flare progress, The instrument widths are expected not to depend on the source plasma characteristics, except for case of YBCS where detector ionization cascade clumping (ionization avalanche channeling) towards stronger line(s) is observed to become important for flares above M2 GOES importance.
Provided that some uncertainty is present in the values used for instrumental factors, this effect may influence the results of fit of the synthetic spectra in a systematic way. If such effects can be realistically identified this may provide argument for reconsideration of the instrumental factors involved in the synthetic spectra convolution.
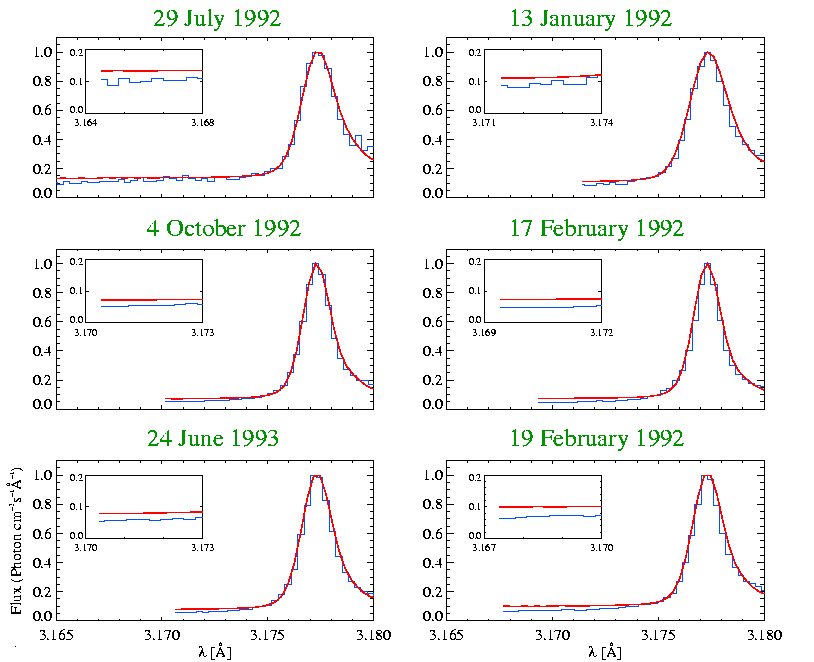
We concentrate our analysis on the spectra collected during the fall of solar activity cycle 22, since the corresponding SBCS measurements represent the fall of activity cycle 21. We decided to select for detailed analysis (from the Yohkoh data set) these observations which correspond to the period between 1 October 1991 and 1 October 1995. From the total of several hundred solar flares observed we have chosen six representative events using the following criteria:
We consider these criteria important based on the following
considerations:
Ad. 1. Flares observed at/close to the limb do
not show (Antonucci, et al. 1982, Fludra et al, 1989) a strong
blue-shifted line component. Therefore ä single spectral
component analysis" is, in the most of cases justified and
sufficient.
Ad. 2. For flares with GOES class above ~ M2 the YBCS detector appears to pronounce
significant instrumental bias changing the observed line profile
(the effect named ''photon clumping''). Therefore for a detailed
study of line profiles it is safer to work with spectra recorded
at the times when flare importance have been below this ~ M2 threshold.
Ad. 3. It is known (Antonucci et al., 1982,
Fludra et al, 1989) that during the gradual phase of flares, the
turbulent broadening of spectral lines is usually much less than
that observed during the rise phase. Turbulent broadening
contributes effectively to the observed line profile for YBCS an
SBCS and therefore, in order to lessen related effects, we have
selected for the analysis the spectra recorded during decay
flare phase only. This selection has been also applied in the
analysis of the SMM spectra discussed in Sylwester et.
al., (1999).
Ad. 4. By selecting flares far South from the
equator, we are able to investigate the quality of fitting for
the far wings. For most of Yohkoh flares only small
portion of the continuum is observed as follows from the diagram
shown in Fig. 2 (cf. the flare distribution along the N-S
direction represented as vertical histogram).
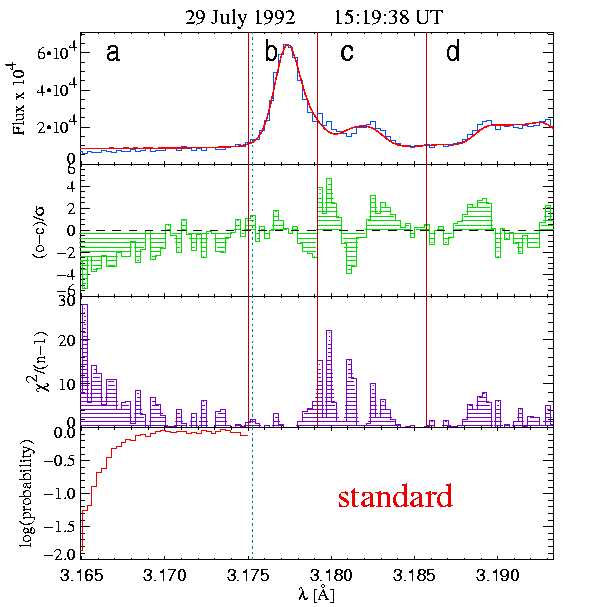
While fitting the YBCS spectra we have applied standard procedures described in detail by Fludra et al., (1989). In this respect we have used standard fitting routines available in the SOLAR_SOFT analysis package (FIT_BCS). In Fig. 3. we present examples of the fit to the decay phase spectra for the six flares used in the present analysis.
In Fig. 5 we present results of a rigid statistical test showing that the results of the fit using standard shape of the instrument profile are much beyond the level to be acceptable.
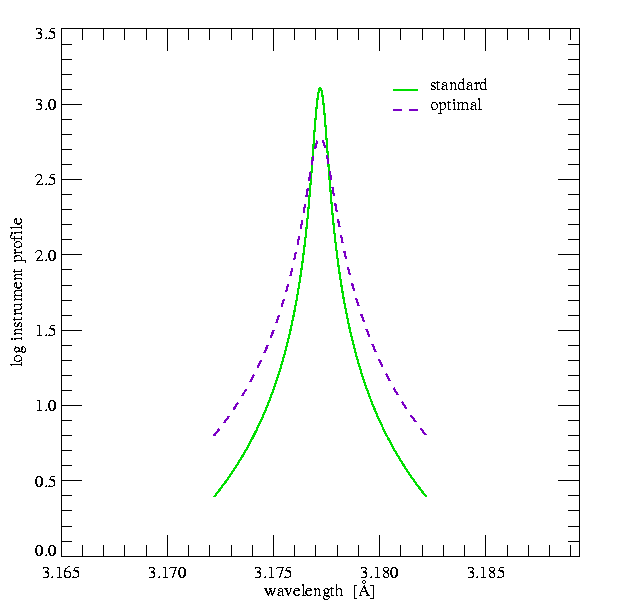
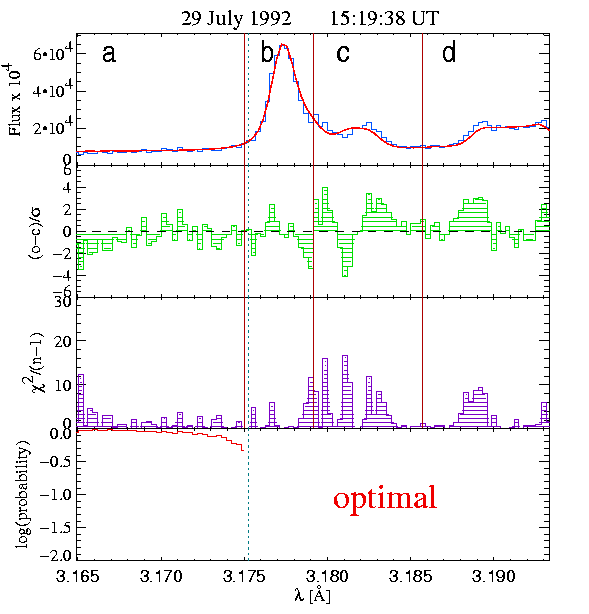
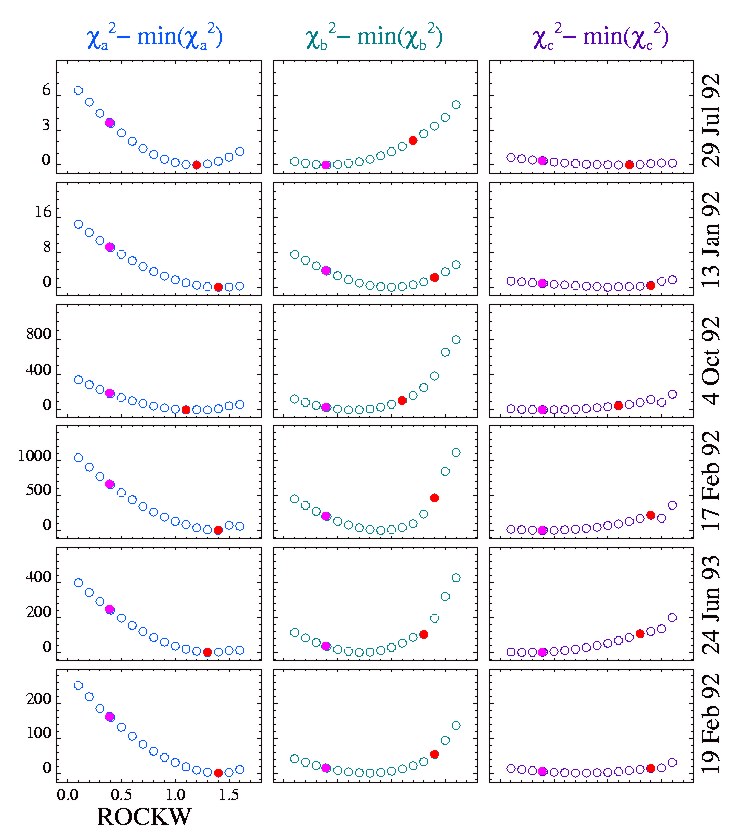
In order to relieve the discomfort of using the fitting procedure ''as is'', we looked for ways to improve the quality of the fit in the far wings. As mentioned, we allowed the Lorentzian part of the instrument profile to be a parameter. In Fig. 7 we present the results of such exercise for the three spectral ranges labeled a, b and c in Fig. 5. Range a represents the fit quality (normalized c2) for the far wing spectral region, b - the region containing the main line and c - the region with the satellite lines of importance for the determination of plasma temperature. It is clearly seen that optimum fit to the line wings is achieved when the Lorentzian width of the instrument profile is ~ 2.5 times the standard. This is the typical behavior for all spectra investigated.
Based on results presented in Fig. 7, we advocate, that the instrument profile of Yohkoh Ca XIX has to be modified. The suggest modification is to increase the width of the Lorentzian component of the spectral shape by a factor of 2.5. This modification will easy the fitting of the far wings of the Ca XIX resonance line and make the fit results more comfortable, as presented in Fig. 6.
Presented arguments seem to indicate that the shape of the instrument profile for the Yohkoh Ca XIX channel has to be modified.
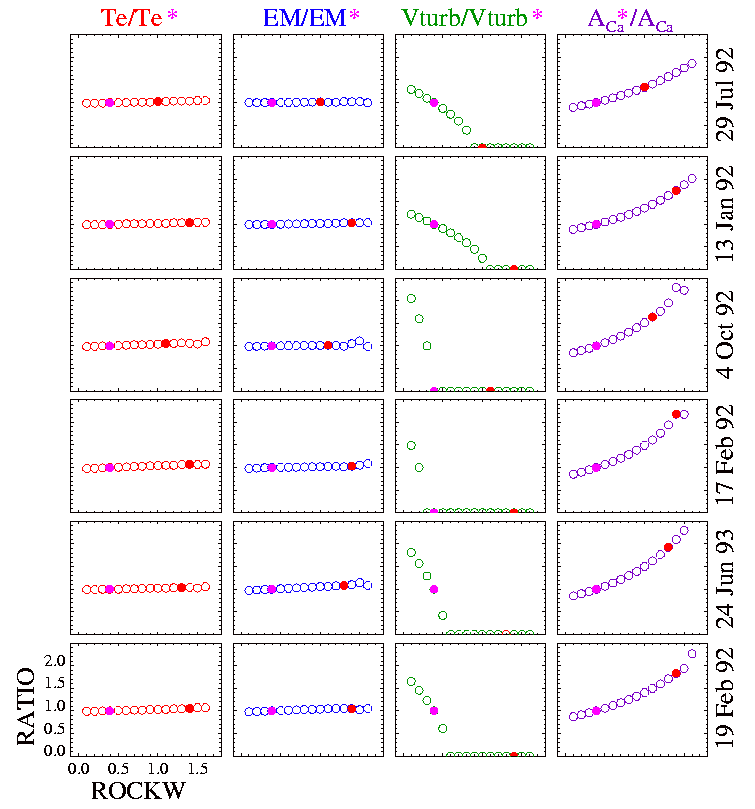
It is seen that the most sensitive (as expected) is the ''turbulent'' width derived. As the instrument line width increases, the value of this parameter assumes zero rapidly. Temperature and emission measure estimates are not affected. Substantial change is seen however for the value of the L/C i.e the plasma Ca abundance. In the right panel of the Figure the mentioned dependence is plotted indicating that changes of the instrumental width (towards the optimum value), are causing the abundance values derived to increase by a factor of ~ 1.5 .
The immediate result of the present study is to put in question the results of laboratory calibration of the Yohkoh Ca XIX channel. Additional work has to be done in this area. The possibility of end-to-end calibration of RESIK spectrometer (Sylwester et al., 1998) will create the opportunity. Provided that the instrument profile has to be changed, the values of abundances obtained from the analysis of Yohkoh data have to be proportionally increased by a factor of 1.56. This change will bring the average abundances of Ca as determined from YBCS up closer to the value derived from SMM spectra. These average abundance values are still disparate and the further work is necessary in order to find the reasons for the disagreement left.
This work has been supported by Polish Committee for Scientific Research Grant Organization of Magnetic Fields in the Corona 2.P03D.024.17.
e-mail: ak@cbk.pan.wroc.pl
File translated from TEX by TTH, version 2.25.
On 07 Oct 1999, 09:32.