Solar Soft/Hard X-ray Photometer-Imager aboard the INTERBALL-Tail Probe
Space Research Centre, Polish Academy of Sciences, 51-622 Wroclaw, ul. Kopernika 11, Poland
Astronomical Institute, Academy of Sciences of the Czech Republic, 251 65 Ondrejov
Space Research Institute, Russian Academy of Sciences, Profsoyuznaya St. 84/32, Moscow
Space Research Centre, Polish Academy of Sciences, 51-622 Wroclaw, ul. Kopernika 11, Poland
On 16 October 2000, INTERBALL-tail ended his usefull orbital life and has been directed to plunge into Atlantic Ocean.
The RF was developed in order to facilitate high-time resolution measurements of integral solar flux in the spectral energy range between 2 keV and 240 keV and to image solar flares in the bands 2 - 4 keV and 4 - 8 keV from rotationally modulated data (X-ray Tomograph-Imager, XTI). The photograph of RF instrument is shown in Fig. 1.
The RF is equipped with five detector systems:
Below we describe in more detail both instruments.
Table 1: Nominal energy ranges and designations for the lower energy photometer channels (formatted into standard, common block of telemetry).
| Channel # | s1 | s2 * | s3 | h1 * |
| Energy band [keV] | 2-3 | 3-5 | 5-8 | 10-15 |
| Detector type | Prop. | Prop. | Prop. | Scint. |
The proportional detectors consist of two cylindrical compartments with
steel walls ~ 1.2 mm thick sharing the same gas. The section exposed
to the solar radiation is equipped with the Be window in order to select
the radiation with the energy above ~ 1 keV. The hidden (twin)
section is illuminated by the radioactive calibration Fe55
source. Corresponding calibration signal is constantly probed in order
to detect ageing, leaking and other possible effects which may cause
deterioration of the gas gain. Special electronic feedback
system regulates accordingly the high voltage level on both anodes of
the detector counteracting in this way the effects of gain variations.
The energy discrimination thresholds are thus kept in place independent
of the gain variations. However, towards the end of 1997, the activity
of Fe55 calibration source (7 years from fixing) decreased more
than 10 times and went outside the limits of self-correction. Details of
the gain time variations will be presented in a subsequent paper where
the history of discrimination level positions will be given for entire
duration of the mission. The average background count rate is ~ 10 cts/s for the proportional detector.
The scintillation detector contains 8 mm thick NaI(Tl) crystal with the Al filter
(0.25±0.01 g/cm2 mass thickness) placed in front and a photomultiplier tube.
This detector has its own calibration source (Am241) but without feedback control.
In Figure 2, we present efficiencies of the proportional and scintillation detectors
plotted against the photon energy. The incident solar photon flux is transmitted by
detector window and absorbed by gas/crystal with the corresponding efficiencies.
The redistribution over energies according to spectral response function takes place
afterwards.
The proportional detector collects soft X-ray photons in three energy
bands 2 - 3 keV, 3 - 5 keV and 5 - 8 keV (see Table 1). The detector
window is placed slightly below the instrument cover opening. This
geometry causes the effective aperture to vary by few percent as the
solar illumination angle changes with the satellite spinning phase.
Table 2: Nominal energy ranges and designations for high-energy photometer channels recorded (in flare mode) into individual telemetry blocks. The measurements are reported every 125 msec.
| Channel # | h2 | h3 | h4 | h5 |
| Energy band [keV] | 15-30 | 30-60 | 60-120 | 120-240 |
| Detector type | Scint. | Scint. | Scint. | Scint. |
Figure 2: Spectral efficiency of the proportional (left) and scintillation (right) detectors as a function of photon energy.
Another factor contributing to modulation of the signal is that the
absorption depth of the photon also depends on the rotation phase. This
latter effect is especially important for higher energy radiation, for
which the photon absorption length in the gas is greater than the
detector depth.
The scintillation detector measures the hard X-ray flux in five energy
bands (see Tables I and II). In flare mode the measurements are made
every 0.125 s in the four highest energy channels. For these channels,
the data are allowed to be transmitted to the telemetry provided that
corresponding rate thresholds (40 cts/s) are exceeded for the four
consecutive seconds. Otherwise, the data are not written in order to
secure the telemetry volume. The channel h1 output is recorded
differently. It is formatted together with the signal from the
proportional detectors and sent to telemetry all the time (every 2 or
8 s) depending on the mode (flare or patrol). The adopted mode
names may however be somewhat misleading, since the most of data have
been collected in so-called flare mode. The reason for this was the
selection of very low threshold for flare trigger.
Actually it has been set at the level corresponding to microflare (few cts/s). Switching between patrol/flare modes is controlled onboard based on count rates
recorded in s2 channel. Early in the mission, the instrument
operated mostly in the flare mode, for periods up to several hours.
Table 3: Essential characteristics of the proportional detector.
| Aperture | Window | Gas Filling | Gas Depth | Energy resolution |
| 4.5 mm2 | Be 150mm | Ar+10%CO2, 350 Torr | 16 mm | 19% at 5.9 keV |
Later on, following the change in the detector feedback control, the
frequency of switching between the modes increased, and presently the
photometer operates preferentially in patrol mode except for flares
above GOES class B5 - B7.
During the patrol mode the calibration of the scintillation detector is
made approximately every 2 hours (cf. Table I). For calibration, a
moving arm equipped with Am241 radioactive source (half-decay
time 432.2 years; energy 59.6 keV) is being mechanically inserted into
the FOV of the detector. The calibration arm partly occults the aperture
contributing to the signal in h1. In this way during the calibration
the recorded signal responds in most cases to the calibration source
quanta only. The other data reported at the time of calibration
(s2 fluence) represent solar signal. The scintillation detector has
no feedback control and therefore the ageing effects can be deduced
only from analysis of time variations of the calibration level readouts.
This analysis is in progress.
| Aperture | Window | Crystal | Diameter/Thickness | Energy resolution |
| 1452 mm2 | Al 94±3m | NaI(Tl) | 43/8 mm | 22% at 59 keV |
These observed modulations have few percent relative amplitudes and the period around 118 s. In order to remove the fluctuations, we have determined appropriate phase modulation profiles (for each of the channels separately) using epoch folding (details of the procedure will be described in a subsequent paper). These folded profiles have been next used in order to remove the modulation from the raw data. At present, we are in the process of systematic reformatting and regularizing the data.
At our web site (www.cbk.pan.wroc.pl/rf15-i_www/RF15-I
_observations.htm) we put all the data processed so far along with
short explanations. On a positive side is that the modulation of the
signal due to the satellite rotation allows for distinguishing between
solar X-ray emission and non- solar particle contribution (the last
being usually not modulated).
One of the important advantages of RF measurements is that there are
many periods where the solar signal has been measured every 2 s
continuously for up to 40 hours in the four energy bands.
The overall data coverage of the solar X-ray photometry is ~ 85%.
The physical analysis of data is in progress. In the example shown in
Figure 4 (bottom panel) we present derived variations of coronal
source plasma temperature as determined in the isothermal approximation
from the ratio of fluxes recorded in the s1 and s2 bands. One
may notice that the scatter in derived temperature is relatively small
and that the temperatures are within realistic range also for periods
where no flare in progress has been reported. Details of the physical
data analysis will be published in a forthcoming paper.
As concerns the data collected in the higher energy channels, reliable
measurements have been made for hundreds of events (Siarkowski et
al., 1999). Analysis of this data indicates that during strong events,
pile-up effects might contribute to the flux in higher energy channels,
as well as the detector dead time effects may become important (as
pointed up by the Referee). The dead-time for electronics of both
proportional and scintillation counters is 8ms, larger than
intrinsic detector's physical dead-times. Therefore, the effects of
pile-up and dead-time corrections will become important (at 10% level)
for count rates above 104 cts/s. A more detailed consideration of
these problems will be given in the forthcoming paper.
For the M1.2 flare shown in Fig. 6, RF recorded the fluxes in h2 and
h3 energy channels. This flare has been observed also by
Yohkoh HXT and BATSE. We put corresponding lightcurves in the
Figure for the comparison. The overall agreement of signals in
corresponding energy bands is very good (for description of the HXT
construction see Kosugi et. al., 1991). Detailed cross-calibration
between RF, GOES, HXT and BATSE measurements is in progress.
The higher energy RF data are also presented and available from our web server.
While crossing van Allen radiation belts the detectors were designed to
be switched-off. We noticed however that on several occasions the
particle flux has been low enough not to trigger the in-belt flag.
Therefore the detectors did not switch-off and recorded signal due to
particles. This resulted in a characteristic pattern of recordings in
all channels of RF. Such particle events can be easily recognized
through their specific inverted/flat energy spectrum. On at least one
occasion the non-solar hard X-ray event has been detected, originating
from the SRG1900+14 burst (Sylwester et al., 1998).
We have encountered a number of problems during data reduction and
prompt analysis. For example, the count rate level from large flares
(i.e. above M5-M6 GOES class) exceeds the capacity of counters
(set at 32000 and 64000 hits per integration time in particular
channels). This caused counter wrapping, sometimes many-fold.
The XTI consists of two units:
Length |
Fringe |
FWHM |
Transmission* |
Energy bands |
Readout |
160 mm |
4.8 arc min |
11 arc sec |
0.08 |
2 - 4 keV |
1/128 s |
The exact location of the grid planes have been calculated according to a novel strategy. The novelty of the solution is the use of semi- numerical interactive method of placing the grids. In case of the XTI, we specified the approximate values for the collimator length, thickness of grids, desired resolution and transmission fringe separation and found the optimum collimator design as presented in Fig. 8.
The
collimator grid system has been co-aligned by visible light technique
with diffraction effects taken into account. We measured separately the
transmission in X-rays. The area averaged rms alignment accuracy has
been found to be ±1 mm, and the maximum wire misalignment found
is ~ 10 mm.
As shown in Fig. 8, the front and the middle grid wired sections cover
only a portion (approximately half) of the planes. The front grid has
additionally an occultation strip. The width of this strip is
selected to be 6.2 mm allowing thus to ensure that the solar disk will
be fully eclipsed (as seen from the detector window). With the Sun
crossing the bar, the solar X-rays are totally blocked permitting
measurements of the background signal (cf. Fig. 8).
In Fig. 9 we schematically draw the trajectory of a compact solar source (flare) as seen in the coordinate system of the collimator (front grid). Provided nutation is negligible, the solar source trajectory is a circular path crossing the open area, occultation bar and gridded area. Depending on the offset d of the source relative to the axis of the collimator, a number of modulation patterns are expected:
An example of calculated characteristic pattern of the signal modulation is shown in Figure 10.
The actual position of the satellite rotation axis relative to the optical solar disk is monitored by a dedicated optical sensor unit described below.
The SDS unit consists of the optical system which projects images of the
solar disk on the system of two narrow slits. The optical axis of SDS is
coaligned with the axis of the X-ray collimator. The slits are adjusted
to be parallel to the occulting bar. Spinning of the spacecraft causes
the projected optical solar disk to circle through the double slit
system presented in Fig. 11.
Behind the slit system, the photodiode monitors the overall optical flux
passing through the slit system. A dedicated on-board computer routine
analyzes the slit crossing times and determines corresponding phases of
rotation and the solar centre offset angle based on the history of slit
crossing times from the previous rotation. The slit crossing times were
envisaged to be dumped to the telemetry after every 100 satellite
rotations.
It is by misfortune that during the pre-flight preparations immediately preceding the launch from the Baikonur, the aperture of the SDS optical sensor has not been cleared. As a consequence we are missing the data from this sensor. We have fortunately foresighted for such an unfortunate situation and pre-programmed a safe-mode activity for the XTI in such circumstances.
The signals incoming from the XTI are being processed in real time by
the PRAM onboard computer and stored temporarily to the onboard memory
before being sent to the ground.
In order to effectively use the memory capacity, we devised an
elaborated scheme of on-board signal processing, which saves the memory
and allows to concentrate on flare events occuring between consecutive
telemetry dumps. In particular, the signal from XTI X-ray detector is
constantly monitored in order to detect the flare occurence. Flare
intensity class is being estimated in real time and the decision is made
on-board when and which observing sequence is to be executed. Even with
such elaborated scheme, only ~ 80 compressed image modulation
sequences can be stored in the on-board memory between consecutive
ground telemetry dumps (say one sequence per hour on average).
The following XTI operation modes have been preprogrammed:
In Figure 12, an example of the XTI modulated signal for the 20 October 1995 flare is shown. There are hundreds of periods identified already where the imaging sequences have been executed. We will present detailed analysis of these periods in one of a subsequent publications.
Figure 12: The observed modulation of the X-ray signal in the 2 - 4 keV band of the X-ray Tomograph-Imager (XTI) for 20 October 1995 flare. In the bottom panel, initial small portion of the recorded signal is enlarged in order to present more details of the record shown above. On the horizontal axis the time elapsed from the start of this particular modulation sequence is indicated.
The solar X-ray source (flare) is scanned at various angles (directions)
due to spinning motion of the satellite. The detector signal in any of
the transmission fringes represents one-dimensional projection of the
two-dimensional source brightness distribution. As the phase of the
rotation changes views from many projection angles are recorded. A
resulting set of multiple one-dimensional scans constitutes the input
for the numerical image reconstruction algorithm. Below, we briefly
introduce the basics of this image reconstruction algorithm.
In Fig. 13 we present definitions used when formulating the problem of
image reconstruction. In this representation f(k,l) is the X-ray
brightness of the investigated source.
Fixed coordinate system (k,l) is used. During the scan, the value of the measured signal in each position (time bin represented as column m perpendicular to the scan direction) represents a result of convolution of the collimator transmission function g and the source intensity integrated along this perpendicular direction. Thus, the flux measured in bin number j can be expressed as:
For the purpose of image reconstruction we have assumed the collimator transmission function to consist of a number of triangular profiles (windows) with FWHM = b = 11 arcsec. The consecutive transmission windows are separated by the angular distance p = 288 arcsec. In the assumed coordinate system, the transmission g in bin j is:
where d is the bin width and n = 0, 1, 2, ... is the index of particular transmission window. In case of scan taken at the position angle ji, the value of m in Eq. (2) is k cos ji + l sin ji, so the signal measured in bin j can be expressed as:
For compact sources with spatial extension smaller than the separation between transmission fringes, only a single transmission FOV contributes to the signal. By rotating the collimator relative to the source, its brightness distribution fkl is recorded in a set of intensity vectors Iij (corresponding to individual scans). This transformation is handled by a transmission tensor gijkl.
The purpose of image restoration process is to solve the inverse problem i.e. to determine f(k,l) from measured Iij. We have developed an elaborated maximum likelihood iterative procedure to solve this inverse problem. Within the algorithm, we assume a uniform brightness distribution as an initial approximation (fkl = const). The subsequent (improved, n+1) approximation for fn+1kl distribution is obtained by multiplying the preceding result by the appropriate correction matrix. This correction matrix represents the ratio of the observed (O) and calculated (C) flux in each bin, weighted by the collimator transmission function:
For instance, if the observed flux at bin j is greater the calculated
one, we increase the brightness in each of the pixels (k,l) which
contribute to this bin (in proportion to the corresponding individual
weights of the collimator transmission function).
The quality of the iterative convergence is judged in terms of c2 statistics.
The process of image reconstruction is terminated when the value of reduced c2
approaches unity.
The inversion technique used here is a straightforward extension of one-
and two-dimensional maximum likelihood iterative inversion methods
commonly used for solar X-ray data analysis (Sylwester, Schrijver and
Mewe, 1980; Svestka et al., 1983, Sylwester and Sylwester, 1998,
1999). It is analogous of the computer tomography image reconstruction
procedure used in medical applications, where scans from many directions
are used to generate two-dimensional picture of (slices) of the body
internal structure.
The method used is inherently positively constrained since it uses
multiplicative corrections based on observed to calculated (weighted)
flux ratios. Within the present method it is possible to vary the pixel
size in the reconstructed image, independently of the size or the number
of modulation scans used for image reconstruction. At present, we
perform deconvolution using 10 arcsec ×10 arcsec pixel size in
the deconvolved image. We will look for the solutions with finer mesh in
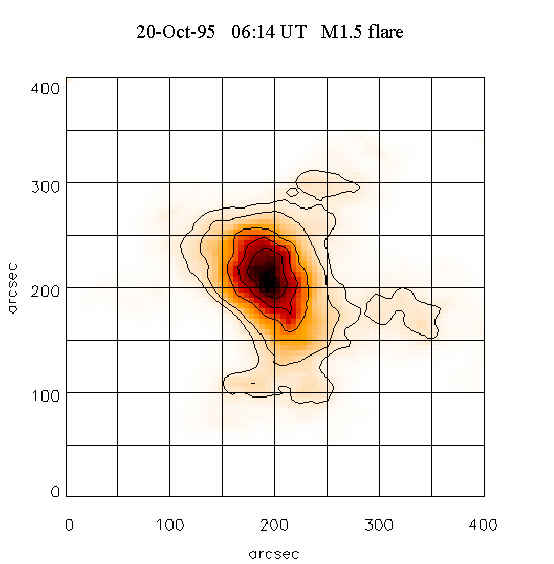
the future. In Fig. 14 we present an example of the reconstructed image
for the 20 October 1995 flare observed around 06:14 UT. The lightcurves
of this flare are shown in Fig. 4. The flare took place on the disk (S09
W55).
The limiting spatial resolution on the reconstructed image depends on many factors such as the signal/noise ratio of the modulated signal, the amplitude of nutation of the spacecraft rotation axis and the time variations of brightness within the flaring structure during the modulation period (we assume the latter not to change during this time). There are hundreds of identified modulation sequencies available for the image reconstruction. We will perform their analysis in the near future.
van Beek H.F.: 1976, Space Science Instrumentation, 2, 197.
Kosugi T., Mikishima K., Murakami T., Sakao T., Dotani T., Inda M., Kai K., Masuda S., Nakajima H., Ogawara Y., Sawa M., and Shibasaki K.: 1991, Solar Phys., 136, 17.
Lin R.P. at al.: 1998, 'High-Energy Solar Spectroscopic Imager (HESSI) Small Explorer Mission for the Next (2000) Solar Maximum', in C. M. Korendyke (ed.) 'Missions to the Sun II', Proc. SPIE Vol. 3442, p. 2
Oda M. Muranaka N., Matsuoka M., Miyamoto S., and Ogawara Y.: 1976, Space Science Instrumentation, 2, 141.
Siarkowski M., Sylwester J., Gburek S., and Kordylewski Z.: 1999, 'Review of RF15-I X-ray Photometer Observations', in A. Wilson (ed.) Magnetic Fields and Solar Processes, ESA, SP-448, p. 877.
Svestka Z., Schrijver J., Somov B.R., Dennis B.E., Woodgate B.E., Furst E., Hirth W., Klein L., and Raoult A.: 1983, Solar Phys., 85, 313.
Sylwester J., Kordylewski Z., Siarkowski S., Gburek S., Farnik F., and Likin O.:1998, Acta Astronomica, 48, 819.
Sylwester J., Schrijver J., Mewe R.: 1980, Solar Phys., 67, 285.
Sylwester J. and Sylwester B.:1998, Acta Astronomica, 48, 519.
Sylwester J. and Sylwester B.:1999, Acta Astronomica, 49, 189.
Tsuneta S.: 1984, Ann Tokyo Astron. Obs., 20, 1.