Space Research Centre, Polish Academy of Sciences, 51-662 Wrocław, Kopernika 11, Poland 1
Key words: solar physics; flares, X-rays, imaging, Bragg spectroscopy
In 1969, thanks to the iniciative of Late Professors Jan Mergentaler and Stefan Piotrowski, a group of people had been associated in Wrocaw, aimed to investigate the Sun in EUV and X-rays. Now this group constitutes one of the divisions (Solar Physics) of Space Research Centre. This group had an to use (for free) the Russian launchers in order to make experiments within the frame of INTERCOSMOS Programme. We developed a number of instruments for several sounding rockets and satellites. These instruments have been designed to image the Sun in X-rays and measure solar X-ray spectra. The chronological list of instruments flown is presented in Table 1. In Figure 1 we show, for sake of illustration, the X-ray solar images obtained using the pin-hole cameras during the flight of Vertical-1 sounding rocket. This images constitute the first Polish scientific results obtained using space techniques. The analysis of these images allowed to identify presence of the hot component within non-flaring active region plasma (Kordylewski et. al., 1973), recently confirmed in the study of Yohkoh observations.
Figure 1: Solar images obtained using pin-hole cameras during the flight of Vertical-1 sounding rocket on 28 November 1970. The Be 50 m and Al 6 m filter images represent emissions from the hotter and cooler plasma. The ''filetr ratio'' technique allowed to determine the temperature structure within individual active regions. The spatial resolution in the images is rather low (1 arcmin), typical for pin-hole technique.
According to the Bragg law, the wavelength l of the radiation ''reflected'' from the crystal lattice, is related with the angle of grazing incidence Q according to the condition:

where d is the lattice spacing. Soft X-ray spectra are recorded by rotating the crystal relative to the source direction (solar active region or flare).
The first Polish Bragg X-ray solar spectra have been obtained during the flights of Vertical-8 and Vertical-9 rockets respectively (Siarkowski and Sylwester, 1985). The spectra are shown in Figure 2. The interpretation of these spectra has been somewhat complicated due to superposition of the line components arising from several active regions present on the disk during measurements. However, it was possible to determine the temperature and emission measure of individual active regions by deconvolving complicated line profiles into separate components. It was confirmed (Siarkowski and Sylwester, 1985) that within non-flaring active region, some amount of hot material is present with temperature ~ 5 MK.
|
Date |
Exp. | Equipment | Comments |
|
28.11.1970 |
V-1 |
SF-3 KO-12 |
First Polish space experiment |
|
20.08.1971 |
V-2 |
SF-3
KO-12 |
|
|
30.08.1977 |
V-5 |
KO-60
SzRF |
First Polish broad band photometer |
|
26.09.1979 |
V-8 |
KO-60 & RTF & SzRF & MRF |
First Polish Bragg spectrometer |
|
24.12.1980 |
V-? |
KO-60 & RTF & SzRF & MRF |
Failure launch
|
|
28.08.1981 |
V-9 |
KO-60 & RTF & SzRF & MRF |
|
|
20.10.1983 |
V-11 |
KO-60 & RTF & RDR |
First test of Dopplerometer |
|
02.03.1994 |
C-I |
Diogeness |
Our first instrument on a satellite |
|
03.08.1995 |
INT Tail |
RF15-I |
Our first rotation modulated collimator |
|
Mid-2001 |
C-F |
RESIK & Diogeness |
Our first bent Bragg spectrometer |
|
V - Vertical, C - CORONAS INT - INTERBALL SF - XUV diffraction grazing spectrometer KO - Block of pin-hole cameras/No. of cameras SzRF - Broad-band soft X-ray photometer RTF - Volter grazing incidence X-ray telescope MRF - Bragg flat crystal spectrometer RDR - Rocket Dopplerometer DIOGENESS - X-ray spectrometer-photometer RF15-I - Soft and hard X-ray photometer-imager RESIK - Bragg bent crystal spectrometer |
Figure 2: Left: X-ray spectra of the wavelength region covering a part of so-called Mg XI triplet including
(partly) the resonance (R), intercombination (I) and forbidden (F) line
complexes. There were no collimator within the spectrometer flown aboard the Vertical-9
rocket. Therefore each active region present on the disk contributed (in projection on the scan
direction) to the individual line component as is shown in the right panel. The image shown has been obtained using grazing incidence telescope RTF equipped with Be 50 m filter. The Volter type II mirror used in RTF has been fabricated at the Astronomical Observatory
Ondrejov, Czech Republic.
Any radial motions of hot flare plasma will cause that the maxima of the lines will be slightly shifted in time. This time shift is proportional to the value of radial component of source plasma velocity. The effect is independent of the position of the source (flare) on the disc and/or the relative pointing of the spectrometer. The accuracy of the velocity determination is expected be very good, down to few km/s.
Figure 3:
Left: A scheme of one section of the X-ray Dopplerometer.
The crystals are mounted on a common shaft with the crystal planes aligned exactly at the angle 2Q.
Upper right: A scheme of the spectral pattern to be recorded by the Dopplerometer in
case of the source plasma being at rest. Note that wavelength
scannig is performed in opposite directions in both detectors.
Lower right: Spectral pattern for the source moving in the direction towards the observer.
The concept of the X-ray Dopplerometer has been tested during the flight of Vertical-11 rocket using the RDR (Rocket Dopplerometer) instrument (see Figure 4).
Figure 4:
The Rocket Dopplerometer RDR flown aboard Vertical-11 sounding rocked on 20 October 1983. The main components of the instrument are as follows: 1 - electronic box, 2, 3 - Geiger counters placed behind the rotaionally modulated collimator (4) and scanning collimator (5). Part of the crystal within the Dopplerometer section is seen (6). The scanning multigrid X-ray collimator ( ~ 10 italics resolution) is fixed to the driving shaft of the Dopplerometer and precisely aligned with the bisectrix between the crystal plane.
The objective of the RDR instrument was to test in flight the principle of the Dopplerometer and to obtain high resolution spectra of the solar active regions. Within the RDR a small unit containing the prototype of the rotationally modulated soft X-ray collimator (RMC) was placed to accquire appropriate experience in advent of the forthcoming satellite experiments (Coronas-I). The data from RMC, after appropriate numerical image reconstruction, provided the X-ray images of the Sun around 3 keV. This images compare well with the images obtained by means of the RTF soft X-ray grazing incidence telescope (Hlond et al., 1985) comprising a part of the Vertical-11 scientific package. The RDR and RTF instruments were placed on the pointed (disk centre, three axis stabilized) section of the payload, in the neighbourhood of the Russian scientific package designed in the Lebedev Physical Institute. For description of the Lebedev package see Zhitnik et al., (1999). The maximum attitude of the payload was 500 km, the duration of the observations above the atmosphere lasted ~ 550 sec (from 0425 UT). The data were radio-transmitted to the ground telemetry station. The scientific package has returned safely on a parachute. Announcement of the opportunity for placing a new instrument aboard the Vertical-11 rocket came only 18 months before the launch. We have been working therefore on development of the RDR in a big rush.
We designed our Dopplerometer (see Figure 4) in the way that it would provide the data of scientific importance. Our goal was to determine the variations of plasma temperature and emission measure during the experiment. We have chosen to measure the wavelength interval containing the strong members of the so called triplet lines of Mg XI helium-like ion i.e. the resonance line w (1s2 1S0 -1s2p 1P1, l = 9.168 A) and intercombination lines x, y (1s2 1S0 -1s2p 3P1,2, l = 9.231 A, 9.228 A) together with corresponding satellite lines. The satellite-to-resonance line intensity ratio provides an accurate measure of the plasma temperature (Dubau and Volonte, 1980). The line profile contains information concerning the plasma turbulence, while the absolute line intensity can be used to estimate the emission measure of the source plasma. We have placed a fine (10 italics resolution), multigrid (new design) collimator fixed to the crystal shaft, in order to obtain information on the distribution of X-ray brightness along the plane of dispersion of the Dopplerometer. We also added the rotating modulation collimator which data may be used to reconstruct an image of the source in X-rays. As a dispersive elements we have chosen ADP crystals (2d = 10.648 A) for which the instrumental rocking curve width (45 italics) is much narrower than expected thermal/turbulent width of the spectral lines. The total reflection coefficient (Rc = 8 10-5 rd) is large enough to allow measurements of the flux using small entrance aperture (80 mm2). The crystals have been manufactured in the Physics Department of the Wrocaw Technical University. The measurements of the reflection properties have been performed at our Laboratory. RDR had no thermal insulation, therefore we expected that the temperature of crystals could change due to irradiation in the visible and infrared ranges. With the aim to counteract for this possible variations we implemented the passive system to compensate for the crystal temperature dilatation. This system consisted of two bars which supported the crystals. The bars were made of metals with substantially different thermal expansion coefficients. The geometry of a support has been selected in such a way to change the agle between crystals in order to balance the thermal variations of the crystal spacing. RDR contained four Geiger counters as detectors of X-ray radiation. Detector windows have been equipped with a thin (12 m) Mylar foil coated with alluminum (0.2 m) of 0.8 cm area, except of the 10 m alluminum window placed in front of the rotating modulation collimator detector.
In Figure 5 the results are plotted from the Dopplerometer and scanning collimator. The forward-back range of the scan has been chosen to be ~ 1o. It is seen that spectral scans are taken in the opposite direcions for each crystal and the spectral line maxima coincide precisely in time with the brightness maxima as recorded by the collimator.
Figure
5:
Left: X-ray scans across the solar disk obtained from the multigrid collimator (top) and spectra in vicinity of Mg xi resonance line from two sections of the Dopplerometer. On the horizontal axis the time in minutes elapsed from 04:00 UT is plotted while on the vertical axis the count rate of the appropriate detector is indicated.
Right: Detailed Mg xi resonance line profile (thick line, bottom panel) superimposed on the brightness profile of the sources taken in the plane of dispersion (thin line). In the upper panel, the RTF image of the corresponding pattern of X-ray radiation is shown. Two strongest active regions located on the eastern and western limb contribute to the emission observed in the Mg xi resonance line. The western (lowest) active region becomes flaring during the period covered by the observations.
The average X-ray brightness profile of the source taken in the direction of dispersion is shown in Figure 5 (right panel, thin line). The profile has been obtained by the scanning collimator and has been averaged for all 6 scans executed. Above, the image of the Sun obtained by the soft X-ray telescope RTF is depicted. From Figure 5, it is seen that the strongest X-ray sources are nearly aligned along the line perpendicular to the dispersion plane of the Dopplerometer causing spectra of individual regions to overlap. In Figure 6 we present a detailed comparison of the Mg xi resonance lines as recorded (in opposite direction) by the Dopplerometer. After fitting the line profiles with the Gaussians, it was possible to precisely determine the relative displacement of the line centroids. This displacement is directly related with the source radial velocity (plotted in Figure 7, upper panel). It is seen that the velocity (towards the observer) increses by ~ 60 km/s during the rocket flight. However, the other explanation of the observed displacement could be related with the increase of crystal temperature (by 12o C). With the purpose of physical analysis of the data obtained, we have decomposed the spectra in vicinity of the resonance line into three gausian line components and the continuum. Decomposition has been performed my means of a special numerical routine described by Siarkowski and Sylwester, (1981). We have decided to use only three line components in decomposition based on the observed shape of the spectra, arguments coming from theoretical prediction of the spectral shape in the investigated region and stability of the decomposition procedure. After decomposition, we derived the plasma temperature based on analysis of the satellite to resonance line ratios (lower panel of Figure 7).
Figure 6: Six simultaneous Mg XI line profiles (thick forward, broken backward). They were recorded around 73, 142, 234, 302, 396 and 461 s during the flight on 20 October 1983. Spectra have been obtained using ADP crystal (2d = 10.64 A). It is seen, that the spectral line separation increases with time. Dotted line represents reference profile of the source brightness as recorded using 10 italics slit collimator. Verical axis represents count rates and horizontal time in seconds.
This time, the line chosen for the velocity diagnostics was the Ca xix w resonance at 3.169 A. This line is formed in the flare plasma only, at regions with temperature above 8 MK. However, during the period of measurements between March and June 1994, just few flares of sufficient importance have been observed (close to solar minimum). We have rather bad luck and no one of this flares has been catched by the spectrometer, however some of them have been observed by the soft X-ray photometer comprising the Diogeness (for details see Sylwester and Kordylewski, 2001). In Figure 8, we present a photo of the spectrometer, photometer, and an example of the photometer record from Diogeness.
Figure 7: Time variations of the Doppler plasma velocity and temperature determined from the rocket Dopplerometer spectra presented in Figure 6. Velocities have been derived from the line shifts and the temperatures from the satellite (Mg X) to resonance (Mg XI) line ratios.
Diogeness is to be flown again aboard the CORONAS-F Mission in mid-2001. This time solar activity is expected to be high and many spectra should be recorded. Besides Diogeness, aboard CORONAS-F there will be placed the most advanced bent crystal spectrometer RESIK.
This is a bent crystal spectrometer (see Figure 9), designed to cover the spectral range below 6 A with the aim of measuring line and continuum fluxes for hundreds of lines from ions with atomic numbers 30 > z > 14. The crystals used as dispersive elements are thin wafers of silicon and quartz monocrystals of large areas (4 cm × 13 cm). The wavelength channels of RESIK spread over ten different spectral bands covering almost entirely the 1.1 A - 6.1 A range. The crystals are bent to convex cylindrical profiles since this geometry allows to reduce the overall size of the crystal-detector assembly. The crystals which have been selected for spectrometers are free of fluorescence. Previous spectrometers have had problems with background from diffracting crystals when they were illuminated with energetic photons (E > 11.2 keV in case of germanium crystals). The absence of fluorescence contamination is essential for determination of elemental abundances from measurements of the line to continuum ratio. A double position-sensitive proportional counter is used for each of the two RESIK spectrometer for recording diffracted photons. The detectors are upgraded compared with the Yohkoh BCS (Culhane et al., 1991). There are no moving parts (except for the stepper motors used for the Fe55 calibration sources) and no collimator is used. Hence, the X-ray radiation from the entire solar corona contributes to the spectra. More details concerning the construction of RESIK can be found on its web pages. In Figure 10 we present the overall coverage of 10 wavelength bands available from RESIK (bottom bars) and 4 wavelength bands available from DIOGENESS (upper bars). Several groups of researchers are involved in developing RESIK and DIOGENESS. The following institutes/scientists are involved in the instrument development:
RESIK - Institute of Terrestrial Magnetism and Radiowave Propagation, IZMIRAN, Russia (Victor Oraevsky, Anatoly Stepanov); Mullard Space Science Laboratory, UK (Len Culhane, Bob Bentley, Phil Guttridge, Matt Whyndham); Naval Research Laboratory, USA (George Doschek, Charlie Brown, Uri Feldman, John Mariska and John Seely); Rutherford Appleton Laboratory, UK (Ken Phillips, Jim Lang); Space Research Centre, Polish Academy of Sciences (Janusz Sylwester-PI, Zbigniew Kordylewski, Marek Siarkowski, Barbara Sylwester).
Figure 8: Photographs of Diogeness spectrometer (upper left) and photometer (2 - 4 - 8 keV bands, right). An example of the lightcurves obtained from the photometer with small (0.01 cm2) and larger (0.3 cm2) apertures is shown in the lower panel. Different shades represent different modes of signal sampling (down to 0.125 s). For detailes see Sylwester and Kordylewski, 2001.
DIOGENESS - Institute of Terrestrial Magnetism and Radiowave Propagation, IZMIRAN, Russia (Victor Oraevsky, Anatoly Stepanov); Astronomical Institute, Czech Academy of Sciences (Franta Farnik); Space Research Centre, Polish Academy of Sciences (Janusz Sylwester, Zbigniew Kordylewski).
Details concerning the division of tasks in the development of instruments can be found on the web pages http://www.cbk.pan.wroc.pl/.
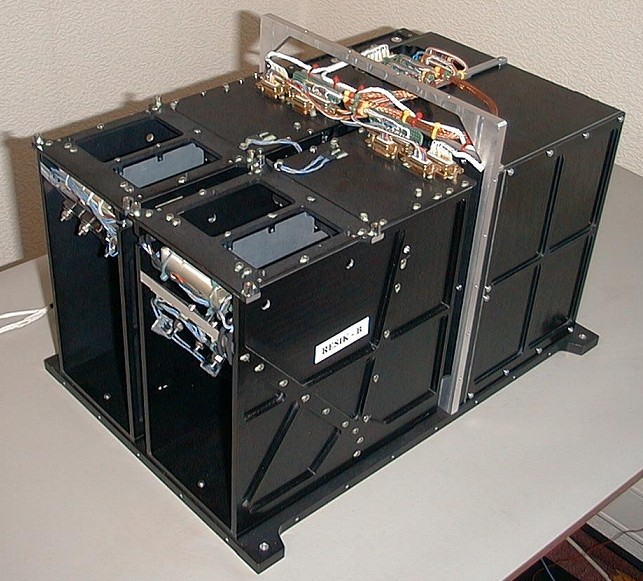
Figure 9: Photograph of RESIK spectrometer with the cover removed. For details of the instrument characteristics see Sylwester and Kordylewski, 2001.
Figure 10:
The wavelength coverage of individual bands of DIOGENESS (upper dot-limited bars) and RESIK (lower bars) at the first, second and third orders of reflection. The background spectrum has been recorded aboard OSO V Bragg crystal scanning spectrometer.
Another spin-off of the RDR experimental flight was the construction of the RF15-I Photometer-Imager. This instrument has been flown aboard the INTERBALL-Tail Probe (1995 - 2000) and recorded hundreds of megabytes of solar fluencies in the spectral ranges covering the soft (2 - 3 - 5 - 8 keV) and hard (10 - 15 - 30 - 60 - 120 - 240 keV) X-ray emission. Besides the photometer, the rotationally modulated collimator of special construction has been implemented which data allowed us to reconstruct the flare images in the 2 - 4 keV band with spatial resolution of ~ 10 italics. The RF15-I instument is described in details in Sylwester et al., (2000).
This work has been possible due to the Grant: Organisation of Magnetic Fields in the Corona 2.P03D.024.17 of Polish Committee for Scientific Research.