We summarize main achievements
of the solar studies performed in the framework of the INTERCOSMOS Programme.
The most attention is given to X-ray (λ< 30 Å) solar
research performed in Russia, Czech Republic and Poland. In order to keep the
review concise, we select to discuss the most important achievements, both in
respect of the scientific significance and the progress in development of the
original instrument concepts.In
particular, in our opinion, the three groups from:
·P.N. Lebedev Physical Institute (FIAN) from Russia,
·Astronomical Institute of Czech Academy of Sciences (AI CAS) and
·Space Research Centre of Polish Academy of Sciences,
mostly contributed to the progress in
the field.
The results obtained within the
INTERCOSMOS Programme are related to solar flare and active region physics,
atomic physics and plasma diagnostics. In many cases, the results obtained and
ideas developed were essentially new. Their novelty has wildly influenced
development of space solar studies, opening several new research areas and
stimulating new experimental concepts. Some of the concepts developed over the
last 30 years did not loose their importance and continue to affect the
research work in space solar physics at present.
INTRODUCTION
The initiative of experimental solar research in the short X-ray
range came from late Academicians A.A. Lebedev and S.L. Mandel’stam
resulting in the first experiment (with photomultipliers) put aboard the second
Russian Sputnik launched on November 3rd, 1957. In the following
years several other sounding rocket and satellite experiments have been
performed in Russia providing new information on the temperature of plasma
within the coronal portion of active regions /1/.
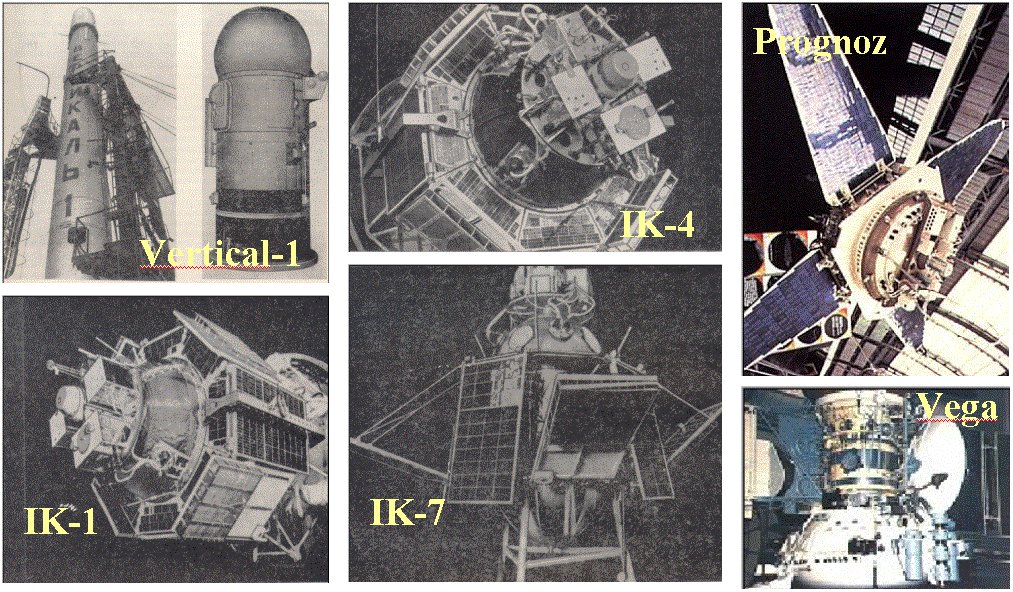
Fig. 1. Early rockets and satellites carrying
solar experiments.
From the
analysis of X-ray photometric measurements (Geiger counters placed aboard
interplanetary stations, Electron andVenera) it was possible to detect the dependence of X-ray fluence on the
phase of the solar 27 day rotation period and correlate it with the other
activity signatures like the flocule and radio sources area. In parallel, the
atomic theory necessary for the interpretation of the X-ray spectral
measurements has been vividly developing which allowed to identify mostly
thermal character of the observed emission /2/. In early sixties, the imaging
of the Sun in X-rays using pinhole had been initiated thanks to the
introduction of three-axis stabilized payloads. This resulted in the world-wide
best (at that time) images of the Sun obtained in the short wavelength bands
/3/. Analysis of these images revealed that the hotter and denser plasma
components of active regions may be present to heights up to ~100 000 km above
the photosphere.Around the time INTERCOSMOS
came into existence, in 1967 and 1968, Cosmos-166 and Cosmos-230 satellites
carried so-called X-ray heliographs consisting of slit collimators scanning the
Sun in perpendicular directions. The angular resolution was superior (15 - 20
arc sec). The analysis of those measurements allowed for the first time to
restore about 1000 images of the hotter sources (T ~ 5-10 MK) in the solar
corona in five energy bands /4/. It was found that these sources, related to
active regions, might be present continuously for periods up to several hours.
Spatial relations of these hot X-ray sources with regions of intense magnetic
fields at the photospheric layers were established /5/. For more details see
/6/.
In Fig. 1,
we present photos of important INTERCOSMOS sounding rockets and payloads as
compiled from various sources.
Inauguration of
the INTERCOSMOS opened the possibility to join the experimental programme of
short-wavelength solar research for countries closely related to Soviet Union.
In Poland, late Professors Mergentaler and Piotrowski had recognized soon that
this constituted an excellent opportunity to organize in Wrocław a group
devoted to solar X-ray experimental investigations. In Czechoslovakia, another
group joined the team thanks to efforts of Professors Bumba and Valnicek from
the Ondrejov Astronomical Observatory. Czech group had grown quickly and become
a major partner of the solar research programme. The list of key people who
have been (or are still) involved in the multilateral co-operation are given in
Table II.
EARLY MISSIONS
AND RESULTS
As this review is prepared from the Polish
perspective, we will focus on these experiments and data analysis results
which have been obtained through multilateral co-operation within the
Programme. In Table I, we put the list of important flights carrying solar
physics experiments.
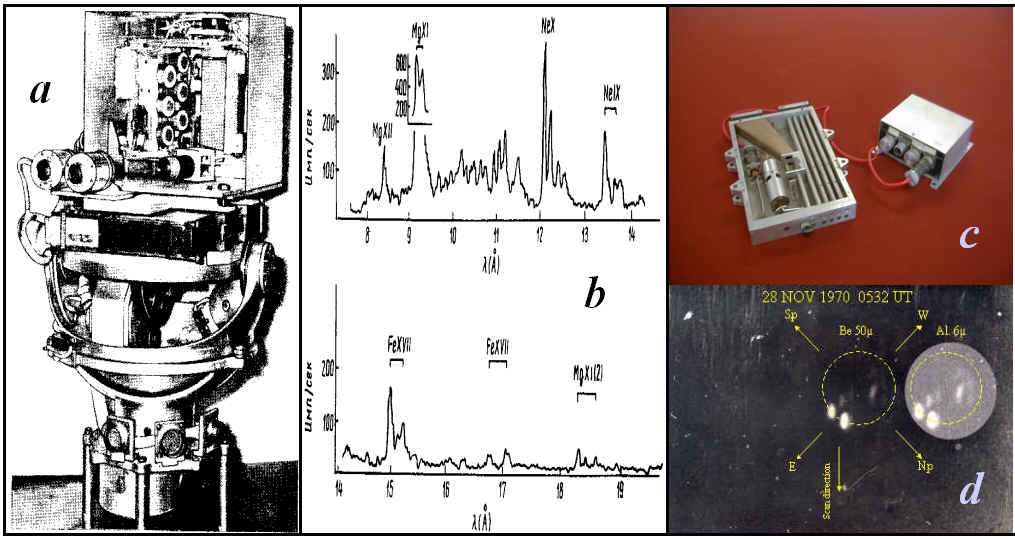
The first Polish space instruments block of 6
pinhole cameras and EUV spectrometer have been launched aboard Vertical-1
rocket in 1970. The photo of pinhole cameras package is shown in Fig. 2c and
the solar images obtained in Fig. 2d. Apart of the Polish instruments, the
payload contained FIAN package with the Bragg KAP crystal spectrometer.
Fig. 2. The
Vertical-1 three-axis stabilised payload (a). The X-ray spectrum of solar non-flaring
active region obtained around 05:32 UT on 28 November 1970 from FIAN Bragg
spectrometer (b). The Polish pinhole cameras and grazing incidence EUV
spectrometer (c) and the solar X-ray images from these pinhole cameras obtained
using Be and Al filters of 50μ and 6μ respectively.
Table
II. Co-operating groups and people
IZMIRAN
V.N.
Oraevsky
V.D.
Kuznetsov
S.
Puliniec
V. Polyansky
V. Ishkov
A. Stepanov
FIAN
S. L. Mandels’tam
I.I.Sobel’man
I.A. Zhitnik
L. A. Vainshtein
A.
M. Urnov
V.
A. Boiko
Astronomical Institute, Ondrejov
Boris Valnicek
Franta Farnik
Rene Hudec
IKI
Oleg
Likin
Space Research Centre,
Wrocław
Jan
Mergentaler , Jerzy Jakimiec
Zbigniew
Kordylewski
Barbara & Janusz Sylwester
Marek Siarkowski
Using this
spectrometer it was possible to measure resonance lines of Mg XI (He-like) and
Mg XII (H-like) ions, for the first time resolved using the same crystal. This
spectrum is displayed in Fig. 2b. Using so-called filter ratio technique into the
analysis of images obtained with Be and Al filters it was possible to determine
the thermal structure of (then called) ‘coronal condensation’ /7/. Following
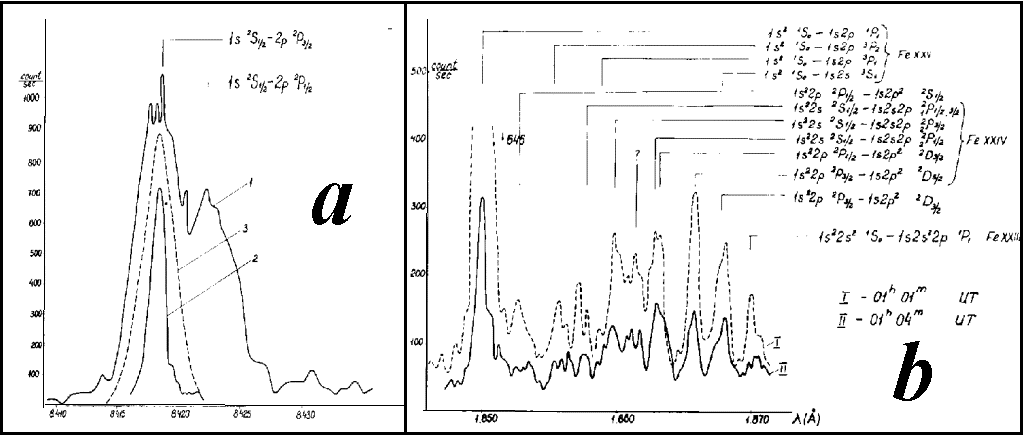
safe descent on the parachute, the package flew again (Vertical-2), this time
containing additional Bragg Quartz spectrometer. This spectrometer was aimed to
measure spectra in a narrow spectral band in vicinity of the Mg XII Lyα
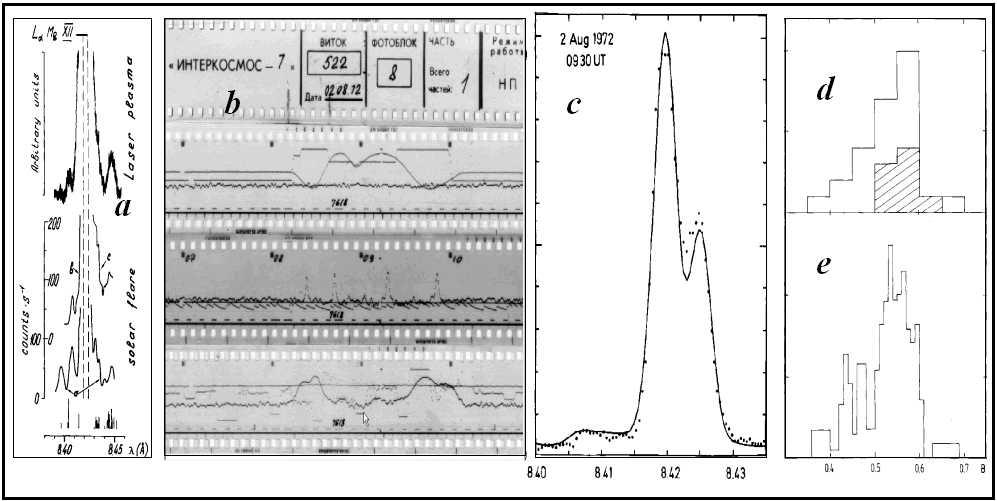
spin doublet. Example spectrum is shown in Fig. 3a. Using this spectrometer, it
was, possible to resolve the individual components of that doublet for the
first time. It was found that the widths of the components were larger than
expected, indicating for significant role of the plasma turbulence. Derived
velocities were rather high (~ 100 km/s).
Following the
‘proof of the concept’ rocket flights, a satellite Bragg spectrometers
constructed at FIAN have been launched aboard the INTERCOSMOS‑4 (IK-4)
satellite. Those spectra were of outstanding spectral resolution and revealed
for the first time complicated line structures around the He-like resonance of
Fe XXV ion (Fig. 3a).
Fig. 3.Panel
(a): Profile of the resonance 8.42 Å Mg XII Lyα spin doublet
measured on 20 August 1971 during the flight of Vertical-2 sounding rocket. The
spectrum corresponds to quiet Sun conditions. Individual lines denote: 1-
measured line profile, 2 – scan through the source by X-ray heliograph (3
arcmin angular resolution),3 –
expected purely thermal line shape calculated for plasma at temperature T = 6
MK;Panel (b): Spectra of the solar
flare taken at two times (indicated) during rise of the 2B flare on 16 November
1970. These spectra were measured using quartz spectrometer aboard the
INTERCOSMOS-4 satellite.
Thanks to development (also at FIAN) of the quantum
mechanical theory for calculating energies and oscillator strengths of lines
forming in highly ionized species (so-called Z-expansion technique) /8/, it has
been possible to make identification of many of the observed lines. From the
analysis of appropriate line intensity ratios, it became obvious that flaring
plasma must contain regions with the temperature above 20 MK.
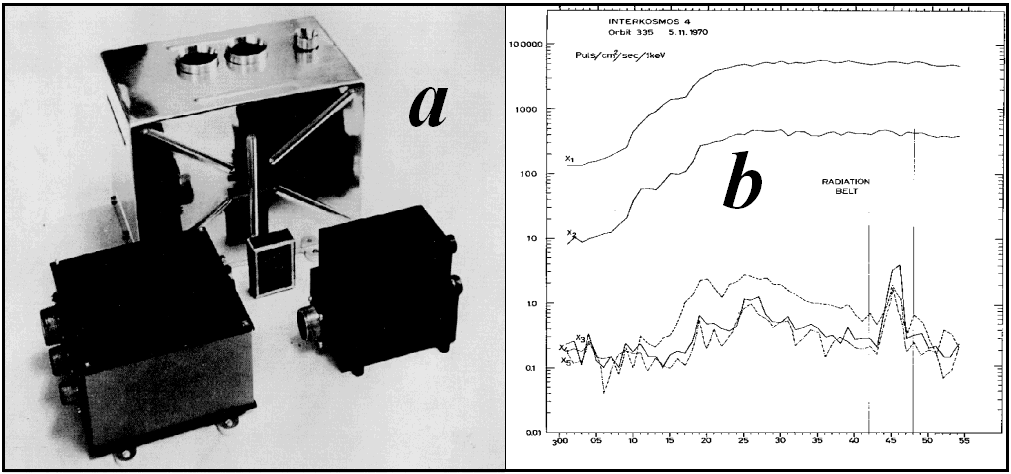
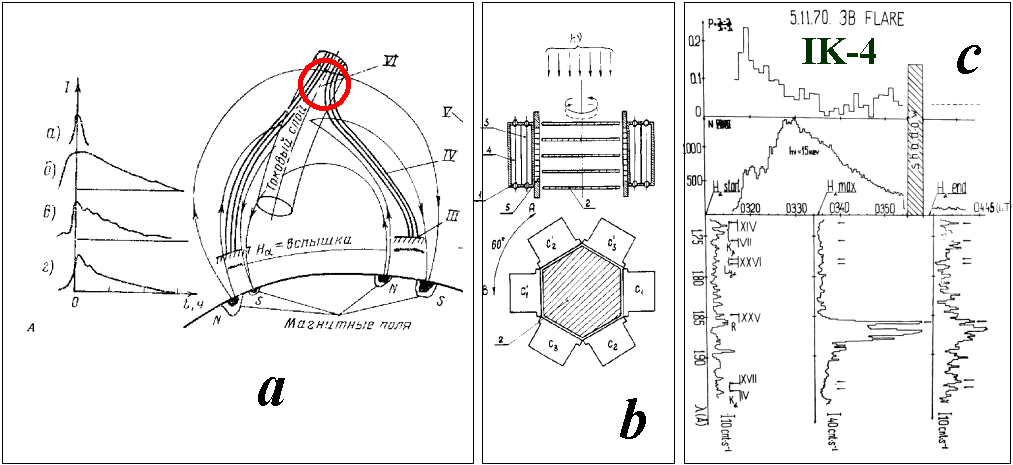
Fig. 4.Panel (a): IK-1 X-ray photometer set.
External detector block is at the back, electronic block left forefront and the
power unit at right forefront.Panel (b):
record of the X-ray emission from proton flare of 5 November 1970, obtained
using the IK-4 photometer (identical to that shown).
Besides the FIAN package, all IK satellites carried
the Czech X-ray broadband photometers and telemetry transmitter systems /9/.
The ground receiving station had also been constructed later in Ondrejov in
order to communicate with the IK satellites. During the IK-4 lifetime a number
of subflares have been recorded thanks to the high sensitivity of the
photometer. It may be a kind of interest that on 14 October 1970, the detectors
measured the signal during passes of the radioactive cloud related to Chinese
nuclear explosion. Czech photometers underwent continuous development and were
placed regularly on a series of PROGNOZ (PZ) elongated orbit satellites as well
as aboard Phobos and Vega interplanetary missions (see Table I). The analysis
of early PZ measurements led to the detection of presence of superhot plasma
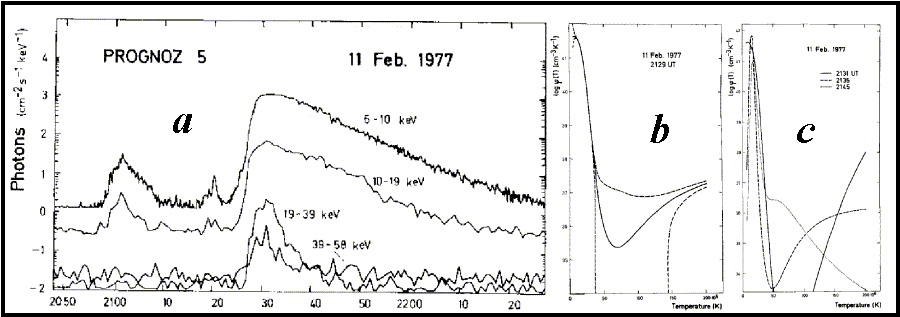
component during flares /10/. In Fig. 5a, we present the PZ-5 observations
of 11 February 1977 flare. Special kind of multitemperature analysis of these
measurements worked-out in Poland (so-called maximum likelihood differential
emission measure technique) allowed to investigate the evolution of superhot
component during the event. Itisseenthat duringtheflare rise phase smallamount of plasma is present
Fig. 5. Panel (a):
The time profiles of the hard X-ray fluxes related with the 1B flare observed
on the disc. On the horizontal axis the time in minutes is indicated.
Panel (b): Distribution of plasma with temperature (DEM) during the
rise phase (21:29 UT, thick line). Dashed lines indicate the error limits
resulting from the iterative DEM analysis method applied. Panel (c):
Evolution of DEM distribution with time. The full, dashed and dotted lines
correspond to 21:31 UT, 21:35 UT and 21:45 UT respectively.
While trying to combine the X-ray broadband PZ
measurements into a common photometry database, methods for precise cross-calibration of
the broad-band energy ranges for a number of experiments (including Western
ones) have been worked out /11/.By
means of interpretation of the so-called density-temperature diagnostic
diagrams /12/ it was possible to derive the geometry (length and cross-section)
of flaring magnetically confined plasma loops.
Fig. 6.
Panel
(a): A cartoon showing the concept of flare mechanism worked out by Syrovatski.
The energy release is due to magnetic filed reconnection in the so-called X
point, at the top of flaring loop-like structure (circled). Panel (b): A scheme
showing the concept of broadband polarimeter. The Hard X-ray radiation is
scattered by beryllium plates and measured by six identical places in the
perpendicular plane. Ratios of the signal measured in the three (opposite)
pairs of detectors depend on the polarization level of the incoming radiation.
Panel (c): upper plot – time variation of the polarization level, middle – time
variation of the total X-ray flux around 15 keV, three lower vertical plots –
spectra in the range covering Fe XXVI Lyα (λ = 1.78 Å) and Fe
XXV resonance and satellite lines(λ = 1.8 ÷1.9 Å).
Another important direction of solar X-ray
investigations has been related to detection and interpretation of polarization
in the continuum and line emission. Detection of substantial polarization would
provide a strong argument in favour of the presence of intense, well-collimated
beams of accelerated particles interacting with ambient plasma. Presence of
such beams directly follows from the model of flare energy release process
worked-out by late Professor Syrovatski (FIAN) /13/ and developed later on by Somov
/14/. Syrovatski energy release mechanism by reconnection process is still
among the most important concepts of flare physics. A scheme of the model is
shown in Fig. 6a. It is suggested in the model, that plasma carrying
oppositely directed field lines collide in the corona, creating so-called
X-point. In the centre of this X-point, conditions are the most favourable for
reconnection of oppositely directed magnetic field lines. Reconnection process
causes a large number of electrons to be accelerated. These electrons propagate
anisotropically along the magnetic field lines towards the photosphere. Here
they are stopped producing (polarized) radiation in the bremsstrahlung process.
In this model the level of polarization is expected to be high – up to several
percent. The detection of polarization would be a good proof of the nonthermal
nature of the X-ray emission in flares.
The first observational attempts to detect polarized
X-ray emission were undertaken by Tindo /15/ using the polarimeter, in which
the radiation is scattered by beryllium plates (Fig. 6b). The incident
radiation is Thomson-scattered and registered by detectors. Provided that it is
polarized, the signal in three detector pairs differs and can be interpreted in
terms of degree of polarization (as is shown in Fig. 6c).
Such an interpretation revealed that for three flares
observed with IK-1 in October 1969, the polarization level was 0.4 ± 0.2.
Observations obtained from IK-4 show that the polarization level is the largest
during the impulsive phase and decreases in time (cf. Fig. 6c). It was
also possible to determine the orientation of the polarization plane for the
first time. The polarization planes orientation (along the line towards disc
centre) indicates that the beam of accelerated electrons propagates along the
magnetic field lines as indicated in Fig. 6a.
X-RAY SPECTROSCOPY AND DIAGNOSTICS OF CORONAL PLASMA
Fig. 7.Panel (a):
Satellite spectra in the vicinity of MgXII resonance line(see /16/ for details). Panel (b):
Example of the IK-7 recordings made on the photographic film. Upper plot – data
from the optical aspect sensor (double sine wave indicates the motion of the
satellite axis relative to the centre of the optical solar disc); middle – data
from the slit high-resolution collimator, allowing for precise assignment of
scanning velocity; lower – actual Mg XII spectra records in semi-logarithmic
scale. Panel (c): Example of reformatted spectrum of the Lyα spin
doublet (dotted). The short and long wavelength line components corresponds to
transitions in the Mg hydrogen-like ion. The thick line represents best
theoretical fit. Panel (d, e): histograms of observed B ratios for a
sample of 26 spectra. The mean value of B is 0.53. The hatched area on the
upper histogram shows the distribution of B-values for a group of spectra
recorded during decay phases of two large flares. The lower histogram is the
‘weighted’ distribution of the full sample (see /18/ for details).
and low density ne < 1012 cm-3. The X-ray and EUV spectra formed in such condition
are usually optically thin. They contain hundreds of lines corresponding to
resonance, intercombination, forbidden and satellite transitions of heavier
ions abundant in the plasma. Bragg crystal spectrometers placed on
V-8, -9, -11, IK-7 and IK-11 allowed for systematic studies of
physical conditions of the active region and flaring plasma thanks to the
exceptional resolution of the spectrometers used. Among the most interesting
results came from the analysis of Mg XII spin doublet collected aboard IK-4 and
IK-7.
In Fig. 7a, we present the comparison of spectra
in vicinity of Mg XII Lyα line as measured in the laboratory (FIAN plasma
focus) and from the solar flare (IK-4). Thanks to the comparative analysis of
these spectra it was possible for the first time to identify so-called
short-wavelength satellite lines /16/.In Fig. 7b, we present example of the original data recordings (on
photographic film) which have been carefully hand-processed in Poland. Analysis
of hundreds of such reformatted spectra allowed to make statistical studies of
the ratio B of intensities of the
spin doublet line components (B = I{2S1/2 – 2P1/2}/I{2S1/2 –
2P3/2}). The analysis revealed that in numerous cases B ratio departs significantly from
predicted by the atomic theory value of ½. These effects have been
attributed to the scattering of radiation within the source. Appropriate theory
has been developed in co-operation with Professor McWhirter group from
Rutherford-Appleton Laboratory in UK /17/, /18/.
Another interesting aspect of flare spectroscopic
studies was the determination of flaring plasma radial velocities. From
numerical hydrodynamic modelling of flare performed by several groups
(including FIAN /19/) it follows, that substantial flows are expected as the
accelerated electrons deposit their energy within the denser chromospheric
layers causing so-called evaporation process. Taking the results of this
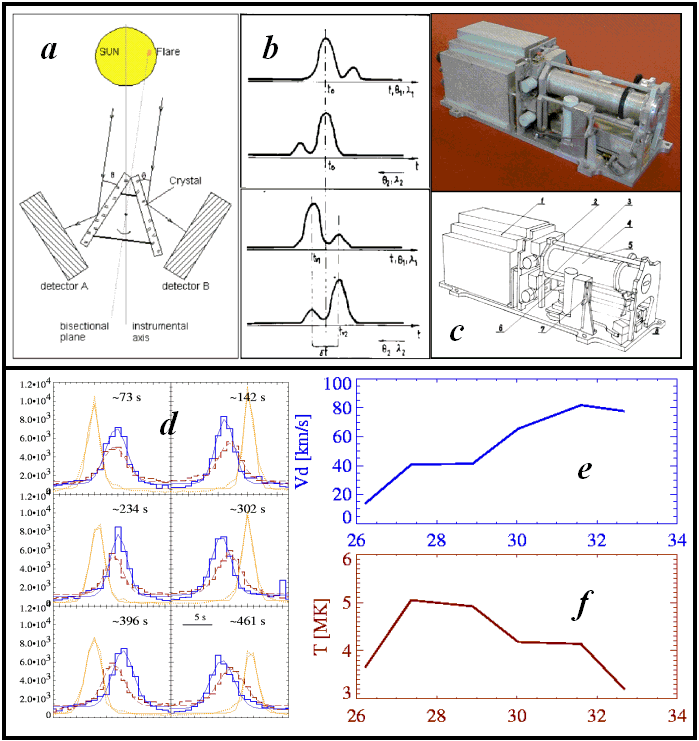
modelling into consideration, the Wrocław group developed a novel kind of Bragg
spectrometer. It was designed to measure precisely radial motions of hot flare
plasma from Doppler shifts of strong X-ray emission lines. This spectrometer
has been called X-ray Dopplerometer (XRD). A scheme of the Dopplerometer
section and the corresponding expected spectral recordings are shown in
Fig. 8a and 8b respectively. The section consists of the two
crystals fixed mechanically on the common shaft at the exact angle (twice
Bragg) corresponding to the rest wavelength of a strong emission line. By
rotating the crystal section, the X-ray spectra are recorded using appropriate
detectors. The scanning takes place in the opposite directions for each of the
crystals in the couple.
Such arrangement of the crystals allows for precise
determination of possible line Doppler shifts.For the source plasma being at rest, the line maxima would be recorded
at the same wavelength (i.e. same instant during the scan). Any radial motions
of hot flare plasma will cause that the maximaofthe lines willbeslightly shifted in time. This
Fig. 8.Panel (a):A scheme of the Dopplerometer. The Bragg
crystals are mounted on a common shaft with the crystal planes aligned exactly
at the angle corresponding to the strong X-ray emission line. Panel (b):
upper section – a scheme of spectral pattern to be recorded by the
Dopplerometer in case of the source plasma being at rest. Note that the
scanning is performed in the opposite wavelength senses; lower section –
spectral pattern for the source moving towards the observer – spectral line
maxima are recorded at different times. Panel (c): The overall view of the
Dopplerometer launched aboard V-11 sounding rocket /24/. Panel (d): Six simultaneous
Mg XI line profiles (thick forward, broken backward). They were recorded
around 73, 142, 234, 302, 396 and 461 s during the flight on 20 October
1983. Spectra have been obtained using ADP crystal
(2d = 10.64 Å). It is seen that the spectral line
separation increases with time. Dotted line represents reference profile of the
source brightness as recorded using 10~arcsec slit collimator. Vertical axis
represents count rates and horizontal time in seconds. Panel (e, f):
Time variations of the Doppler plasma velocity and temperature determined from
the rocket Dopplerometer spectra presented in (d). Velocities have been derived
from the line shifts while the temperatures from dielectronic satellite
(Mg X, n =3) to resonance (Mg XI) line ratios.
time shift is proportional to the value of radial
component of source plasma velocity.The effect is independent of the position of the source (flare) on the
disc and/or the relative pointing of the spectrometer.
Fig. 9.Panel (a):
A fit of the Z-expansion theoretical calculations to the summed IK-16 spectrum
of Mg X and Mg XI ions in the 9.14 Å - 9.33 Å
region. Panel (b): So-called R ‑ G diagram allowing for
reliable determination of plasma density close to the low-density limit. Points
represent observed values and inclined lines are drawn for various plasma
densities. Panel (c): Dependence of average plasma density on the mean
temperature for plasma in active region McMath 14352. The temperatures and
densities were derived based on R – G diagrams displayed in Panel
(b).
The accuracy of the velocity determination is expected
to be very good, down to few km/s. In Fig. 8e we present the radial
velocities of flaring plasma, resulting from line Doppler shifts recorded
during the V‑11 flight. An increase of velocity by ~ 60 km/s has
been noticed in the Mg XI line (T ~ 5 MK). The Dopplerometer is
included into Diogeness instrument, which will be flown again aboard CORONAS‑F.
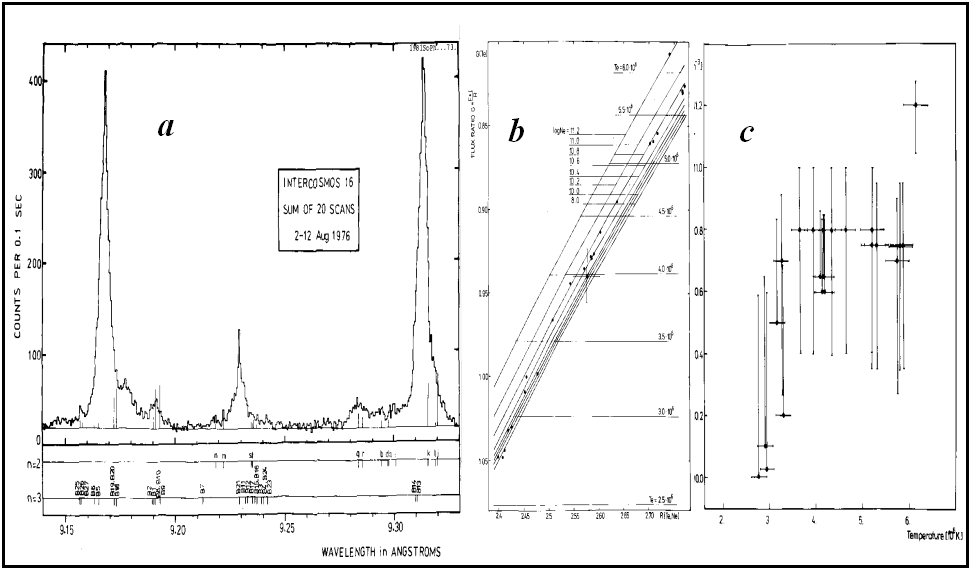
Abundant set of unique X-ray spectra has been
collected from high-resolution Bragg spectrometer placed aboard the IK-16. This
spectrometer has been set to investigate the spectra in the vicinity of
Mg XI so-called triplet lines /20/. In Fig. 9a, we present
an example spectrum. By means of comparing results of advanced FIAN atomic
physics calculation it was possible to identify a number of spectral features
seen, mostly those attributed to higher-n satellite lines. Analysis of selected
line emission allowed to determine the equivalent plasma temperatures and
dependence of this temperature variations with flare index /21/. For some
spectra, it was not possible to fit satisfactory the synthetic profiles under
assumption of thermal distribution of exciters. However it was possible to
account for these discrepancies by assuming that a small population of
non-thermal electrons is present within active region plasma /22/. The
analysis of relative intensities of triplet line ratios /23/ allowed for the
same time to determine plasma densities from G-ratio value, for the first time
for as heavy element as Mg (see Fig. 9b). A trend has been found (for the
first time) relating average density of active region plasma and temperature
(Fig. 9c). In summary, the Bragg spectroscopy of solar sources done within
the INTERCOSMOS programme led to substantial progress in this research area and
stimulated development of appropriate atomic physic of highly ionized, high-Z
elements.
X AND EUV IMAGING
Another experimental area covered by INTERCOSMOS programme
was imaging of the Sun in short wavelengths. The first attempts to obtain
two-dimensional information on the distribution of X-ray emission on the disc
has been made by on Coronas‑166 and –230 satellites using slit
heliographs. Later on the pinhole concept (discussed earlier) had evolved.
Following the pinhole technique, a substantial progress has been achieved in
construction of grazing incidence optics, mostly at the Astronomical Institute
in Ondrejov /25/. Starting from V‑8 payload, the Volter type I
telescopes, developed jointly between Ondrejov and Wrocław, have been regularly
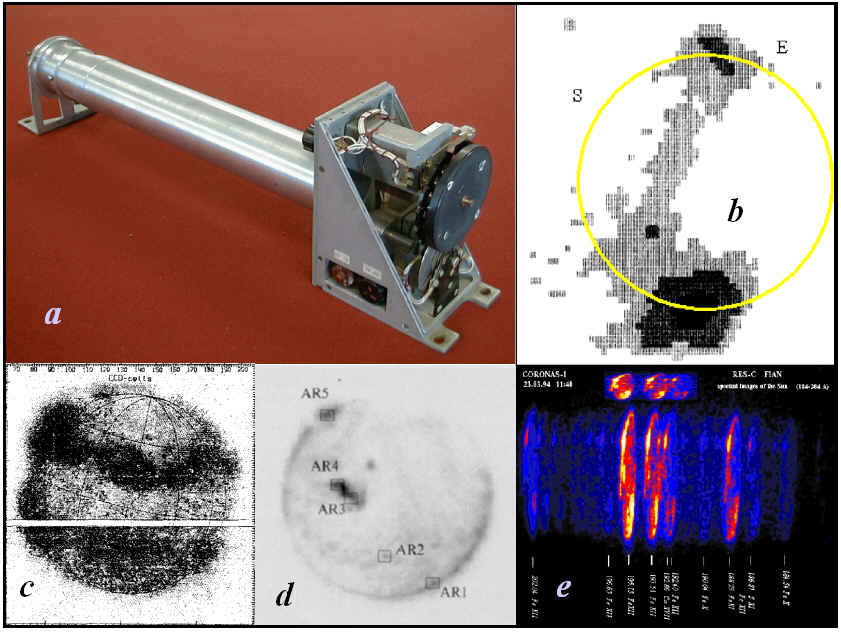
placed aboard Vertical sounding rockets. In Fig. 10a, we present a photo
of the telescope, with the filter wheel, shutter and film holder exposed. In
Fig. 10b, an example image of the solar corona obtained during V‑11
flight is shown. Following the era of X-ray telescopes the normal incidence
telescopes EUV imaging techniques had been evolving at FIAN. This led to first
flight of TEREK complex /26/ aboard the Phobos interplanetary mission. An
example of the EUV solar image obtained from TEREK is shown in Fig. 10c.
The following flight of TEREK complex aboard CORONAS-I brought a higher
resolution images of the (Fig. 10d). In parallel, the grazing incidence
diffraction techniques had been evolved at FIAN. Using these techniques, it was
possible to image active corona in EUV lines /27/ superior to that achieved
during Skylab Mission.
The launch of CORONAS-I (PI, Academician
V.N. Oraevsky) in 1994 and INTERBALL-Tail (PI, Academician
A.A. Galeev)projectsin 1995, were the direct continuation of the
INTERCOSMOS research collaboration. Aboard
Fig. 10.Panel (a):
The photo of Czech-Polish X-ray Telescope RTF flown on V-8, -9, -11.
Panel (b): RTF image of the Sun obtained on 20 October 1983 from V-11.
Panel (c): The X-ray heliogram obtained from Phobos interplanetary station
on 26 August 1988 at 01:49 UT in the 170 – 180 Å XUV band.
Panel (d): The image of the Sun in the 170 – 180 Å range as obtained
by CORONAS-I TEREK on 1994 July 2 at 12:57 UT. The five active regions analysed
in /27/ are indicated. Panel (e): The spectroheliogram obtained by the
RES-C diffraction grating imager aboard CORONAS-I on 1994 July 2 at
10:09 UT /27/. A special optical arrangement allowed to obtain solar
images in separate lines not overlapping like in the case of SKYLAB NRL
spectroheliograph.
these missions a number of solar experiments were set-up. Most of the X-ray spectrometers, photometers and imagers were up-date
or derivative versions of predecessors, flown within the Programme. It is
beyond the scope of present review to go into details with the description of
results from these Missions. The reader may find these information on www pages
(CORONAS-I: http://www.izmiran.rssi.ru/projects/CORONAS/I/;INTERBALL-Tail: http://www.iki.rssi.ru/interball.html
and http://www.cbk.pan.wroc.pl/rf15-i_www/
CONCLUSIONS
The present review stresses many of the most important
research work in space solar physics carried-out with a large success within
the INTERCOSMOS programme over its existence. In areas such as X-ray
spectroscopy, imaging, development of atomic theory and interpretation, the
studies performed contributed substantially to the scientific progress. The
achievements both in the instrument construction, theoretical atomic physics
calculations and progress in understanding of flare physics stimulated many
Western groups to initiate or continue the research in X-ray spectroscopy.
These inspiration resulted in several launches including P78-2 (USA, 1979), SMM
(NASA, 1980) with Flat Crystal Spectrometer and Bent Crystal Spectrometer,
Hinotori (Japan, 1981), Yohkoh (Japan, 1991) with Bragg Crystal Spectrometer
and now RESIK (Poland + Russia + USA + UK) aboard CORONAS‑F. The
co-operation between the groups, initiated thanks to INTERCOSMOS programme,
continues to exist, at least on Polish Russian and Polish Czech directions.
We are sure that future evolution of this co-operation will bring another major
discoveries, especially after launch of the CORONAS-F Mission led by IZMIRAN
under the guidance of Academician V.N. Oraevsky.
ACKNOWLEDGEMENTS
The author would like to thank the INTERCOSMOS
organization for creating opportunities for co-operation and made possible to
prosper the programme of solar research from space.Without this programme it would not be possible to initiate solar
space research in Poland.
This work was possible partly due to grant Organisation of Magnetic Fields in the
Corona 2.P03D.024.17 of Polish Committee for Scientific Research.
REFERENCES
1.Mandelstam S.L., VasilevB., Voronko V. , et al.,Measurements
of solar X-ray radiation, 1976, Space Res., Vol. 3,822 835.
2.Mandelstam S.L.,Prokudina V.S., Tindo, I., Fetisov, E. P., On the X-ray emission of quiet Sun,
1965, Cosmic Research, Vol. 3, No. 5,737 750. (in Russian)
3.Zhitnik, I.A., Krutov, V.V, Maliavkin,
L.P.,The X-ray photographs and the spectrum of the Sun in the region 9.5
200 Å, Space Res., 1967, Vol. 7,1263 1280.
4.Beigman, I.L., Grineva, Yu.I.,
Mandel’stam, S.L., 1969, On the
localization, size, and structure of the region of the X-ray flares on the Sun,
Solar Phys., Vol 9, 160-165.
5.Ivanov, V., Letfus, V., Mandelstam,
S.L., Tindo I.P., 1971, Non-flare solar
X-ray emission shorter than 3 Å, Space Res.,Vol. 11, 1355 1358.
7.Kordylewski, Z., Mergentaler, J.,
Jakimiec, J., Sylwester, B., Sylwester, J., 1973, Observations oftheX-rayEmissionoftheSolarActive Regions on 28-th
November 1970and20-thAugust1979, Space Res.,
Vol. 3,787 792
8.Vainshtein, L. A.,
Safronova, U. I., 1980, Dielectronic
Satellite Spectra for Highly Charged H-Ions and He-like Ions with Z=6-33,Atomic Data and Nuclear Data Tables, Vol.
25, 311 - 385
9.Valnícek, B., Fárnik, F.,
Horn, J., Letfus, V., Sudová, J., Komárek, B., Engelthaler, P.,
Ulrych, J., Moucka, L., Fronka, O., Vasek, T.,
Beránek, I., Plch, J., Zderadicka, J., Measurements of the Flux of the Solar X-Rays from the Satellites
Interkosmos 1, 4, 7, 1973, Bulletin of the Astronomical Institute of
Czechoslovakia, Vol. 24, 362
10.Sylwester, B.,
Sylwester, J., Jakimiec, J., Valnicek, B., Farnik, F.,
1983, Multi-temperature analysis of hard
X-ray spectra measured aboard the Prognoz 5 satellite, Bulletin of the
Astronomical Institute of Czechoslovakia, Vol. 34, 40
11.Farnik, F., Valnicek, B.,
Sylwester, B., Sylwester, J., Jakimiec, J., 1984, Comparison of energy calibration of Prognoz
5, 6, 7, and 8 and other hard-X-ray solar photometers, Bulletin of the
Astronomical Institute of Czechoslovakia, vol. 35, 158-163.
12.Jakimiec, J., Sylwester, B.,
Sylwester, J., Mewe, R., Peres, G., 1986, Investigation of flare heating based on X-ray observations,
Advances in Space Research, Vol. 6, 237-240
13.Syrovatskij, S.I., Key problems in the theory of flares,
1979, Bull. Acad. Sci. USSR, Phys. Series, Vol. 43(4), 17-27
14.Somov, B.V., 1992, Physical Processes in Solar Flares,
Kluwer, The Netherlands.
15.Tindo, I. P.,
Ivanov, V. D., Mandel'stam, S. L.,
Shuryghin, A. I., 1970, On the
Polarization of the Emission of X-ray Solar Flares, Solar Physics, Vol.
14,204 - 207.
16.Aglitskii, E. V.,
Boiko, V. A., Faenov, A. Ia., Korneev, V. V.,
Krutov, V. V., Mandelstam, S. L., Pikuz, S. A.,
Safronova, U. I., Urnov, A. M., Sylwester, J., New satellite structure of the solar and
laser plasma spectra in vicinity of the Lyα Mg XII line, Solar
Physics, Vol. 56, 375-382
17.Jakimiec, J.,
Korneev, V. V., Krutov, V. V., Zhitnik, I. A.
Plocieniak, S., Sylwester, B., Sylwester, J., Analysis of the intensities and profiles of
the spectral line Mg XII 8.42 Å
in the solar X-ray spectrum, 1975, Solar Physics, Vol. 44, 391- 401
18.Sylwester, B., Faucher, P.,
Jakimiec, J., Krutov, V. V., Korneev, V.V.,
McWhirter, R. W. P., Sylwester, J., Tomczak, M., Volonte, S.,
Zhitnik, I.A., Investigation of the Mg
XII 8.42 Å doublet in solar
flare spectra, 1986, Solar Physics, Vol. 103, 67-87
19.Spector, A., 1979, Numerical modelling of optically thin plasma
under impulsive heating due to power low electron beams, Trudy Akademii
Nauk USSR, Vol 110, 95 – 105. (in Russian)
20.Krutov, V. V.,
Korneev, V. V., Karev, U. I., Lomkova, V. M.,
Oparin, S. N., Urnov, A. M., Zhitnik, I. A.,
Bromboszcz, G., Siarkowski, M., Sylwester, J., Analysis of the high-resolution X-ray
spectra obtained aboard the Intercosmos 16 satellite. I - Identification of the
lines in the 9.14-9.33 Å spectral region, 1981, Solar Physics, Vol.
73, 105-119
21.Siarkowski, M.,
Sylwester, J., Bromboszcz, G., Korneev, V. V.,
Mandels’tam, S. L., Oparin, S. N., Urnov, A. M.,
Zhitnik, I. A., Vasha, S., Analysis
of the high resolution MG XI X-ray spectra. II - Physical parameters of the
plasma in active region McMath 14352, 1982, Solar Physics, Vol. 77, 183-203
22.Siarkowski, M.,
Sylwester, J., Bromboszcs, G., Korneev, V. V.,
Mandels’tam, S. L., Oparin, S. N., Urnov, A. M.,
Zhitnik, I. A., Analysis of the
high resolution Mg XI X-ray spectra. III - Non-thermal interpretation of some
spectra, 1982, Solar Physics, Vol. 81, 63-68
23.Bromboszcz, G.,
Siarkowski, M., Sylwester, J., Korneev, V. V.,
Mandels’tam, S. L., Oparin, S. N., Urnov, A. M.,
Zhitnik, I. A., Analysis of the
high-resolution MG XI X-ray spectra. IV Derivation of the plasma densities to
the 'low-density' limit, 1983, Solar Physics, Vol. 83, 243-255
24.Sylwester, J., Experience of Wrocław team in construction of solar X-ray instruments,
2001, ESA-SP 493, in print
25.Hudec, R., Valnicek, B., Hudcova, V.,
Sylwester, J., Kordylewski Z., X-ray
pictures of the Sun taken from Vertical‑8, 1984, Bulletin
Astronomical Institute ofCzechoslovakAcademyofSciences, Vol 35, 153
26.Sobel’man, I.I., Zhitnik, I.A.,
Valnicek, B., and 26 co-authors, Images
of the Sun obtained with the TEREK on the spacecraft Phobos‑1, 1990,
Sov. Astron. Lett., Vol. 16(2), 137 – 140
27.Zhitnik, I. A.,
Kuzin, S. V., Urnov, A. M., Keenan, F. P.,
Pinfield, D. J., Fe XII
emission lines in solar active regions observed by the RES-C spectroheliograph
on the CORONAS-I mission, Mont. Not. R. Astron. Soc., Vol. 308, 228 - 232