Figure 1: The comparison of the emission pattern as seen on the first available unsaturated original and deconvolved Be119 image (03:21:57 UT). The size of original image is 18×18 SXT pixels which correspods to 90×90 subpixels after the deconvolution.
In our present research we have used the deconvolved SXT flare images. The deconvolution is performed using Wroclaw maximum likelihood ANDRIL algorithm. The algorithm removes numerically the image blurring due to the instrument point spread function and increases the spatial resolution down to ~ 1 arcsec. The determination of physical conditions within flaring region is a delicate matter as the analysis is very sensitive to the accurate coalignment between the image pair used. As we have used the deconvolved Al12 and Be119 SXT images, the coalignment problem is of basic importance. The standard procedures of image coalignment from Yohkoh spacecraft attitude sensors are not accurate enough in this respect. Therefore we have applied a special method of fine image coalignment (so-called limb position adjustment, LPA), which is based on the concept of using the edge of occulting disc as a reference in a sequence of SXT images (Sylwester & Sylwester, 2001). The coalignment precision with this method is of the order of 0.1 arcsec which allowed us to make the maps of distribution of physical plasma parameters for unobscured fine flaring structures (kernels) with high credibility (higher than was possible using the procedures included in SXT_PREP package).
The deconvolved Al12 and Be119 images coaligned using LPA have been used to determine the temperature (T) and emission measure (EM) maps of the flaring unocculted region. The isothermal approximation has been adopted and filter ratio technique has been used in deriving the parameters in individual subpixels. Also the distributions of so-called "quasi" differential emission measure (QDEM) for the sequence of images have been constructed based on these results. The QDEM histogram has been obtained as follows:
We have also incorporated into the analysis the MEM reconstructed hard X-ray images as recorded by HXT on Yohkoh for the sake of comparison between soft and hard X-ray flare emission patterns. The relative soft and hard X-ray maximum brightness locations and their displacements have been investigated quantitatively.
We have analysed several limb occulted flares. As an illustration the results for selected flare observed at the Western limb on 24 March 1993 at ~ 03:25 UT are presented. This flare was of moderate duration (about 40 min) but the Yohkoh observations cover 10 min only. Although the event has not been very intense in GOES scale (classified as C6.6) the fluxes observed using HXT M1 channel were much above the noise level with many spikes present. In Fig. 1 one can compare the emission pattern as seen on the original and deconvolved Be119 image. The privilege of using deconvolved images is clearly seen as many fine structures not resolved on the original image are evident after the deconvolution. On the deconvolved SXT images the flare resembles a stable cusp-like structure with one foot/leg dominating throughout the Yohkoh observing period (rise, maximum and early decay phase).
Figure 2: The composite of Be119 SXT deconvolved images (top row) and corresponding in time MEM reconstructed LO HXT images (middle row) for three moments during the rise of 24 March 1993. The soft (GOES) and hard (LO and M1 HXT) X-ray lightcurves are displayed in the bottom row. The hatched areas denote time intervals when the HXT fluxes have been integrated in order to reconstruct the images displayed in the middle row.
In Fig. 2 the composite of soft and hard X-ray emissivity pattern for three times during the rise phase together with the soft and hard X-ray lightcurves are displayed. This event is somewhat unusual as the location of the kernel changed only slightly during its evolution. In Fig. 3 the evolution of maximum brightness location presented as contours drawn at 0.8 of maximum intensity for consecutive frames of Be119 deconvolved images is shown. The contours are overlaid atop the emission pattern (in gray) of the first unsaturated SXT image within the flaring sequence. Only a small displacement of maximum brightness location (footpoint kernel) is observed during 10 minutes of flare evolution. The similar small displacement is observed on Al12 and Al01 SXT images. Usually the location of flare kernels evidently changes as the flare evolves which was shown in our previous papers (Sylwester & Sylwester, 1999a, Sylwester & Sylwester, 1999b, Sylwester & Sylwester, 2001). However it should be noted that the kernel analysed in present contribution is located at the footpoint region while the previous analysis dealt mainly with top located kernels.
Figure 3: The evolution of maximum brightness location (contours drawn at 0.8 of maximum intensity) for consecutive frames of Be119 deconvolved images. The contours are overlaid atop the emission pattern (in grey) of the first unsaturated Be119
image.
In Fig. 4 the distributions of main thermodynamic parameters for three moments (respective columns) during flare rise phase for the total region (upper panel) and the extracted intense foot area (lower panel) are presented. The filter ratio temperature and emission measure are presented in grey scale in the first and second rows respectively. The thin white line delimits the common statistically significant region for Al12 and Be119 images where there is above 30 DN/subpixel (750 DN/pixel). The dimension of individual image is (30x30) arcsec and (15x15) arcsec for upper and lower panel respectively. The bottom row in each panel shows corresponding "quasi" differential emission measure distributions. The vertical dashed lines indicate the average temperature given also above the plots. It is seen that the bulk of plasma has the "typical" temperatures around 10 MK. (It should be noted that using Al12 and Be119 filters the plasma with temperatures higher than 5 MK can be probed only.) What is interesting is the existence of significant amount of plasma with temperatures above 20 MK during the soft X-ray rise phase, just after the main hard X-ray emission evenesced. This plasma may correspond to the so-called superhot plasma component identified from spectroscopic measurements. High-temperature tails in the QDEM distributions are no longer observed after the hard X-ray emission substantially decreases (around soft X-ray flare maximum and during soft X-ray decay phase).
From spatial dimensions and the total EM it is possible to estimate the corresponding averaged densities in volumes constituting the most of soft X-ray flux. For the intense foot point kernel they are: 1.0 ×10¹¹, 2.2 ×10¹¹ and 4.0 ×1011 cm-3 respectively. Evidently the densities obtained are above 1011 cm-3 during most of flare evolution. (Only for the few initial frames available during the rise phase the density is below 1011 cm-3 threshold.)
Figure 4: The distribution of main thermodynamic parameters for three moments (respective columns) during the rise phase of GOES light curve for the total region (top panel) and the intense foot area extracted
(bottom panel).
We have also compared the relative locations of the soft and hard X-ray plasma sources. It is illustrated in Fig. 5 where the comparison of SXT and HXT emission patterns (based on deconvolved and MEM reconstructed images respectively) is shown, for two moments during the flare rise phase separated in time by ~ 1 min. HXT contours are overlayed atop corresponding SXT Al12 deconvolved images. The solid line corresponds to LO channel emission while the dashed line relates to M1 channel emission. It is evident that the emission centers in soft and hard X-ray spectral bands are not cospatial. This was noted before for many other flares observed by Yohkoh. It is also apparent that the relative position of soft and hard X-ray emission centers changes considerably during presented 64 sec time period.
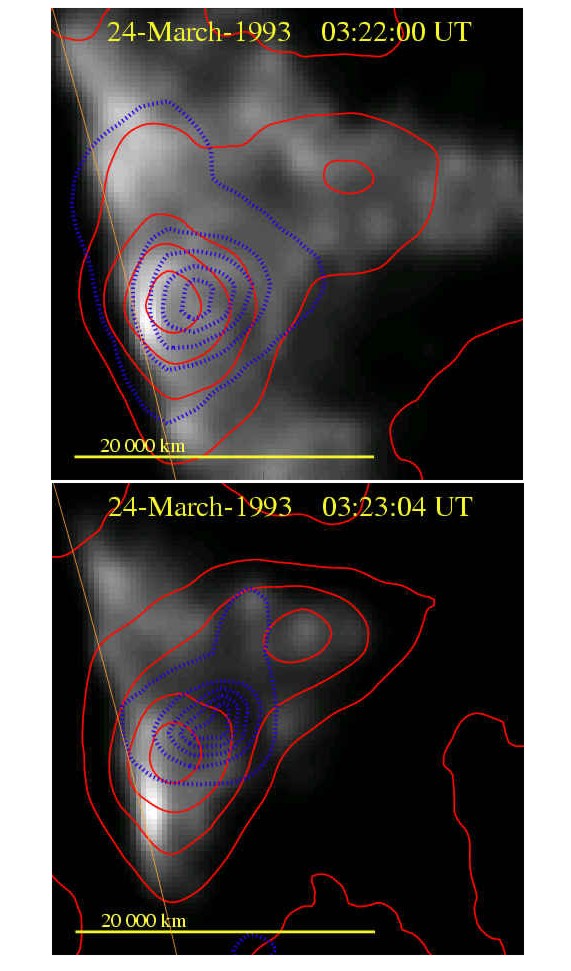
Figure 5: Comparison of soft (SXT Al12, grey scale) and hard (HXT LO, solid line and M1, dashed line) X-ray emission centers location for two moments during the rise
phase.
Based on the analysis of deconvolved SXT and MEM reconstructed HXT images for several limb occulted flares, the following conclusions have been drawn:
The results presented seem hard to be accommodated for in many of the proposed theoretical scenarios for the flare phenomenon. The one which can help in understanding the results presented here is the model of flare turbulent kernel discussed in the papers by Jakimiec et al. (1998) . According to this model, substantial part of energy release in the flare takes place in a bright coronal kernel with developed MHD turbulence. The energy release takes place in the relatively large volume of the kernel well into the decay phase of the flare due to magnetic reconnection within the turbulent region.
This work has been supported by the Grant 2.P03D.024.17 of Polish Committee for Scientific Research.