During almost a decade long period, SXT has observed a variety of solar X-ray events, which reveals large diversity in morphology, intensity, duration and size. According to the spatial scale, the sources seen in SXT data range from global structures extending over entire corona to relatively fine, well localised ones, such as X-ray bright points, emerging flux regions, compact flares, flare kernels and foot-point sources. Particularly, observations of small events puts us into a challenging situation. As such events are observed nearly at the limit of instrumental resolution, we can only speculate about their triggering mechanisms and underlying magnetic field morphology. On the other hand, investigation of small events contributes to research on important questions such as coronal heating or organisation of magnetic field in the solar atmosphere. Small, well-localised sources may be also investigated from purely instrumental point of view, to wit in determining unavoidable telescope blur in terms of point spread function (PSF).
SXT is a grazing-incidence mirror telescope which focuses X-ray images on a 1024x1024 CCD detector. Nominally SXT operates in the 0.25 to 4.0 keV energy range. A set of filters (each of them can be independently used to screen the CCD area) allows for acquiring solar images in slightly different energy bands, what makes the diagnostic of important solar plasma parameters possible. The SXT field-of-view is large enough to make images of the whole Sun but full frame images (FFI) are shrunken to lower size to save on telemetry and processing time at the cost of worsening resolution. The instrument electronics, however, can be set to read selected regions of the CCD only. These are called partial frame images (PFI). As PFIs come at the highest SXT resolution they are also the particularly useful for the studies of compact structures seen. A more detailed description of SXT, its capabilities and operational performance can be found in (Tsuneta et al., 1991 and Yohkoh Analysis Guide, 1994)
Four months before Yohkoh's lift-off the SXT instrument was calibrated at High Energy Laser System Test Facility at White Sands Missile Range (WSMR) in New Mexico. During the X-ray calibration tests SXT was lit up by a microfocus source in emission lines of carbon, aluminium and silver (Table I.) The spot size of the source, placed at a distance of 300 m away from the SXT, was about 2/3 arcsec (0.27 of the SXT pixel).
| Emission line | C-K | Al-K | Ag-L |
| Energy [keV] | 0.28 | 1.49 | 3.00 |
| Wavelength [Å] | 44.7 | 8.34 | 4.16 |
The tests were performed in order to check the SXT mirror parameters, fix focus position and collect material for determining telescope blur. The K line of aluminium was used in the majority of calibration test exposures in soft X-rays. It was also the characteristic emission line in which most of the focus fixings were done. The final (in-flight) position of the SXT CCD detector was set the 100 microns forward to the best focus position for the mirror on telescope axis. This was a compromise that allowed for improving uniformity of SXT angular resolution over the focal plane. A broad quantitative analysis of the White Sands SXT calibration data and derived (from them) fit to SXT point spread function can be found in (Martens, et al 1995).
The structures we looked for are of the size of several CCD pixels only. Therefore we decided to deal with the highest resolution SXT data i.e. PFI images. In early 2001, we sampled the SXT YDAC database at Mullard Space Science Laboratory (MSSL), Surrey, UK and performed several mock searches on the sample of about 10% of so called "spr" files in which PFI frames are stored. Our sample was uniformly spread in the period from Yohkoh launch to the beginning of 2001. We found above 47000 "spr" files in YDAC. Their total volume was about 45 GB. The preliminary searches were performed to optimise criteria, software and to fix effective strategy for compact structures detection in full resolution SXT data. We also estimated the frequency of use of SXT filters by sampling above 15000 spr files for particular years of the Yohkoh mission. The results are shown in Table II.
| Filter name | Al.1 | AlMg | Be119 | Al12 | Mg3 |
| Filter code | 2 | 3 | 4 | 5 | 6 |
| Percentage of use | 25.1 | 23.2 | 15.2 | 36.0 | 0.5 |
It appeared that in our filter test sample the most frequently used is the thick aluminium filter (Al12). There is also another reason why Al12 data have special meaning for our search purposes. Namely, the Al-K spectral line, in which the majority of the WSMR ground calibration X-ray tests (including extensive focus search tests) were performed, is placed very close to maximum of SXT effective area curve for Al12 filter. This allows for the most thorough comparison of in-flight data with ground test data. Hence, we decided to undertake the main searches for compact structures using Al12 images.
During the main searches we read successively full resolution images taken in Al12 filter and checked if they satisfied the following conditions:
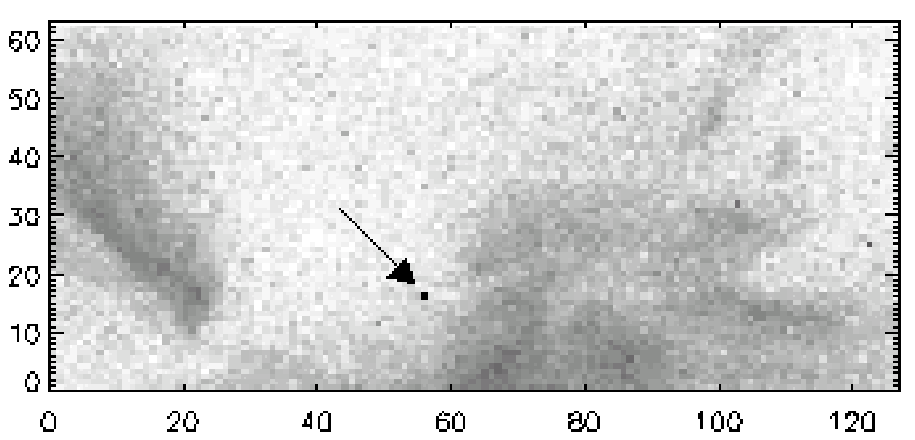
The choice of limiting surfaces for the compact structures during the main search phase was a matter of our special concern. Compact structures observed in X-rays may resemble very sharp peaks in SXT images. But they are not the sharpest objects that can be read-out in an image from CCD chip. The sharpest objects are large spikes in images caused, for instance, by extraordinary values of noise or when energetic particles hit the CCD at almost normal direction. An example of such spike is shown in the Figure 1. Hence, it was particularly important to work out a criterion to distinguish
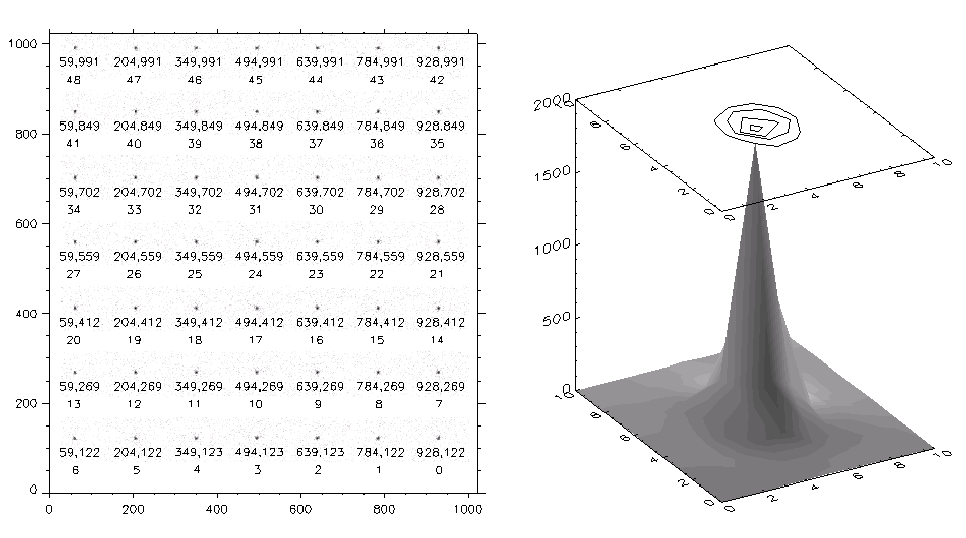
Figure 2:
The WSMR ground calibration images of bx02_apr23 series. Peak positions in Old Ground Based ÖGB" co-ordinate system (See Morrison, 1993 for SXT co-ordinate system description) and image serial number given below, label each image. To the right, shaded surface showing the central image peak (of serial number 24) in 10x10 pixel vicinity of its maximum value is shown.
observations of real compact structures from non-photon spiky image defects for the search purposes. We decided to solve this question by choosing an appropriate lower limiting surface for searched structures. In this respect we turned to the calibration results from WSMR. We first looked into SXT observations of microfocus X-ray source. From these observations we selected bx02_apr23 series taken in aluminium K line with the focus fixed in the flight position. During calibration the beam in bx02_apr23 illuminated the CCD area at positions shown in the Figure 2. The selected series consists of 48 images of very sharp peaks. Review of all these calibration images shows that beyond a 5 ×5 pixel sub-array of the image, centered at the peak positions, the signal reaches background level. Therefore as we constructed the lower limit surface from bx02_apr23 calibration images, we decided also to perform comparison of in-flight images with limiting surfaces only in the area of 5 ×5 pixel neighborhood of the maximum.
In order to derive lower limiting surface we took first the 5 ×5 pixel sub-arrays, centered at the peak, from all 48 images of the bx02_apr23 series. Then we scaled signal in sub-arrays to [0, 1] range. Next we took a 5 ×5 pixel array and set at each pixel its value to the minimal value we could found at respective pixel position in the whole set of 48 scaled sub-arrays of bx02_apr23 series. During the tests however it appeared that such lower limit is too restrictive and eliminates some of the compact flare kernels. We found out that this effect can be avoided by setting zero value on the lower limit surface edges. Actually we zeroed the edges. Although such limit surface acts effectively only on 3 ×3 square support it still allowed us for successful removal of spikes like the one in the Figure 1.
The upper limiting surface shape was not so critical for our searches. A test of compact flare kernels showed that it could be constructed using Moffat approximation of SXT PSF function. The Moffat function is given by the following formula
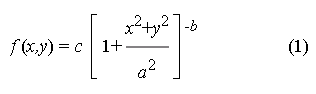
in which x, y are Cartesian plane co-ordinates, and a, b, c are parameters. The Moffat function defines a surface in in three-dimensional space with maximum value c and shape dependent on values of a and b parameters. An elliptical modification of Moffat function was used to fit SXT ground calibration data (Martens, 1995) Eventually, the upper limit surface was constructed as a peak portion of the digitised Moffat function with parameters a = 7.10, b = 1.66 and c set to unity (for normalisation purposes). Such choice of upper limit permitted us to effectively remove large extended structures yet allowing our test kernels of compact flares to pass. Both limit surfaces are shown in figure Figure 3.
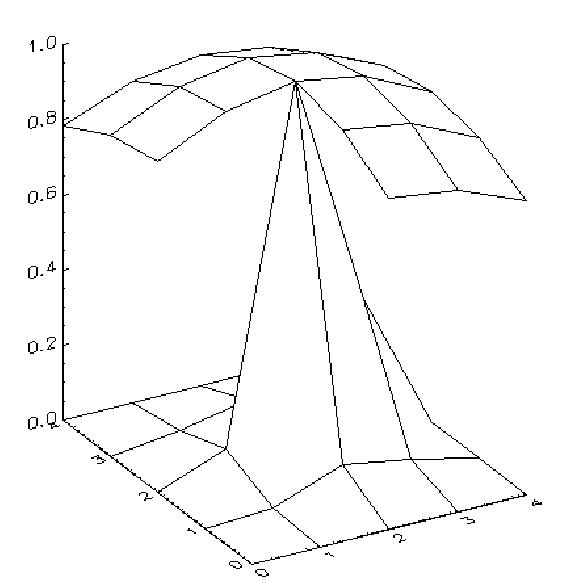
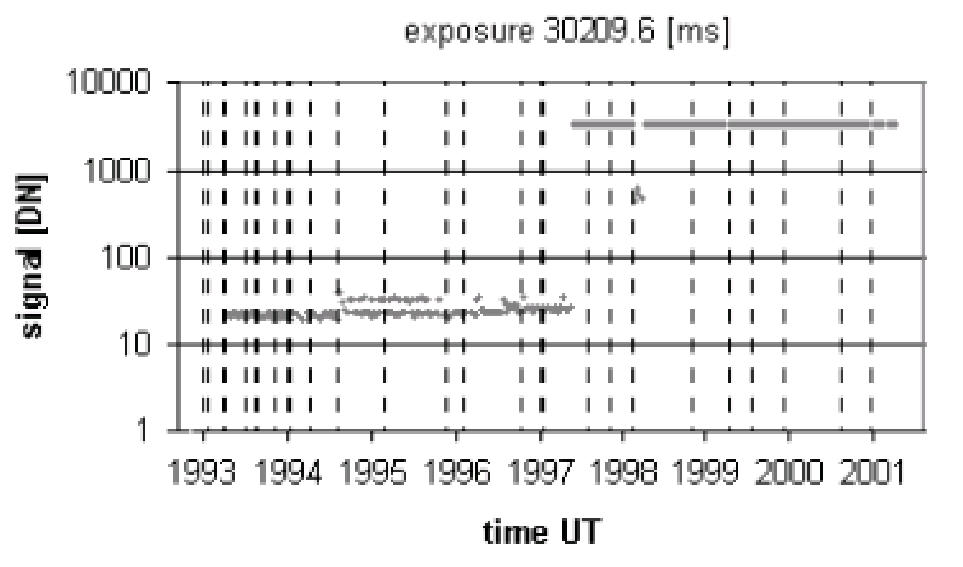
Figure 4: Atypical time behaviour of dark current pixel detected in SXT reference frames. In mid 1997 the pixel started to show saturation during 30 s exposures. Except the short period after beginning of 1998 it stays saturated. Dashed vertical lines mark periods when the CCD was heated to higher temperatures in order to remove contamination that may collect on its surface. The CCD co-ordinates of the discussed pixel are (308, 766).
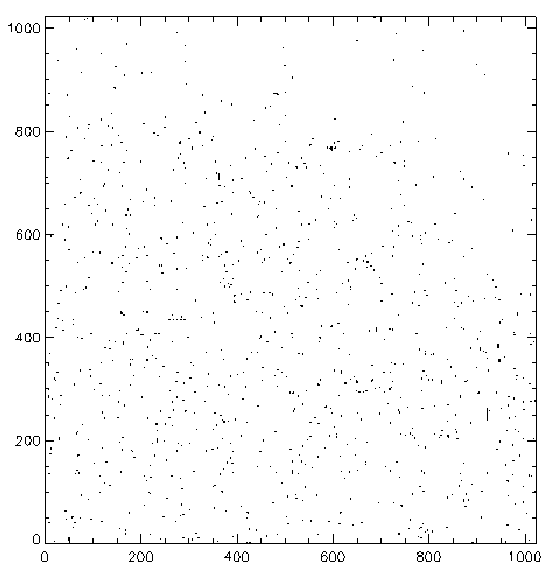
The occurrence of saturated pixels in dark current data is more common for longer exposures, for instance 30 s exposures have on average 50 saturated pixels, but dark image saturation also happens for exposures as short as 8 ms. Such a saturation can be long lasting as the example in the Figure 4 shows. Saturated dark pixels may corrupt the shape of compact structures returned from our searches. Besides, their signal can not be interpolated and subtracted from the photon signal because in the saturated signal regime the CCD looses its exposure linearity. To solve this question we went through the full resolution dark current reference images collected during Yohkoh mission, located all the CCD pixels which got saturated and removed from our compact structures database these structures which had their maximum value within 7 ×7 pixel square vicinity of any saturated pixel we found in the dark frames. The position of these bad pixels on CCD is shown in Figure 5.
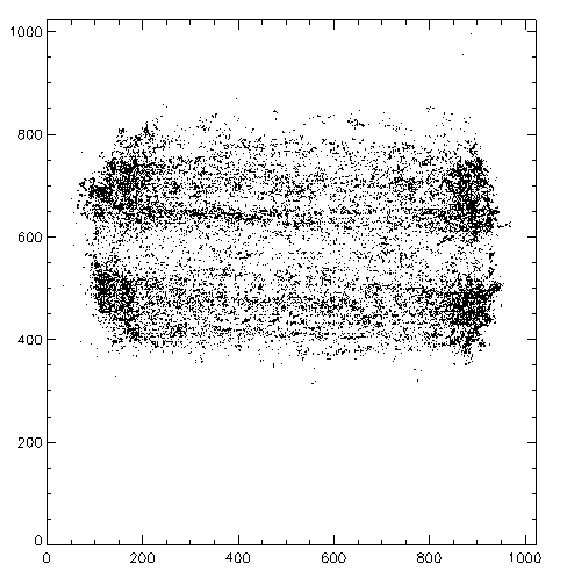
The database for compact source candidates created contains more than 6 ×10⁴ records that point at compact X-ray source images detected in SXT observations. Each record contains fields with information about the file name in which the image is stored, time of image acquisition, image maximum value, position of maximum in CCD co-ordinate system, SXT observing mode and rate, CCD temperature and integrals of the normalised signal in 3 ×3 and 5 ×5 arrays centered at the peak. We shall denote these integrals by f3 ×3 and f5 ×5. The locations of candidate sources found are shown in Figure 6.
Accordingly to SXT operation the database splits into two almost equal parts of records describing images taken in flare and quiet mode. The last two fields of the records (the integrals f3 ×3 and f5 ×5) can be useful to measure compactness of the sources in the database. The lower are values of these parameters the more compact a given structure is expected to be. In our database the values of f3 ×3 and f5 ×5 range from 2.44 to 8.09 and from 2.98 to 17.88 respectively. For comparison, in the bx02_apr23 calibration series f3 ×3 vary from 2.27 to 5.59 and f5 ×5 from 2.62 to 10.86.
To expand on the points covered above let us consider now several examples of SXT images of compact sources from our database. The first example shows one of the most compact sources of the year 2000 observed in flare mode (Figure 7).
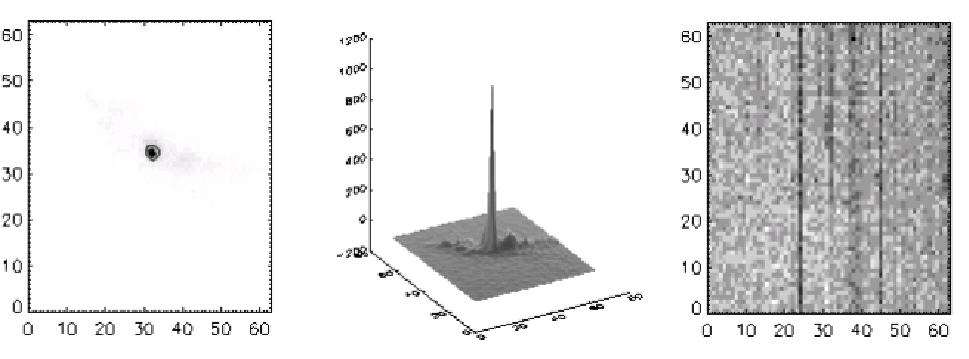
Figure 7:
One of the most compact structures of year 2000. Image (left) and shaded surface (middle) of the C9 flare kernel on 13 July 2000 at 07:01:55 UT which has been taken with exposure time 17 ms. The event took place near the limb at N16W77. On the right the interpolated dark current image which was subtracted from flare images during data reduction is shown. This dark current frame has signal values within acceptable [11, 21] DN range. CCD co-ordinates of the peak are (860,694).
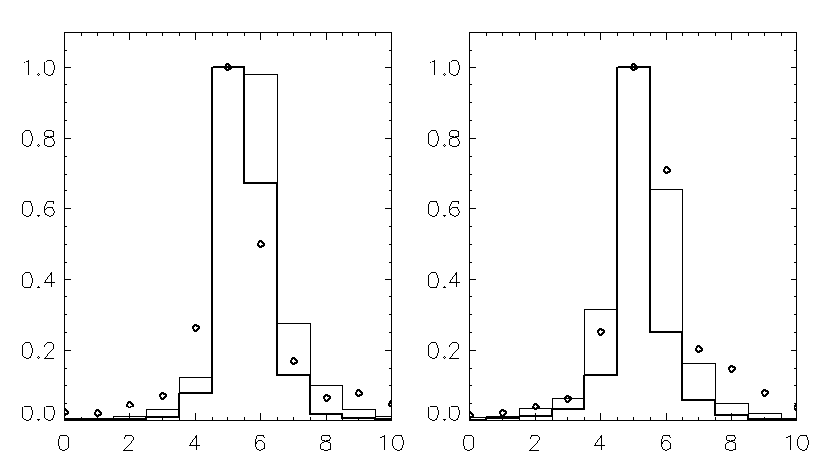
Figure 8: A comparison of peak portion for the 13 July 2000 flare image from Fig. 7 with WSMR calibration data. Circles indicate cross-sections of peak of the flare image in x (left panel) and y (right panel) directions respectively. Flare and calibration signals were normalised to [0, 1] range. For comparison we chose calibration images 21,22,23,28,29,30,35, 36,37 from bx02_apr23 series (see Fig. 2). These are situated close to the flare peak position on CCD. Thick and thin solid lines show maximum uncertainties for cross-sections determined from the mentioned nine WSMR calibration images. The normalised integral parameters f3 ×3 and f5 ×5 for the flare image peak have here values 3.66 and 4.90 respectively
It is also a very compact structure in two other SXT filters, namely AlMg, Be119 used in this flare observing sequence. Comparison of the peak portion of this image with WSMR calibration data is shown in Fig. 8.
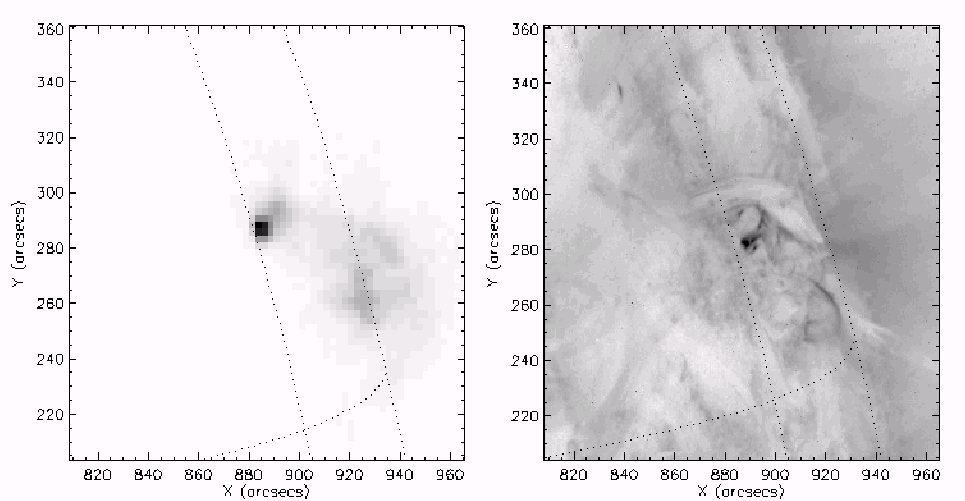
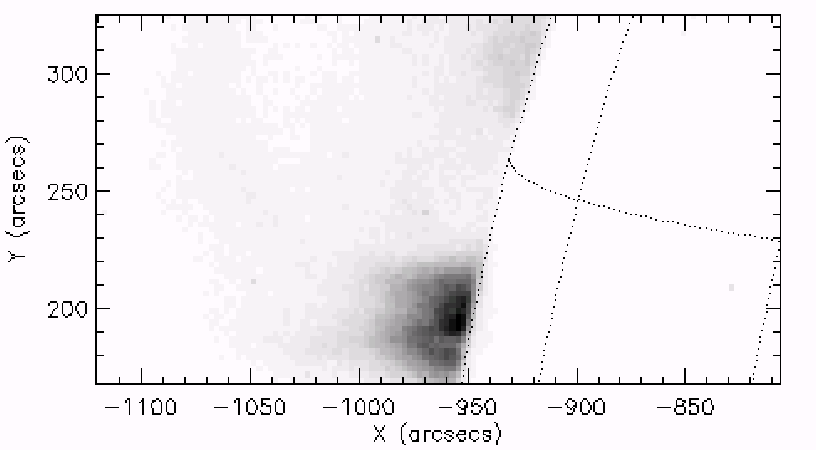
Figure 10:
An image of one of the most fuzzy structures in our database of compact sources. Image was taken on 4 November 1999 at 15:17:36 UT in quiet SXT mode. Exposure duration was 3803.35 ms. Peak position is at pixel (131, 678) of SXT CCD. Parameters f3 ×3 and f5 ×5 take high end values in this case 8.10 and 17.68 respectively.
Another example of a compact source from our database is displayed in (Figure 9). It represents also a flare kernel image. The values of parameters f3 ×3 and f5 ×5 are higher than in the previous example f3 ×3 = 3.86 and f5 ×5 = 5.58 respectively and the structure is slightly more extended. The peak position is at (878, 706) in CCD co-ordinates. This compact source was commonly observed by SXT, TRACE and EIT instruments.
From the other hand, is also interesting to know what the fuzziest sources in our database look like. An example of such a source is given in Fig. 10.
A database of full resolution images of compact sources of solar soft X-ray radiation observed during Yohkoh satellite mission by SXT telescope in thick aluminium filter has been created. The information stored in more than 6 ×10⁴ database records allows for further analysis of SXT compact structures in flare and quiet telescope operation mode.
Each database record contains fields with CCD co-ordinates of source peak positions and exact image acquisition time, what opens the possibility to study compact sources distribution, including compact limb flares identification, in heliographic or angular co-ordinate system in the period about a solar cycle long.
From the comparison of compact source examples with the WSMR ground calibration data it follows also that some of these in-flight observed structures are (in close peak vicinity) nearly of the shape of microfocus calibration beam. Therefore images of such sources can yield an approximation for the core part for the PSF of SXT instrument.
The information that we have collected about compact sources seen in SXT aluminium filter may be also used as a pointer to compact source images taken in different SXT energy bands or even to compact structure observations from the other space instrument like EIT or TRACE.
This contribution has been supported by Polish KBN grant 2.P03D.024.17. The presented work would not be possible without the generous help we received from many solar scientists. We would like to provide special thanks to Loren Acton who sent us SXT Calibration Notes, Jim Lemen for a copy of all WSMR Ground Calibration Data, Carl Foley for his continuing help during the searches we performed at YDAC database. We are also very grateful to Piet Martens and our team members for their comments and remarks during paper preparation process.