ESA SP-506 Vol. 2, p. 773-776, 2002
COMPARISON OF TRACE AND DECONVOLVED SXT IMAGES FOR SOLAR FLARES
Space Research Center, Polish Academy of Sciences, Wroclaw, Poland
ABSTRACT
In this research we have studied the relationship between thermal flaring plasma seen on TRACE and on Yohkoh SXT images. Before the comparison we have performed the deconvolution (with oversampling) of SXT images using ANDRIL algorithm. This effectively brought to scale the spatial resolution on SXT and TRACE images. For the comparison we selected events partly occulted by the limb in order to use it's apparent position for fine adjustment of images obtained in soft X-ray and EUV ranges. Based on the performed comparison we have confirmed that EUV and soft X-ray emissions do NOT exactly match. However, the overall appearance of patterns suggests presence of correspondence between plasma contributing to both emissions.
Key words: solar physics; flares; fine structure.
1. INTRODUCTION
From the launch of TRACE in 1998 we have an unprecedented opportunity
to observe the high temperature solar coronal plasma with very high spatial
resolution (the size of pixel ~0.5 arcsec). TRACE images obtained in the
195 Å channel are useful as they refer to the radiation of plasma where Fe
XXIV
line, ![]() = 192 Å and Fe XII,
= 192 Å and Fe XII,
![]() = 195
Å are emitted. Also the 171 Å channel is
sensitive to thermal plasma (~ 1 MK) owing to the presence of Fe IX and Fe
X
lines in this range. The hotter (T > 5 MK) thermal plasma is seen on
SXT Yohkoh images. The ernissivity functions for Yohkoh SXT and TRACE
channels one can find in the paper by Nitta (2000). It is generally assumed
that these instruments are useful for investigations of the thermal flaring
plasma.
= 195
Å are emitted. Also the 171 Å channel is
sensitive to thermal plasma (~ 1 MK) owing to the presence of Fe IX and Fe
X
lines in this range. The hotter (T > 5 MK) thermal plasma is seen on
SXT Yohkoh images. The ernissivity functions for Yohkoh SXT and TRACE
channels one can find in the paper by Nitta (2000). It is generally assumed
that these instruments are useful for investigations of the thermal flaring
plasma.
The overall morphology of flares as seen on individual TRACE and Yohkoh images has been compared in the papers by Warren et al. (1999), Warren (2000), Warren and Reeves (2001) for several large two-ribbon flares. Nitta (2000) studied the relation between hot and cool active region loops using nearly simultaneous X-ray and EUV snapshots made by Yohkoh SXT and TRACE. Garaimov (2002) used supplementary radio emission for the analysis of very complex flaring region located on the disc. Here we used the high resolution TRACE data and deconvolved Yohkoh SXT data for investigation of the sequences of images for limb flares. We compared patterns of plasma emission seen by these two instruments.
2. RATIONALE AND DATA SELECTION
Until now, when comparing Yohkoh soft X-ray images with TRACE EUV images the authors encountered problems with different spatial resolution of these instruments (~2.5 arcsec for SXT and ~0.5 arcsec for TRACE). We have studied the relationship between bright structures observed directly by TRACE and deconvolved Yohkoh SXT images. We performed the deconvolution with oversampling. In this respect we used ANDRIL algorithm described in the papers by Sylwester and Sylwester (1998, 1999). The deconvolution with oversampling effectively brought to scale the spatial resolution on SXT and TRACE images as the size of subpixel on the deconvolved SXT image is ~ 0.5 arcsec. For the comparison we have selected the events observed close to the limb in order to use limbs apparent position for coalignment of images in the soft X-ray and EUV ranges. This represents a different approach to that of Warren (2000), who used an "empirical" alignment when compared SXT and TRACE 171 Å and 195 Å images. In his paper he made an assumption that the bottom of SXT emission is cospatial with bright footpoints observed in 1600 Å images. Using the limb position as a reference we do not need to make such (rather strong) assumption in order to coalign images obtained from TRACE and SXT.
It was not easy to find the events commonly observed by SXT, HXT and TRACE appropriate for our purposes (we searched for exposures taken few seconds apart only). As we have decided to use the position of occulting limb as a reference for precise coalignment we first looked into Jun Sato's Flare Image Catalogue
(http: //solar. physics. montana. edu /sato/shxtdbase.html) in order to identify Yohkoh
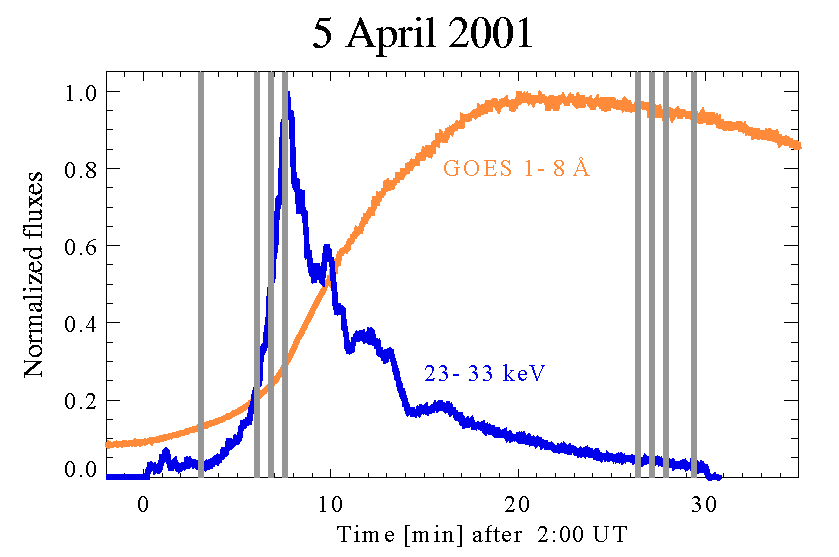
Figure 1. Lightcurves (GOES and HXT M1) for the 5 April 2001 flare with the eight times indicated, or which common TRACE and SXT images are presented in this contribution.
observed limb flares. We have found 110 limb events in this catalogue.
Next we have made inspection of the list of flares observed together by Yohkoh and TRACE. Such a list prepared by Nariaki Nitta is available at: http: //isassl.solar.isas.ac.jp/sxt_co/sxt_trace_flares/list.html. Several common limb events' observations between these two experiments have been identified only. It is beyond the scope of this contribution to present analysis of all identified events. As an example we illustrate the analysis performed for the two: the M3.1 importance flare on 5 April 2001 at ~02:20 UT and the M2.8 flare on 24 March 2000 at ~11:30 UT.
3. THE FLARE ON 5 APRIL 2001
In Figure 1 the normalized fluxes in GOES and Yohkoh HXT Ml channel are shown. Marked are the selected eight times (of twelve available between TRACE and Yohkoh) for which the images are displayed in Figure 2. The first selected time corresponds to the onset of the flare. The following times correspond to the steep rise of hard X-ray emission as seen in HXT Ml channel (3 instants) and to the decay of soft X-ray radiation (remaining 4 times) respectively. In the eight rows of Figure 2, TRACE 171 Å and deconvolved SXT A112 and Be119 images for selected times are presented. The dimension of each image is 75 x 75 arcsec. Thin, elongated loops filled with plasma emitting in TRACE 171 Å are pronounced on most of the images shown. This emission is especially prominent at the place near the limb where the two systems of coronal loops cross each other in projection. Towards the end of the hard X-ray phase (between 02:26:23 and 02:27:54), after the soft X-ray maximum is reached, an exceedingly bright and compact source (cusp?) dominates the 171 Å emission. This brightening is observed at the place where the prominent SXT kernel was observed earlier-on (compare the A112 image at 02:07:28 UT and the TRACE image at 02:26:23 UT).
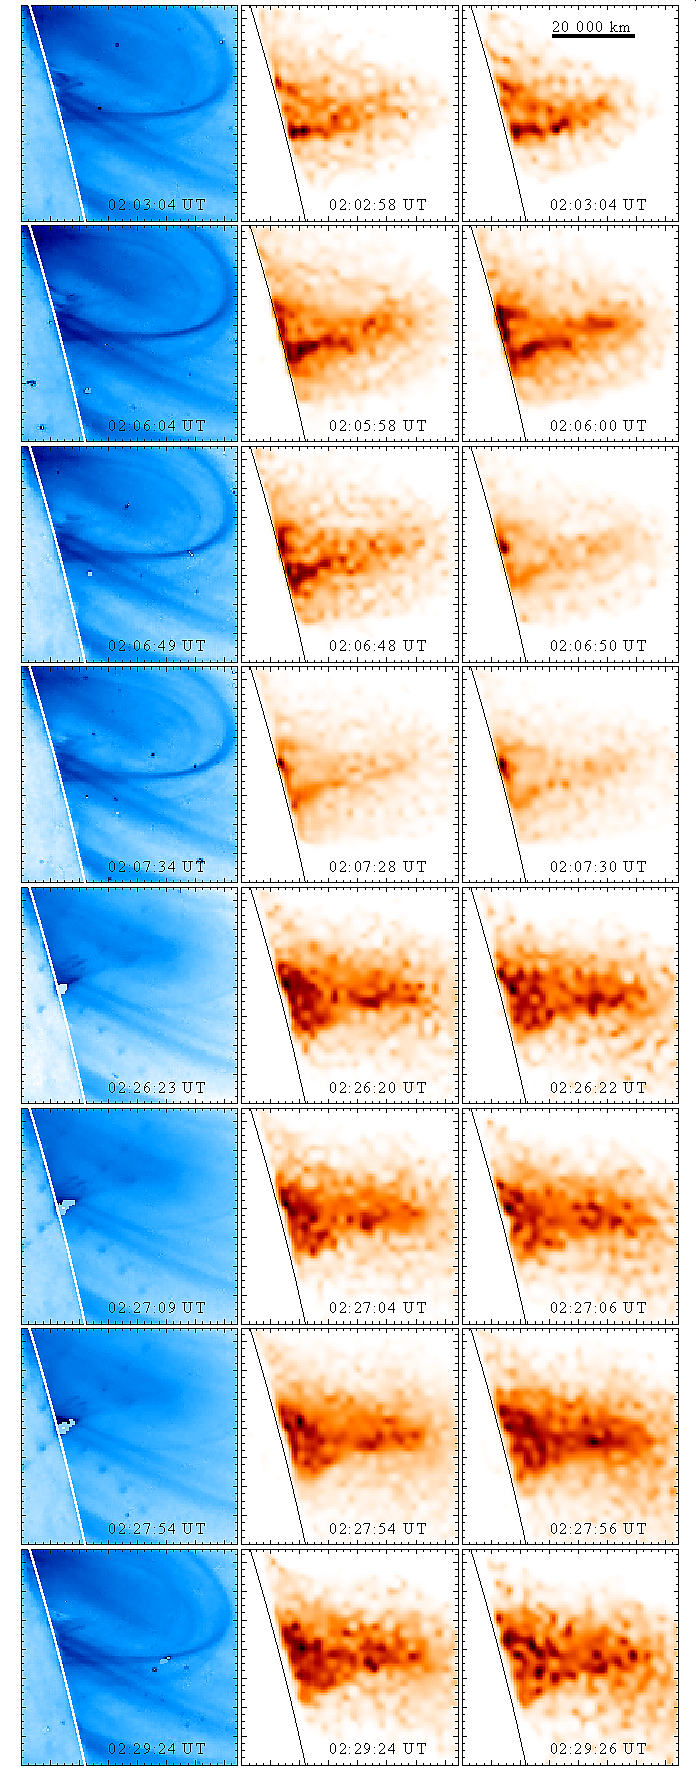
Figure 2. The sequence of TRACE 171 Å (left column), SXT A112 (middle column) and SXT Be119 (right column) deconvolved images taken close in time for the flare on 5 April 2001.
The overall shape of the soft X-ray emission in A112 and Be119 channels is observed to be similar.
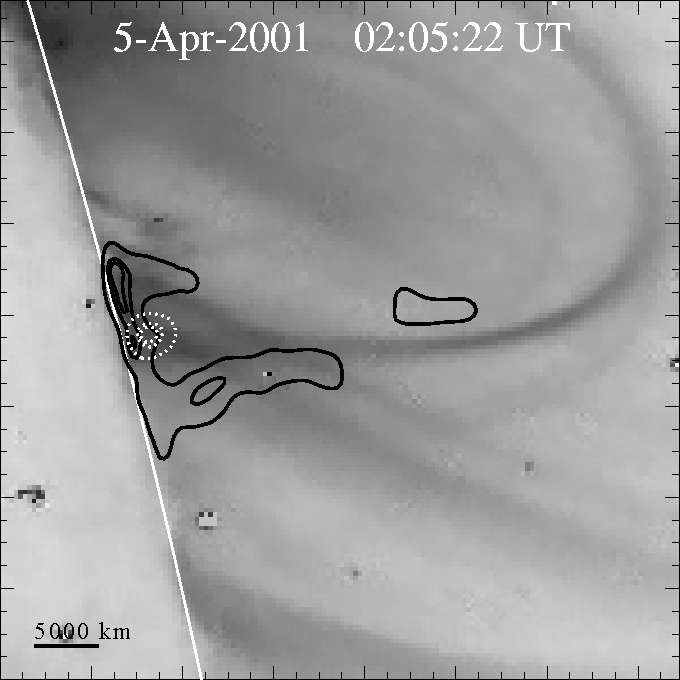
Figure 3. Overlay of flare emission patterns observed in three widely separated bands: TRACE 171 Å (at the background, taken at 02:05:19 UT), deconvolved SXT Bell9, taken at 02:05:14 UT (represented as black contours) and HXT 33 - 53 ke V, integrated between 02:04:38 and 02:06:04 UT (dotted white line).
The emission is concentrated in small localized kernels forming chains. Generally, the bright soft X-ray patches "avoid" to coincide with the cooler TRACE emission. This is best seen during the hard X-ray maximum phase (~02:07:30 UT).
In Figure 3 the contours of maximum Bell9 emission (solid lines) are drawn over the TRACE 171 Å image (at the background, reversed colours) for the time corresponding to a very steep rise seen in the HXT M2 channel. The coalignment of the images is anticipated to be of the order of ~ 1 arcsec thanks to the use of the solar limb as the reference. From the inspection of this and the other overlaid images not shown here it appears that the kernels of soft X-ray emitting plasma are "stuck" to the cooler plasma emitting in the TRACE spectral region. However, the physical links between the SXT kernels and thin structures seen in TRACE 171 Å images is not obvious. Compact hard X-ray source is located at the limb, close (in projection) to the footpoint of the TRACE elongated loop.
Detailed relative positions of the soft and hard X-ray sources observed by Yohkoh during the rise phase are shown in Figure 4. In this Figure, the background represents Be 119 deconvolved image displayed in grey scale. The contours show the most intense hard X-ray emission as seen on HXT images. The location of HXT L channel emission (14 - 23 keV) is indicated by the dark solid line and the M2 channel emission (33-53 keV) is drawn using white dotted line. The displayed hard X-ray emission pattern has been obtained from the MEM reconstruction.
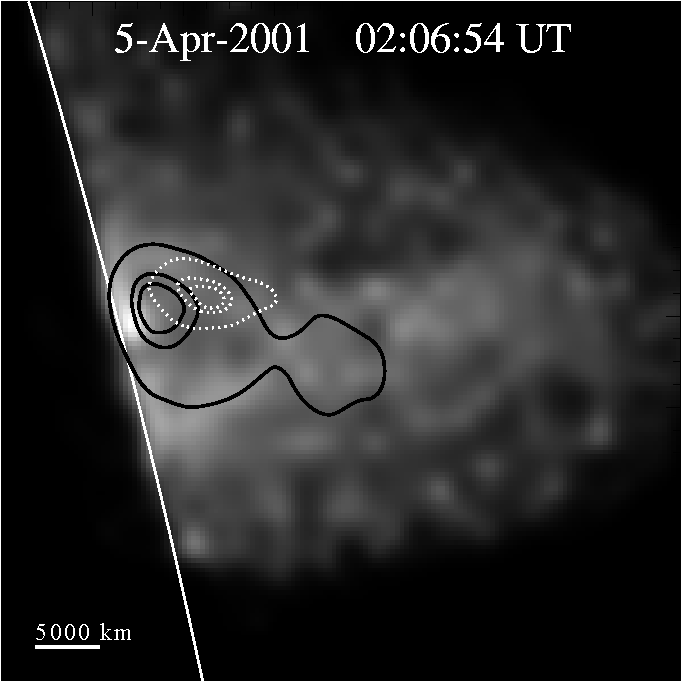
Figure 4. Overlay of three nearly simultaneously obtained emission patterns: deconvolved SXT Be119 at 02:06:50 UT (background), HXT L channel, 14 -23 keV (black solid contours) and HXT M2 channel, 33 - 53 keV (white dotted line). The time indicated is an average time (between 02:06:04 and 02:07:41 UT) for which the HXT images have been MEM-reconstructed. The images have been coaligned using Yohkoh pointing data.
It is seen that the maximum of soft X-ray emission is located close to the solar limb with the source partly occulted by dense chromospheric layers. The more energetic emission observed by HXT is located higher in the corona, radially above the SXT source. The hard X-ray emissions are evidently not cospatial in the L (14 - 23 keV) and M2 (33 - 53 keV) energy bands. The harder source is located higher in the corona (by ~ 5000 km).
4. THE FLARE ON 24 MARCH 2000
Similar comparison of TRACE and Yohkoh images has been performed for a moderate, M2.8 short duration limb flare observed on 24 March 2000. For this event the TRACE data at 195 Å have only been available. From the SXT, only Be119 images are available taken simultaneously with TRACE. However, the comparison is interesting as in this case the common observations cover also the flare precursor which occurred earlier (~ 11:19 UT) in the same active region. The GOES and HXT light-curves for this event are shown in Figure 5. The three vertical lines show times when the common TRACE 195 Å and SXT Be119 observations are presented below. These times have been selected as representative from the sequence of available twelve commonly observed snapshots. In the low panel of the Figure, the contours representing the most intense
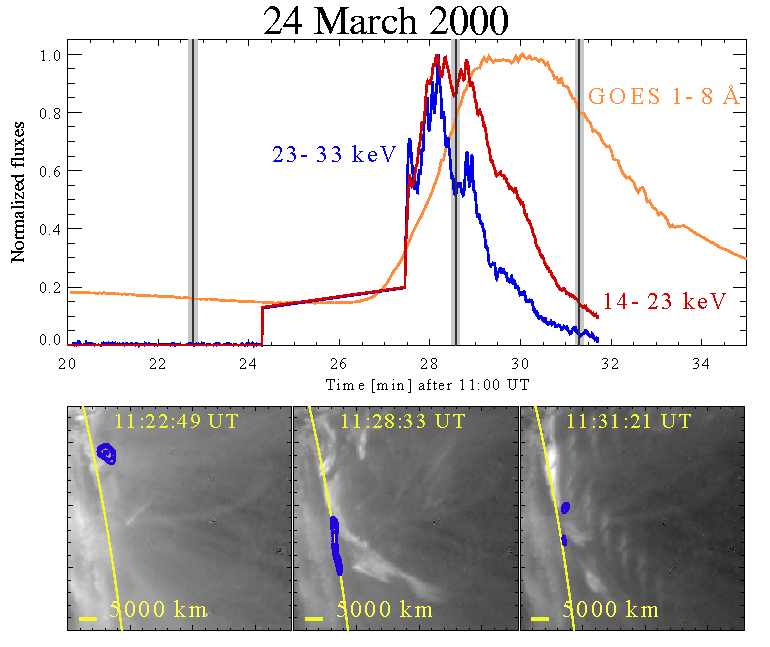
Figure 5. Top: (GOES), L (14 - 23 keV) and M1 (23 - 33 keV) lightcurves for 24 March 2000 flare. The 3 vertical lines indicate times for which images are presented below. Here, two emission patterns are overlaid: TRACE at the background and deconvolved SXT Be119 emission represented as dark contours plotted at 0.5, 0.7 and 0.95 of maximum intensity.
SXT Be119 emission are overlaid on the TRACE images. The size of image is 90 x 90 arcsec. The first image was taken during fading of the precursor for which both A112 and Be119 SXT images are available (n.b. five other image triples are available for this precursor). The morphology of emission as seen through these filters does not change much during a short period when the precursor has been observed. During this phase, the most intense TRACE emission is seen in the vicinity of soft X-ray source. It appears to be comprised of a system of densely packed, stable, tiny EUV loops with the X-ray source located at their summits. The less intense thin long loops are also visible higher-up. During the main flare, (second and third image in Figure 5) the SXT source appears compact during rise phase and evolves to a pair of small kernels separated by ~ 10000 km during soft X-rays decay. It appears that early in the event, a related flaring source is just emerging from behind the limb, somewhat southward to the precursor's location. Afterwards, the flare emission seen in the soft X-rays looks like a stripe, 20000 km long, parallel to the limb.
What looked as a mound (with SXT emission at the summit) on TRACE images during the precursor phase is still bright later on, when the new bright patch due to the main flare emission dominates. The brightest Be119 emission is located at the very edge of TRACE emission. At the last image the preflare and flare EUV emissions form more uniform diffused region while the soft X-ray emission is compact, restricted to two small patches (as plotted at 0.5 of maximum intensity).
5. SUMMARY
Based on the comparison of thermal flaring plasma morphology and evolution for two selected flares (as observed in X and EUV spectral bands) it is difficult to draw definite conclusions. The deconvolution of SXT images show much more details and indicate fine structures which could be compared with what is observed by TRACE. It is confirmed with this better spatial resolution that EUV and soft X-ray emissions generally do NOT exactly match and are not cospatial with each other at any given time. However SXT and EUV emission kernels may coincide as time pass. We have shown example of the EUV compact kernel observed exactly at the location of the SXT kernel seen ~ 20 min earlier.
The overall appearance of SXT and EUV patterns suggests presence of connections between plasma contributing to both emissions. A significant difference is noted when the flare is in progress while the emission patterns appear more similar during the preflare phase. To investigate the association of structures seen by TRACE and on deconvolved SXT images it is of crucial importance to be sure about the coalignment of images taken in both spectral regions. Using occulting limb as a reference helps in this respect, but cannot be used unfortunately in general.
ACKNOWLEDGMENTS
This work has been supported by the Grant 2.P03D.024.17 of Polish Committee for Scientific Research.
REFERENCES
Garaimov V. L, Kundu M. R., 2002, Sol. Phys. 207, 355
Nitta N., 2000, Sol. Phys. 195, 123
Sylwester J., Sylwester B., 1998, Acta Astron. 48, 519
Sylwester J., Sylwester B., 1999, Acta Astron. 49, 189
Warren H.P, 2000, ApJ 536, L105
Warren H.P., Reeves K.K., 2001, ApJ 554, L103
Warren H.P., Bookbinder J.A, Forbes T.G., et al., 1999, ApJ 527, L121