Diogeness is the uncollimated scanning flat crystal spectrometer observing flare X-ray spectra in four narrow wavelength bands in vicinity of Ca XIX, S XV and Si XIII He-like line 'triplets' around 3.18 Å, 5.04 Å and 6.65 Å. In two spectral channels, the same emission lines around Ca XIX 3.178 Å resonance are scanned in opposite directions, being diffracted from precisely adjusted identical Quartz crystals mounted on the common shaft in so-called Dopplerometer configuration. During early phase of the CORONAS-F Mission, a number of big flares have been observed by Diogeness. In particular, tens of high resolution spectra have been measured during initial, maximum and decay phase of 25 August 2001 X5.3 flare. We present examples of these spectra, make prompt line identification, announcing observations of spectral features corresponding to transitions in Si XIV
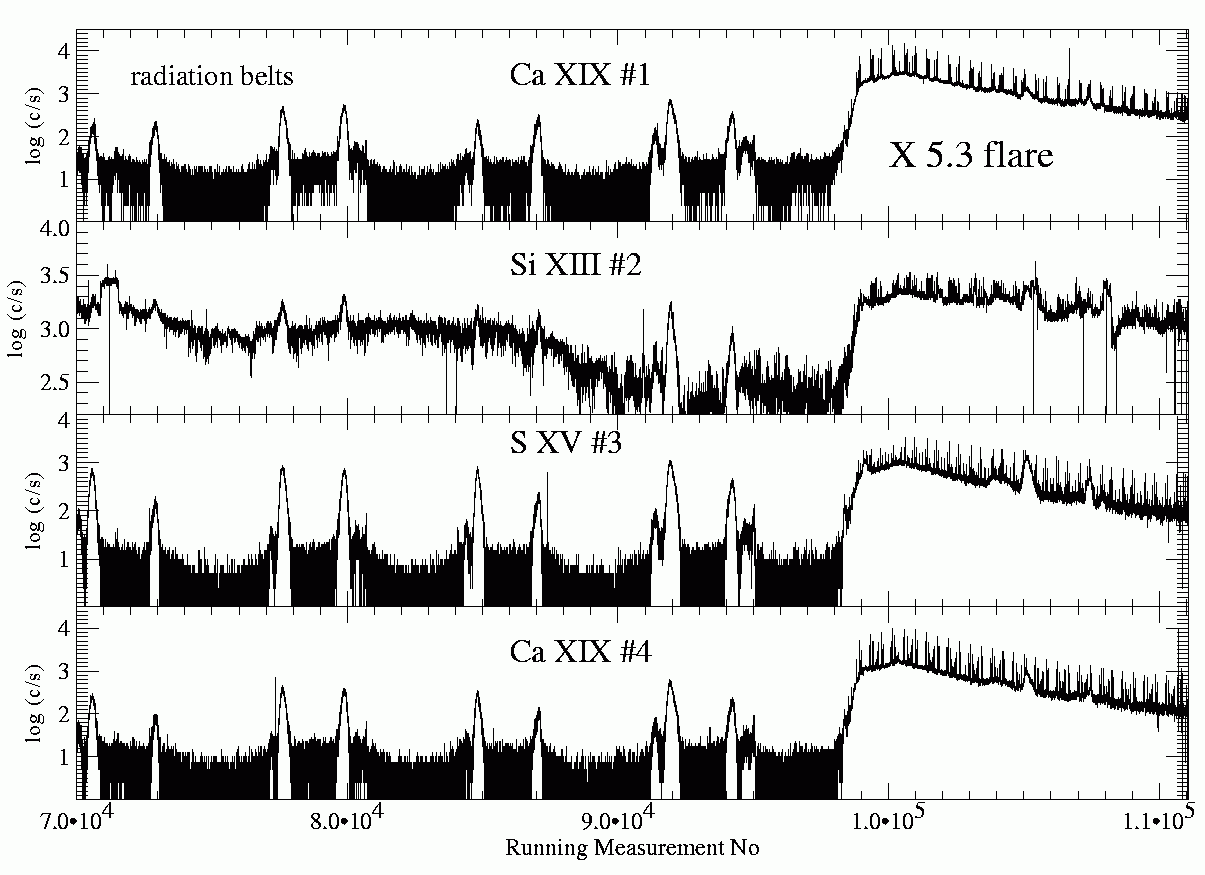
Figure 1: The time modulation of the spectral signal measured by four proportional detectors during the period preceding X5.3 flare on 25 August 2001. Regular double peaks seen on the records are due to passages of the S/C through polar fringes of van Allen Radiation belts. The modulation of measured signal due to orbital background is noticeable on these logarithmic plots. The measurements are taken few times a second. During each measurement, all the crystals rotate by ~ 20 arcsec in the (common) plane of dispersion. The scanning angle covers ~ 140 arcmin and the scanning is made continuously (back and forward).
The CORONAS-F satellite has been lunched into the ~500 km circular, polar, semi-sun-synchronous orbit on 31 July 2001 from the Russian Plesetsk Cosmodrome. Within the scientific payload, two Polish Bragg crystal spectrometers are included named RESIK and Diogeness. RESIK is the bent crystal spectrometer allowing for soft X-ray spectra to be recorded instantly in ~ 1000 spectral bins in the range 3.4 Å - 6.1 Å. Early results from this spectrometer are discussed by Sylwester et al., (2002).
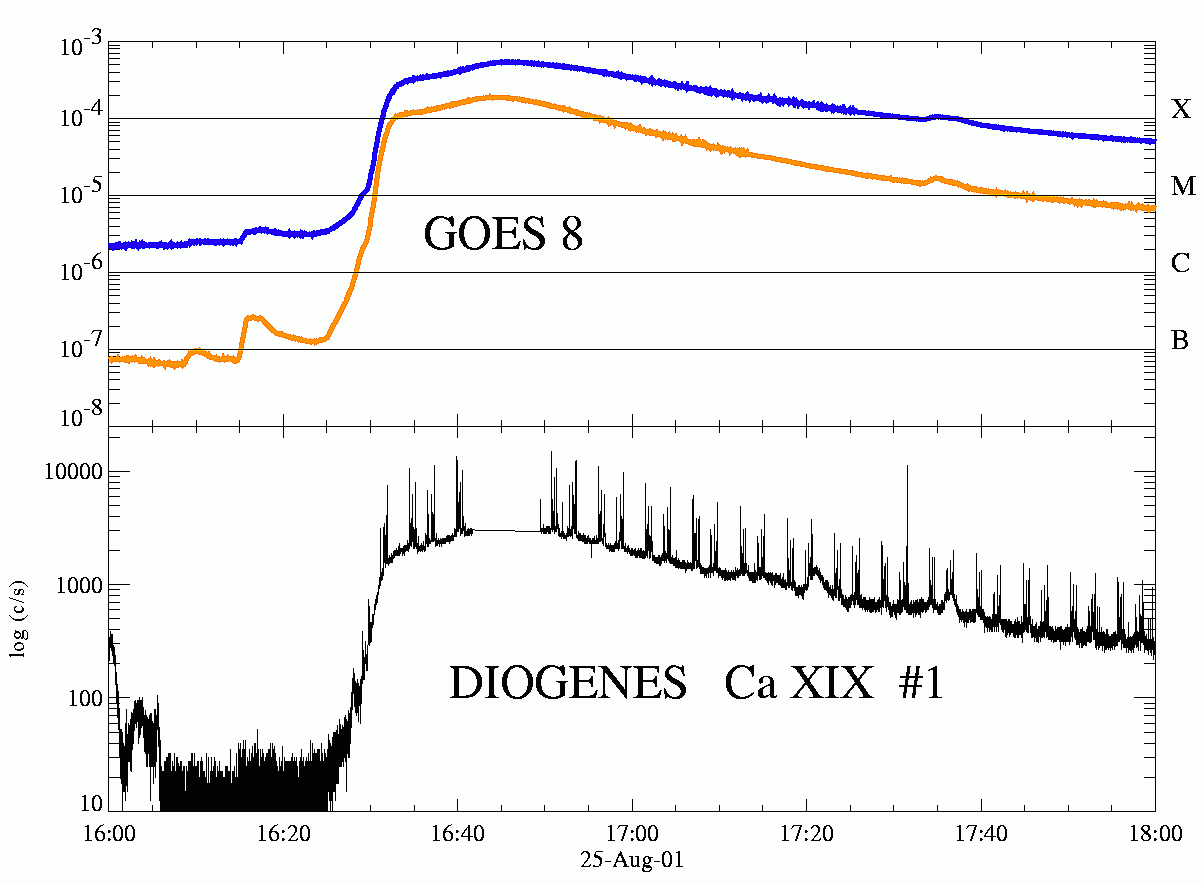
Figure 2: GOES light curves of the X5.3 flare in 1 - 8 Å and 0.5 - 4 Å bands. At the bottom, Diogeness spectral time record for channel #1 (Ca XIX band) is shown for the comparison. The forest of spikes on the lightcurve corresponds to the spectral lines scanned continuously. Each spike consist of ~ 400 spectral points, as shown in more details in Figure 3.
Diogeness is the scanning flat crystal spectrometer described also by
Plocieniak et al., (2002). The spectrometer consists of the two pairs
of crystals fixed mechanically on the common shaft at the Bragg angle
corresponding to the wavelengths of a strong emission line. By rotating
back and forward, the crystal shaft the X-ray spectra are recorded using
proportional detectors. As crystals in each section are mounted back to
back, the wavelength scanning is taking place in the opposite directions.
The time differences between the line maxima recordings allow for precise
measurements of a possible Doppler shifts of the measured lines as described
in detail by Plocieniak et al., (2002).
In this paper we present examples of the spectra recorded in the whole
spectral bands covered (for details see Sylwester et al., 2002a). We also
identify few of the observed new spectral features including the ![]() line formed in the H-like Si XIV
ion. We also look to the variations
of flare plasma temperature observing its fast decrease during the decay.
It is worth to note, that Diogeness spectral observations, when combined
with the Yohkoh BCS spectral measurements made in the overlapping
bands give for the first time a chance to study spectral evolution of a
strong X-type flare from the very onset to the late decay. This is thanks
to a fortunate coincidence of the spectral coverage, spectrometers'
sensitivities and spacecraft locations in orbit. Common data analysis is
in progress.
line formed in the H-like Si XIV
ion. We also look to the variations
of flare plasma temperature observing its fast decrease during the decay.
It is worth to note, that Diogeness spectral observations, when combined
with the Yohkoh BCS spectral measurements made in the overlapping
bands give for the first time a chance to study spectral evolution of a
strong X-type flare from the very onset to the late decay. This is thanks
to a fortunate coincidence of the spectral coverage, spectrometers'
sensitivities and spacecraft locations in orbit. Common data analysis is
in progress.
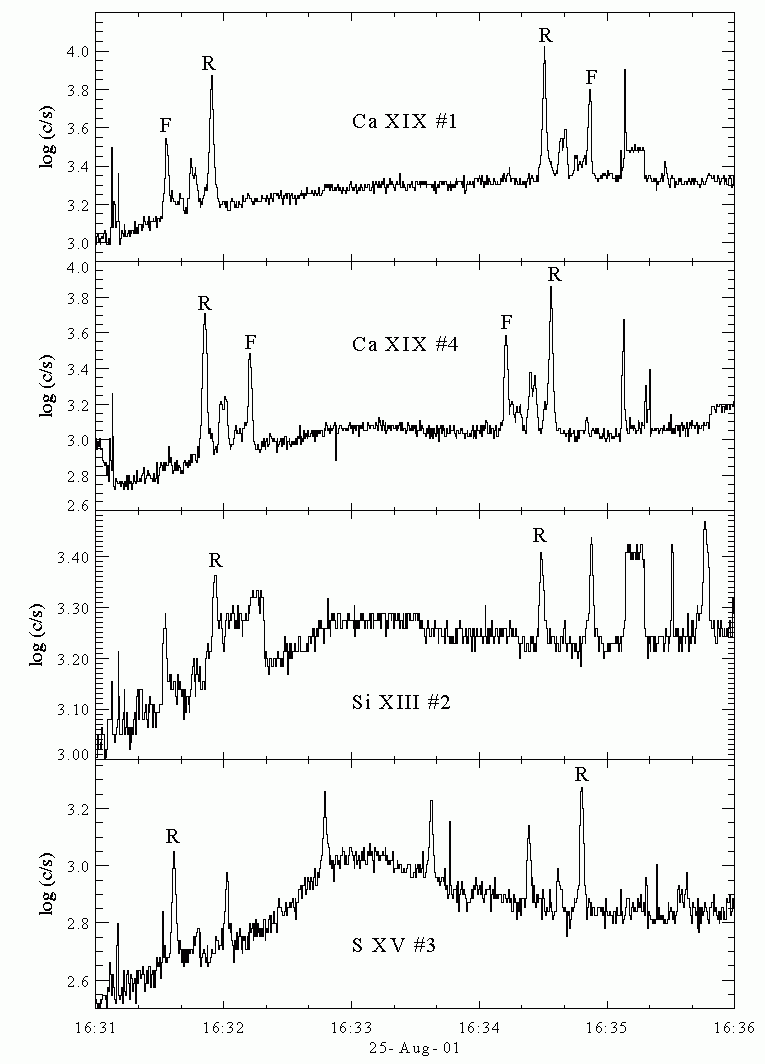
Figure 3: Section of Figure 1 showing the spectral records in more details. The strong, so called triplet lines of Ca XIX, Si XIII and S XV He-like ions are seen above the continuum. The time period shown corresponds to fast rise of flare emission, which is reflected by a rising continuum emission level. The ''bump'' seen in the centre, is partly due to the particle environment (van Allen belt crossing). The abrupt jump seen on the Si XIII record around 16:32:20 UT is due to unstable amplifier electronics. The wider structure seen around 16:35:15 UT is recorded at the time of changing the spectral scan direction, when the crystal angle does not change.
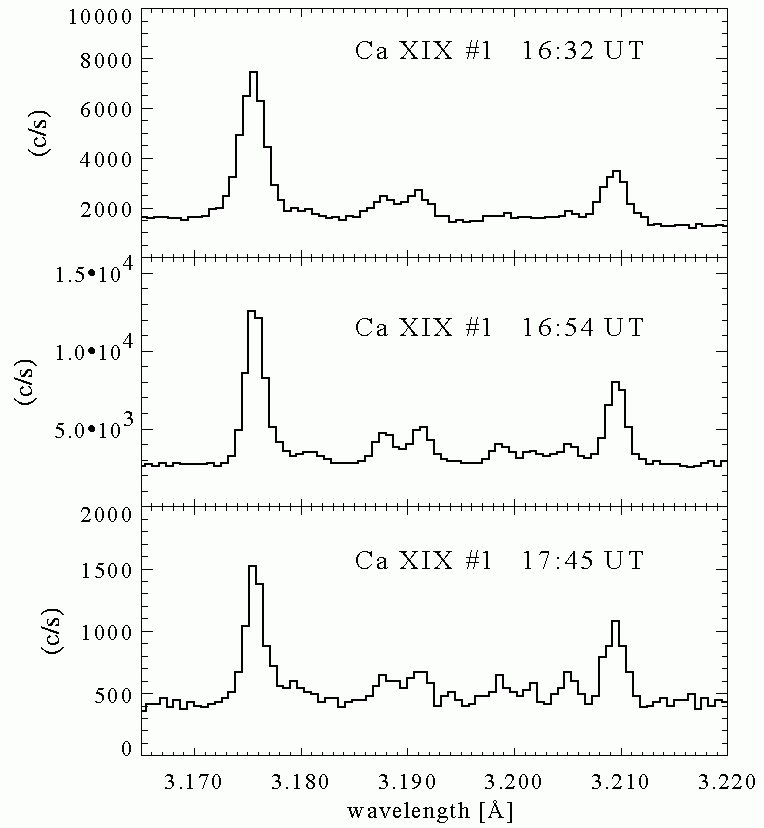
Figure 4: Three full resolution Ca XIX spectra taken during rise, maximum and decay phase of the 25 August X5.3 flare respectively. Typical variations of the line shapes are pronounced. The lines are much wider early on during the flare. Except the three strong spectral features corresponding to (w), (x,y) and (z) transitions, numerous so called satellite transitions becomes visible, when the flare plasma cools during the decay. Satellite-to-resonance line ratio is a very sensitive plasma thermometer.
Except for flares greater than GOES M1 class, most of the signal recorded is due to particles (orbital background), since the sensitivity of the spectrometer is small (0.3 cm2 detector aperture). However, for the large events, the signal recorded during scans closely follows the GOES light curves, as is shown in Figure 2 for one of the Ca XIX channels. During each scan, mostly the continuum is reflected obeying the Bragg ''reflection'' law, however, when strong emission lines of He-like triplet are encountered, the multiple spikes can be distinguished, clearly resolved into spectra in Figure 3. During strong events, like this presented as an example, the Yohkoh BCS large area detectors are saturated for most the time (when GOES class is above M2 level), and therefore presented Diogeness measurements constitute unique spectral observations of the extremely strong flare.
In Figure 3 we show details of the measured spectra in the time interval
between 16:31 UT and 16:36 UT, during the rise phase of the event. Two full
scans, one in forward and one in backward directions are shown, each scan
lasting ~ 120 s. The spectra scanned include main triplet lines i.e.
the resonance (R), intercombination (I) and forbidden (F) lines, frequently
refereed as (w), (x,y) and (z) transitions in the He-like ions of Ca,
Si and S. In Figure 4, the high resolution Ca XIX
spectra are presented
for three characteristic moments during flare rise, maximum and decay phase.
Differences in line widths and changing line intensity ratios are pronounced.
As it is already known from SMM and Yohkoh measurements made in this
very spectral range, the lines are wider during rise phase, acquiring thermal
widths during decay phase. When the temperature drops, many satellite lines
start to be seen. For Diogeness spectra, it is possible to see rarely observed
satellite lines on the long-wavelength side of the forbidden line, around ![]() = 3.217Å. The wavelength scale plotted is experimentally
determined, as described in more details by Plocieniak et al., (2002).
= 3.217Å. The wavelength scale plotted is experimentally
determined, as described in more details by Plocieniak et al., (2002).
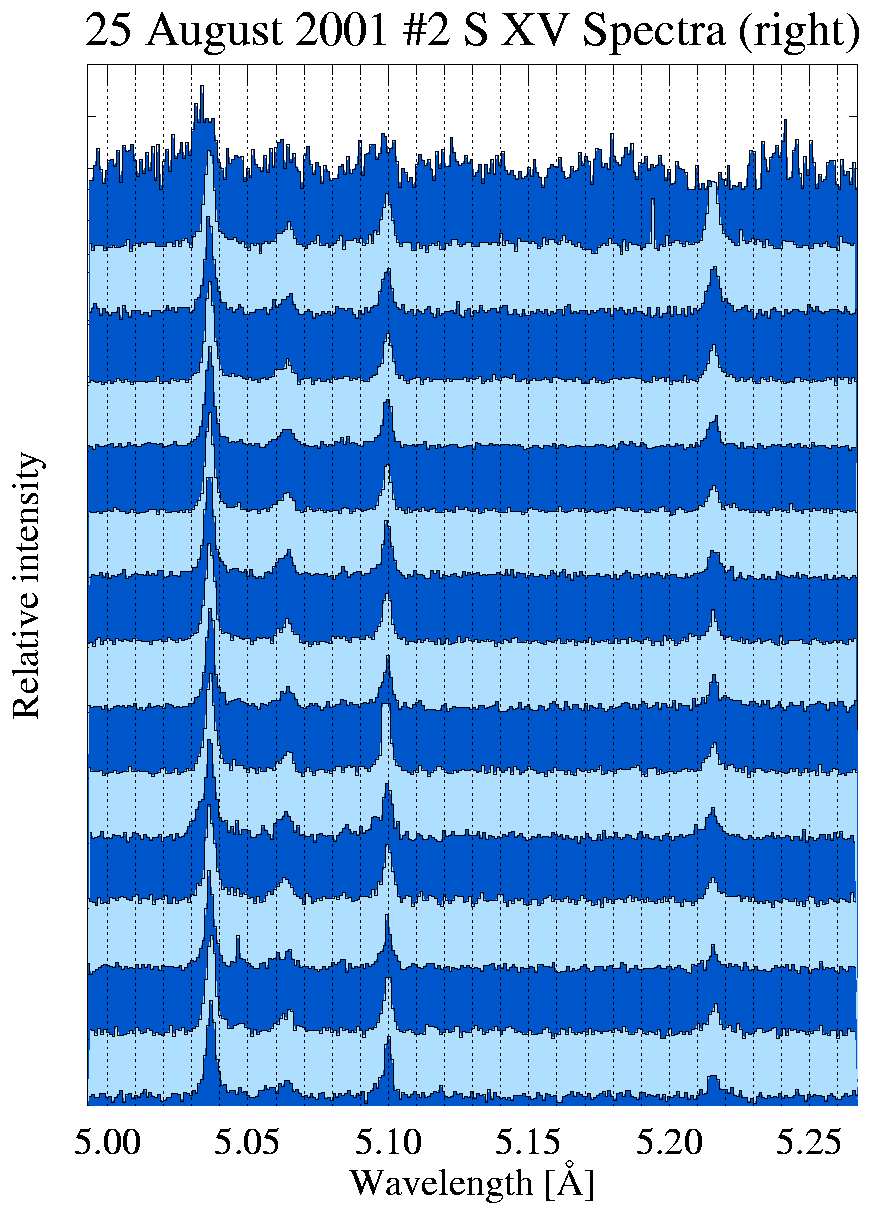
Figure 5:
Example sequence of #2 spectra showing systematic variations of relative
line intensities in the entire range observed. Consecutive even scans are
shown, differently shaded in order to avoid confusion. The variation of the
background and continuum has been removed in order to show the spectra in
more details. The spectral features seen around 5.22 Å correspond to
1s 2S1/2 - 3p 2P3/2,1/2
![]() transitions in H-like
Si XIV ion. This line has rarely been observed before on the Sun.
(See next Figures for more details).
transitions in H-like
Si XIV ion. This line has rarely been observed before on the Sun.
(See next Figures for more details).
Besides the strongest He-like triplet lines, Diogeness measures also the other lines important for plasma diagnostics. One of the most interesting
is the ![]() line of Si XIV ion. As this line is mostly formed
in the hottest region of the flare, its intensity rapidly falls during
the decay, which is seen from the sequence of spectra shown in Figure 5.
Individual spectra illustrate the time evolution of relative line
intensities with time (from the rise phase at the top towards the decay
at the bottom of Figure 5).
line of Si XIV ion. As this line is mostly formed
in the hottest region of the flare, its intensity rapidly falls during
the decay, which is seen from the sequence of spectra shown in Figure 5.
Individual spectra illustrate the time evolution of relative line
intensities with time (from the rise phase at the top towards the decay
at the bottom of Figure 5).
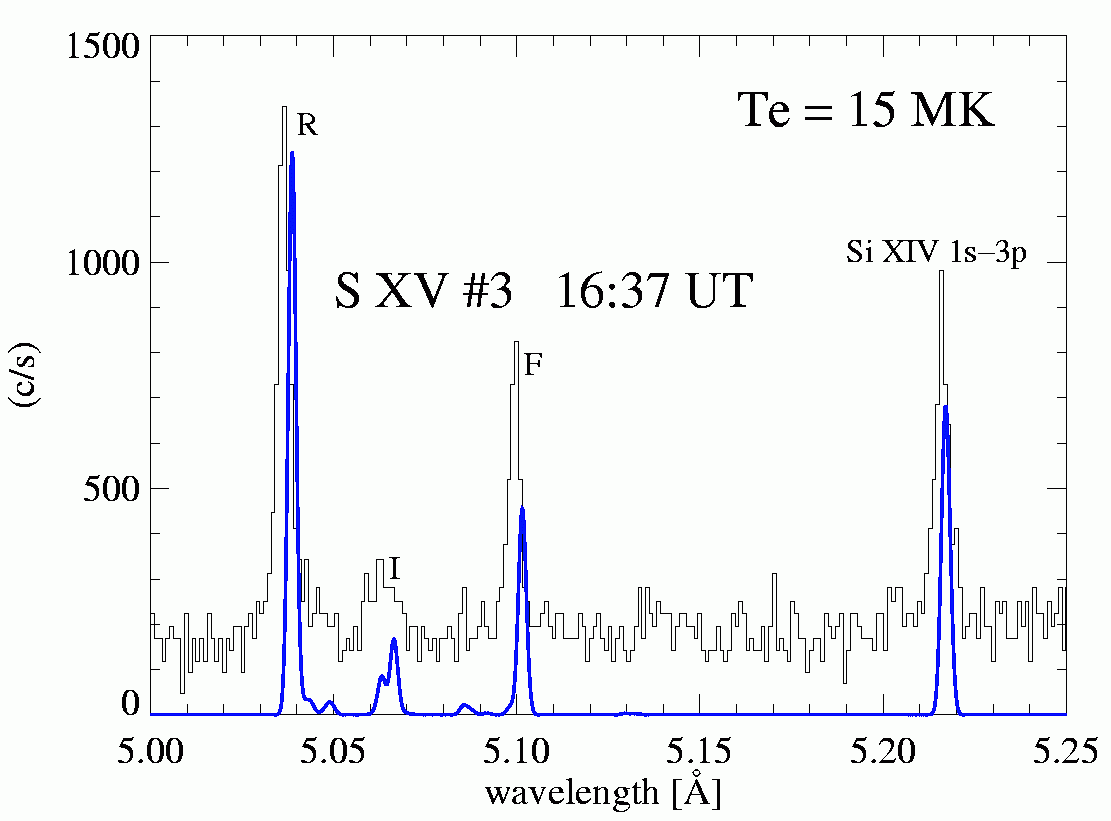
Figure 6: The comparison of the observed (histogram) and theoretically synthesised spectra in the spectral region observed in #2 of Diogeness. Theoretical spectrum has been calculated using CHIANTI spectral code, assuming the plasma temperature T = 15 MK. Standard chemical composition and ionisation balance has been assumed. The widths of lines have been assumed thermal. The continuum emission has not been included in the spectral synthesis, in order to allow for better visual inspection of a good correspondence between the measured and theoretical spectra. The example shown corresponds to the maximum phase of the flare, with the centre of the observed spectrum recorded around 16:37 UT.
The spectra plotted have been normalised to the resonance line maximum in order to allow for easy comparison of relative intensities. Ratio of S XV to Si XIV line intensity is very sensitive to plasma temperature, but its proper theoretical interpretation involves knowledge of the plasma ionization balance and chemical composition. We have made first attempt to model the observed spectrum using the CHIANTI spectral code (Dere et al., 2001). The results are presented in Figures 6 and 7 for flare maximum and decay phase spectra respectively. In Figure 6 we compare the observed S XV flare spectrum observed during maximum phase. It is seen that a simple one-temperature model adequately describes the observed line ratio with the approximate plasma temperature around 15 MK. However, it is not possible to accommodate all observed Ca, S and Si spectral lines taken together with such a simple single-temperature model of the source. The multitemperature analysis of the spectra observed is in progress.
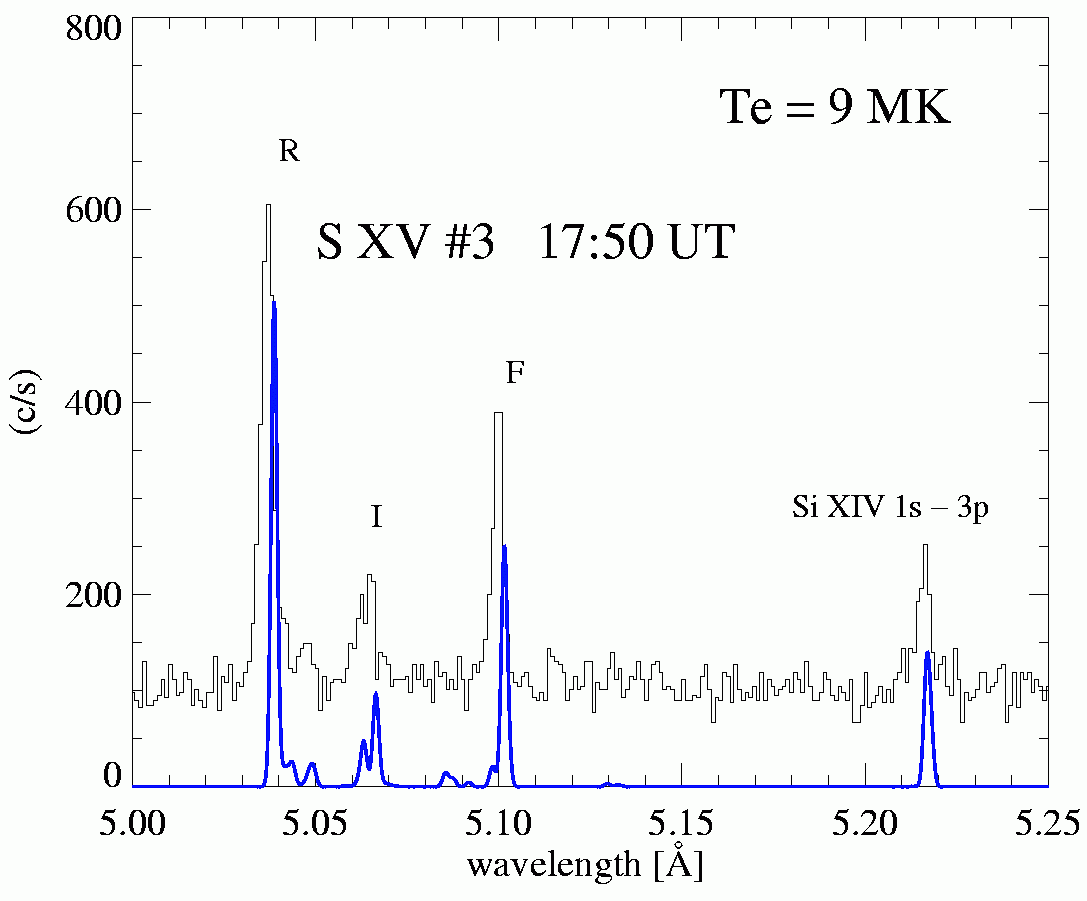
Figure 7: Comparison of the observed and synthetic spectra. In this case the optimum fit has been obtained assuming that the emitting plasma is at T =9 MK. The spectral synthesis has been made using CHIANTI spectral package (Dere et al., 2001). The spectrum shown has been observed during flare decay around 17:50 UT.
This work has been supported by the Grant 2.P03D.002.22 of Polish Committee for Scientific Research.