In this contribution we analyse a number of limb flares
apparently related with coronal mass ejections (CME). Near - limb
location of flares is useful for a precise coalignment of images
obtained in the soft and hard X-rays. This precise coalignment is
of primary importance for determining the distribution of plasma
parameters using ''filter ratio'' technique. Standard alignment
procedures adopted within the Yohkoh analysis software
appear not adequate in this respect. As an example of the analysis
performed we have selected to discuss here the event comprised of
C7.0 and M2.5 importance flares observed over the limb on 16
October 2000. The first flare (precursor?) although much fainter
in soft X-rays exhibits substantial nonthermal signature - a
sharp, event dominating, hard X-ray spike observed up to ~ 50 keV. The event-associated CME has been launched around the
time (rise phase) of the second flare. In Figure 1 we present the
three lightcurves: as seen by GOES (![]() =
1 Å - 8 Å channel), this observed in the BCS resonance
w line of Ca XIX ion and the HXT M1 channel
(23 keV - 33 keV). The lightcurves displayed in the Figure embrace
both flares. The first flare started at 05:32 UT and reached the
maximum at 05:49 UT. The second flare began at 06:40 UT and
reached the maximum at 07:28 UT. Both flares seemingly occurred at
the same active region which already moved far behind the solar
limb.
=
1 Å - 8 Å channel), this observed in the BCS resonance
w line of Ca XIX ion and the HXT M1 channel
(23 keV - 33 keV). The lightcurves displayed in the Figure embrace
both flares. The first flare started at 05:32 UT and reached the
maximum at 05:49 UT. The second flare began at 06:40 UT and
reached the maximum at 07:28 UT. Both flares seemingly occurred at
the same active region which already moved far behind the solar
limb.
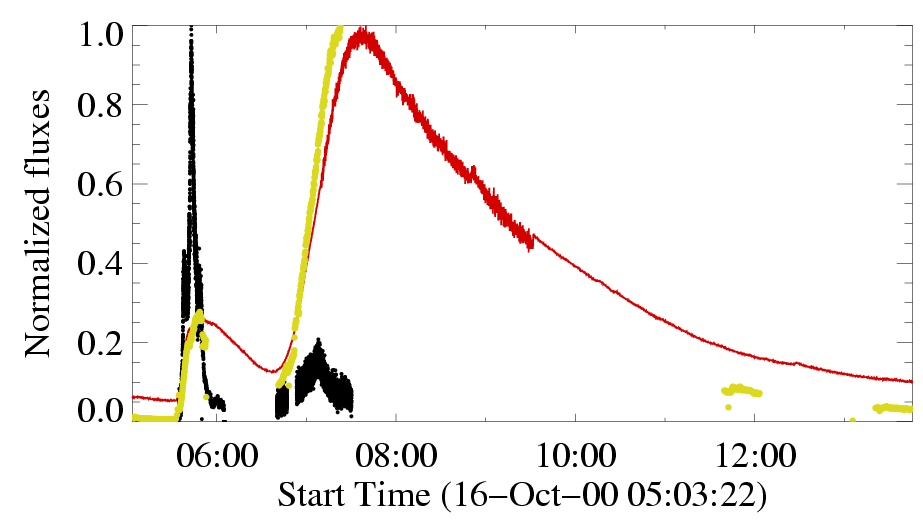
Figure 1: The lightcurves for the double event on 16 October 2000. The plots represent: 1 Å - 8 Å emission seen by GOES (smooth black line over entire time interval), Ca xix resonance line emission as observed by BCS (separate grey curves covering four Yohkoh orbits) and M1 channel emission of HXT (23 keV - 33 keV) for two orbits when this emission was above background. Note the reverse proportions between soft and hard X-ray emission among the two flares. The curves plotted are normalised (in respect to their maxima) in order to bring them to common scale.
We have studied the evolution and morphology of brightness patterns seen on hard, MEM reconstructed HXT images, and soft, deconvolved SXT images. We have performed the analysis of time-dependent maximum brightness location for soft and hard X-rays. We also looked into the relationship between their relative positions.
To supplement the analysis of transversal variations (which come as a result of image analysis), we have used the BCS spectra obtained in the vicinity of resonance lines of Fe XXV, Ca XIX and S XV ions, for determination of the radial motion in the observed flares. In addition, observed changing line broadening contains information on nonthermal (turbulent) plasma motions. By fitting a Gaussian profile to the resonance lines of Fe XXV, Ca XIX and S XV ions we have determined respective line positions and line widths. For more comprehensive description of the analysis of directed and turbulent plasma motions the reader is referred to papers by Fludra et al., (1989), Doschek et al., (1993) and Sterling et al., (1996).
As is seen in Figure 1 the BCS data are available for analysed flares also towards the late decay phase. The spectral line positions as determined for this late decay phase have been treated by us as reference, i.e. we assumed no directed plasma motions at that time. The results presented do not depend heavily on this assumption. As the SXT and BCS images show-up presence of a hotter (T > 5 MK) thermal plasma (Sylwester and Sylwester, 2002) and the emission seen in higher channels on HXT Yohkoh images may come also from the nonthermal contributors, using these data we can look into the thermal/nonthermal plasma relationship.
Inspection of sequences of deconvolved SXT images shows that the overall shape of the soft X-ray emission seen in AlMg, Al12 and Be119 channels share similar patterns as concerns both spatial and time variations. The emission is at the beginning concentrated in chains of small localised kernels "protruding" just above the limb into the corona. This chains resemble the loop-like structure as seen in lower resolution. Later on, the brightest emission moves a bit higher being concentrated at one time (05:41 UT) in the northern leg of the loop. During the soft X-ray maximum (towards the end of hard X-ray phase) the most prominent becomes compact kernel located at (what appears to be) the southern leg's base.
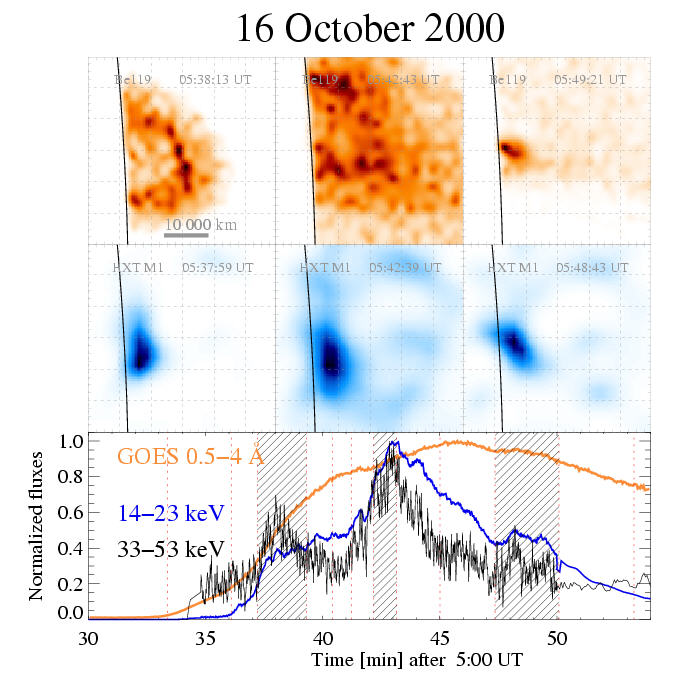
Figure 2: The composite picture showing SXT Be119 deconvolved images (top row), coinciding MEM reconstructed HXT M1 (23 keV - 33 keV) images (middle row) for three peaks of hard X-ray emission. This three peaks make input to the first spike seen in Figure 1. The soft (GOES 0.5 Å - 4 Å) and hard (HXT LO and M1) X-ray lightcurves are displayed in the bottom row for the comparison. The hatched areas mark time intervals used for HXT image reconstruction.
Some of this changing pattern may be seen in the upper panel of Figure 2. Note that the intensities on all images have been normalised to the local maximum on each image. During the hard X-ray rise phase the bright soft X-ray patches tend to ''avoid'' regions of increased nonthermal hard X-ray emissions. This is best seen in the initial frames (first column presented in Figure 2) where the soft X-ray emission encompasses the hard X-ray emission kernel. After the maximum of the hard X-ray emission, the soft and hard X-ray emission patches appear to be nearly cospatial in projection which is seen in Figure 2 (last column) and in detail in Figure 3. There, the exact overlay of three emission patterns simultaneously obtained during the hard X-ray post-maximum phase is presented. The images in Be119 and in HXT bands have been summed over the same time interval in order to improve the statistic. The cospatiality of the emission seen at this time rules out any possibility that the differences in location of the soft and hard X-ray sources seen before were related to uncertainties of the coalignment. The SXT and HXT images have been coaligned using Yohkoh pointing data files and the SolarSoft routines. The coalignment accuracy of SXT and HXT images is therefore anticipated to be of the order of ~1 arcsec. From the inspection of Figure 3 and the other available SXT and HXT pairs of thus overlaid images, it appears that during the rise phase of hard X-ray emission the hard and soft X-ray emission comes from separate plasma locations (volumes). This is rather surprising since for most of flares analyzed yet using the same technique, the HXT and SXT emission patches although not exactly cospatial, have not been separated so much as in the present case. During the hard X-ray decay phase of this flare the soft and hard emissions come from regions overlapping in projection. From the discussed picture showing different location of the harder and softer X-ray sources, the physical links between them are not obvious.
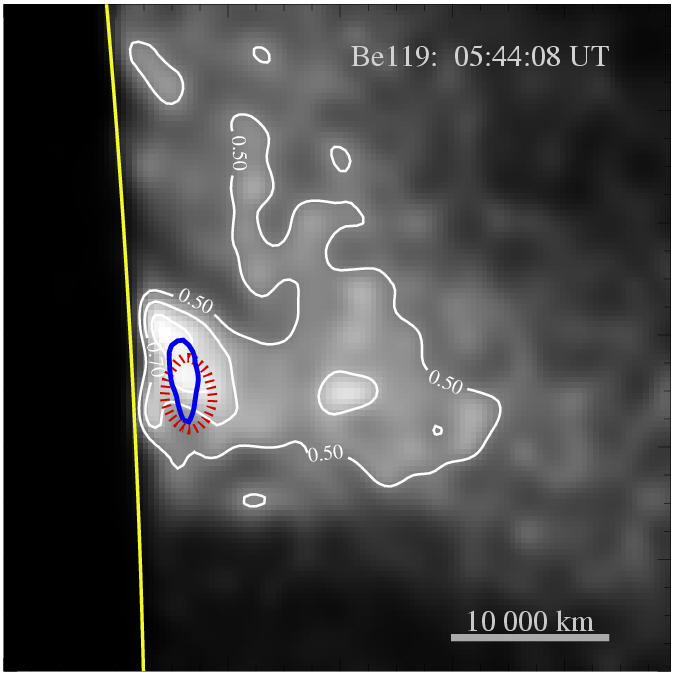
Figure 3: The overlay of three emission patterns observed simultaneously at the phase just after the main hard X-ray maximum (at ~ 05:44:08 UT). The deconvolved SXT Be119 emission is placed as background with the white thin contours drawn at the indicated levels. The HXT LO-band emission (14 keV - 23 keV) is represented by black dashed contours and HXT M1 emission, (23 keV - 33 keV) by solid black contour.
It is convenient to study the soft X-ray bright kernel's location by looking into time sequence of contours drawn at the level close to the maximum (0.85 of maximum intensity in the present case). From such a sequence plot shown in Figure 4 it is seen, that the most intense soft X-ray emission changes its position considerably. The individual bright kernels become visible at different locations during ~15 minutes of evolution (traced by SXT Be119 flare sequence). The displacements observed are as much as ~40 arcsec in the direction along the solar limb and ~25 arcsec radially. The contours become lighter as time passes towards the end of ~15 minutes time interval considered. It is seen that the emission observed towards the end is placed very close (loop top?) to a pair of emission kernels seen at the beginning. Meantime however, the brightest kernels are located quite far away from that place (forming quasi loop-like structure 20 000 km high). The colour animation showing the evolution pattern presented in Figure 4 can be downloaded from: www.cbk.pan.wroc.pl/publications/2003/cme_accomp_flare/be_cont_085_A.avi.
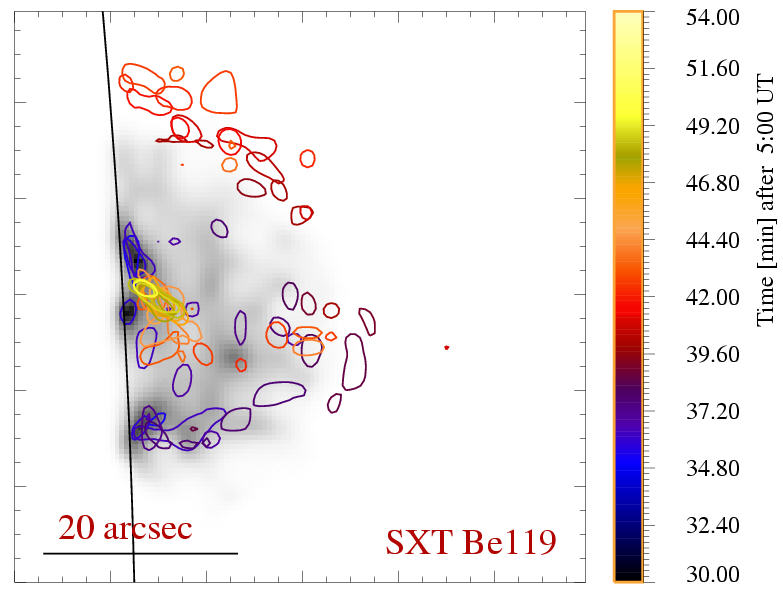
Figure 4: The evolution of maximum brightness location (contours drawn at 0.85 of maximum intensity) for consecutive frames as seen on deconvolved Be119 images. The contours are overlaid atop the background emission pattern (in grey) representing the first Be119 image (05:35:25 UT) obtained in the flare SXT mode. The vertical bar to the right of the image gives the grey shade - time relation.
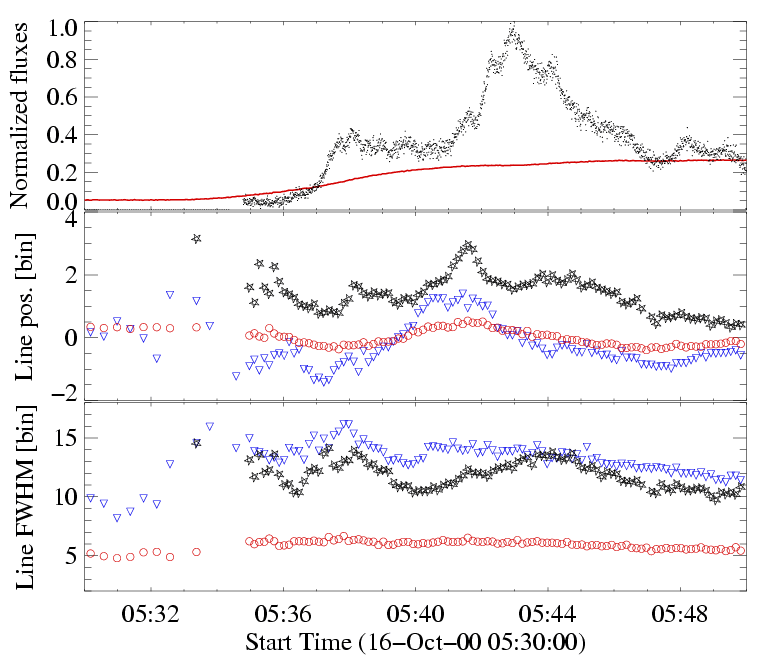
Figure 5: Results of the analysis of BCS spectra as obtained for the first flare. In the top panel the time variations of GOES X-ray flux in 1 Å - 8 Å band is shown as smooth, flat curve. The HXT M1 emissions in 23 keV - 33 keV is over plotted (spiky line). Both curves are normalised over the period covering both flares and therefore the GOES level is relatively low. In the middle panel the positions of resonance line centroids are plotted for Fe XXV (asterisks), Ca XIX (triangles) and S XV ions (circles). At the bottom panel the variations of respective lines' FWHMs are presented.
Using the spectra observed by the BCS we have studied the flaring plasma dynamics. In this respect we looked into variation of the centroid of line position and the line width. We have used the resonance lines of Fe XXV, Ca XIX and S XV ions and performed the single component Gaussian fitting to the observed line profiles. This allowed us to precisely determine the centroid position (bin) and the full width at half maximum (FWHM). The results of such simple spectral analysis are presented in Figure 5. From the top panel it is seen that the hard X-ray flux ceases when soft X-ray is still rising (this might relate to the so called Neupert effect). From the middle panel it is seen that the most pronounced line shifts (so the largest directed motions) are observed for the hottest (T > 15 MK) resonance line of Fe XXV ion. The maximum Doppler shift observed coincides with the small spike seen on the hard X-ray lightcurve. The radial component of plasma velocity which corresponds to the maximum shift observed accounts for ~180 km/s. The other two lines: Ca XIX and S XV are also shifted but not as much as Fe xxv line. There are no sharp maxima in observed Doppler shifts for these lines. The corresponding velocities are much smaller (~25 km/s). All the bulk motions tend to cease when the hard X-ray flux decays. Presented results confirm presence of elementary components (kernels, blobs) of hot plasma moving with substantial velocities parallel to the solar surface. As there is no spatial resolution in the BCS data the line shifts observed are due to combined contribution from all emitting structures (possibly these seen in detail on the SXT deconvolved images).
The line widths (FWHM) being the indicators of turbulent plasma velocities are presented at the bottom of Figure 5. Only for the hotter lines (Fe XXV and Ca XIX) the increase of FWHM is observed at the beginning of hard X-ray phase. This shows presence of substantial nonthermal turbulence fading away during the decay phase.
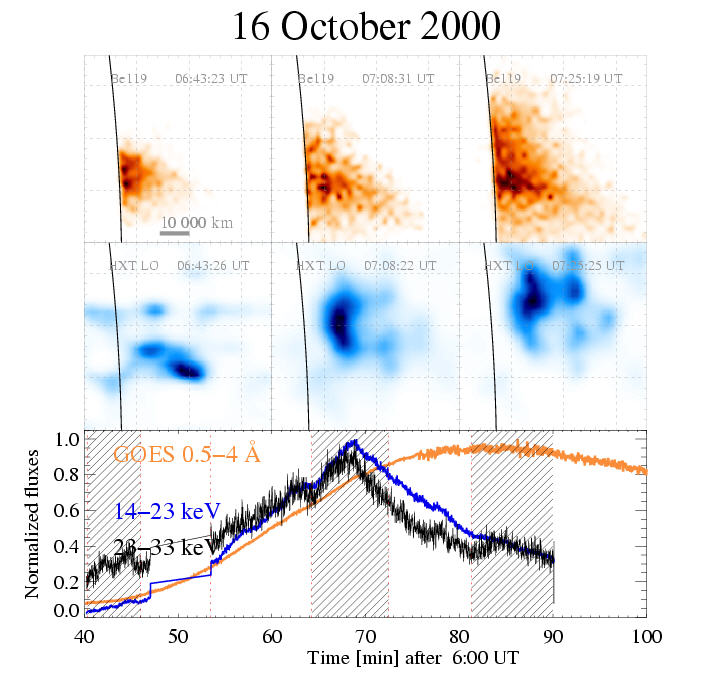
Figure 6: The composite showing SXT Be119 deconvolved images (top row) and corresponding (close in time) MEM reconstructed LO HXT images (middle row) for three intervals corresponding to the rise, maximum and decay phase of the second event. The soft (GOES 0.5 Å - 4 Å ) and hard (HXT LO and M1) X-ray lightcurves are displayed in the bottom row. In order for the hard X-ray flux variations to become visible, here we normalised the lightcurves to their respective maxima within the interval shown.
Corresponding analysis have been carried out for the second flare observed as more intense in soft X-rays. This flare took place in the same area at ~06:40 UT. As the flare initial brightening took place in the same place where the final brightening has been observed for the first flare, it appears possible that part of the plasma did not have time to cool after the first flare. Respective GOES and HXT lightcurves are shown in the bottom panel of Figure 6. The hatched areas mark time intervals used for HXT image reconstruction. During the initial phase of this flare, the SXT source appears as pair of compact kernels separated by ~5 200 km located at the base of a mound-shaped emission patch. Each kernel is of diameter of ~1 200 km. The maximum of soft X-ray emission for this flare has been observed at ~ 07:28 UT while the corresponding hard X-ray peak precedes the soft X-ray maximum by as much as ~20 minutes. It is seen from the Figure that for ~50 minutes which passed from the beginning to the end of the flare (as seen on available SXT images) the emission pattern didn't change as much as in the case of the first flare. Two compact kernels seen at the beginning just above the limb evolved into one diffused configuration concentrated around the southern footpoint. The soft X-ray emission is composed of many individual kernels which change their positions in the restricted area. On the Al12 images the displacement of maximum brightness location is observed to take place mostly vertically (by ~14 arcsec, see Figure 8). For better visualisation the reader is referred to the colour animation available at: www.cbk.pan.wroc.pl/publications/2003/ cme_accomp_flare/al_cont_085_B.avi. This flare was not so dynamic as the first one.
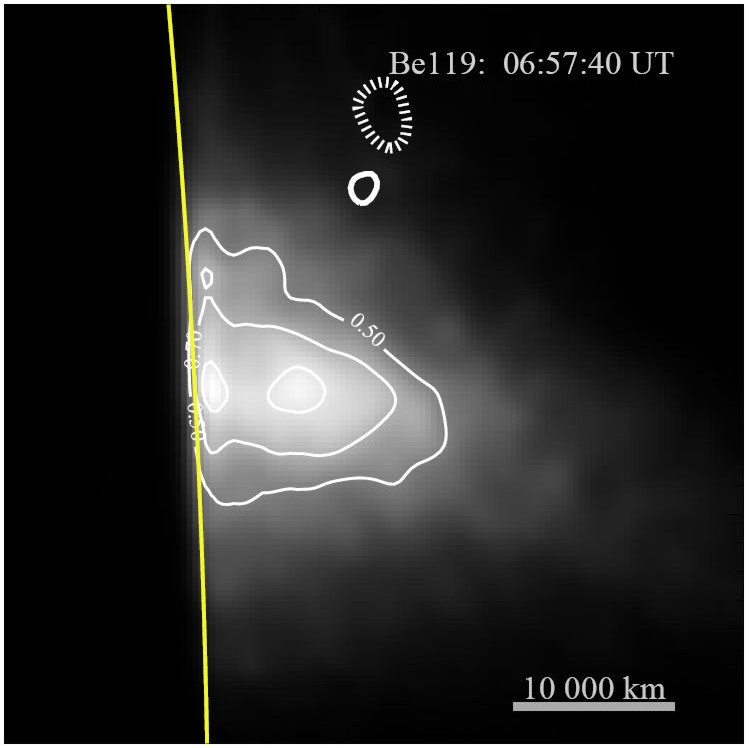
Figure 7: Overlay of three simultaneously observed emission patterns for the rise phase (at ~06:57:40 UT) of the second flare. The deconvolved SXT Be119 emission is placed as background with the white thin contours drawn at the indicated levels. Dashed and solid white contours represent position of the HXT LO and M1 emission kernels.
Rather thermal in spectral appearance hard X-ray emission (HXT LO channel) is located substantially away from the position of soft X-ray emission. This is well seen in Figure 7. It is seen that well into the rise of this flare (06:57:40 UT) the soft X-ray emission is dominated by two compact kernels placed vertically at the distance of ~5 000 km. The lower kernel appears to be located just over the limb. The hard X-ray patches are situated ~20 000 km to the North-West relative to the upper soft X-ray kernel. This is obviously much more than the uncertainty of the SXT and HXT image coalignment. Therefore the pattern observed indicates again that the plasma contributing to SXT Be119 and HXT LO and M1 emissions although thermal in character is located at the separate volumes. This is difficult to interpret based on commonly accepted scenarios for the flare process.
Results of spectral analysis (BCS) for this flare are shown in Figure 9. The Figure comprises three panels organised in the pattern resembling that from Figure 5 for the first flare. The gradual (thermal) character of the second flare is seen from the upper panel where the hard and soft X-ray emission slopes (on the normalised lightcurves) appear the same. It is also seen that, in contrary to the first flare, the second flare is of long duration character with the hard X-ray emission present for ~30 minutes. During this time the line position of the coolest resonance line seen by BCS (S XV ion) is hardly changing at all (see the middle panel). At the same time the two hotter lines (related with Fe XXV and Ca XIX ions respectively) show opposite trends (towards the blue and red) in their line shifts. From the start the iron line indicates for its position at the bin ~0.4 while the calcium line at the bin -1.3. When transformed to velocities, this gives -20 km/s and 25 km/s respectively. Five minutes later the iron line shift changes the sign and at 06:50 UT reaches maximum velocity of 40 km/s. This is much smaller value in comparison with what was observed for the first flare. Towards the end of this flare all velocities converge to zero (as expected for the plasma being at rest after the flare).
Overall this pattern of behaviour constitutes a surprising set of observations, not easy to interpret. This observation can not be reconciled in the model of common origin of Fe XXV, Ca XIX emission. One of the possible interpretations could be that the kernels contributing to the Fe XXV, Ca XIX spectra are physically separate initially, moving with different velocities respective to the observer.
As concerns the turbulent motions as deduced from the lines' FWHM time behaviour (see the bottom panel of Figure 9) one can see that no substantial changes are seen in the line of S XV ion. The resonance line widths of Fe XXV, Ca XIX indicate for the presence of turbulent motions during the hard X-ray rise phase. The interpretation of these observed variations is somewhat risky as the second flare was so strong in soft X-rays that BCS instrumental effects (line narrowing) may bias the results.
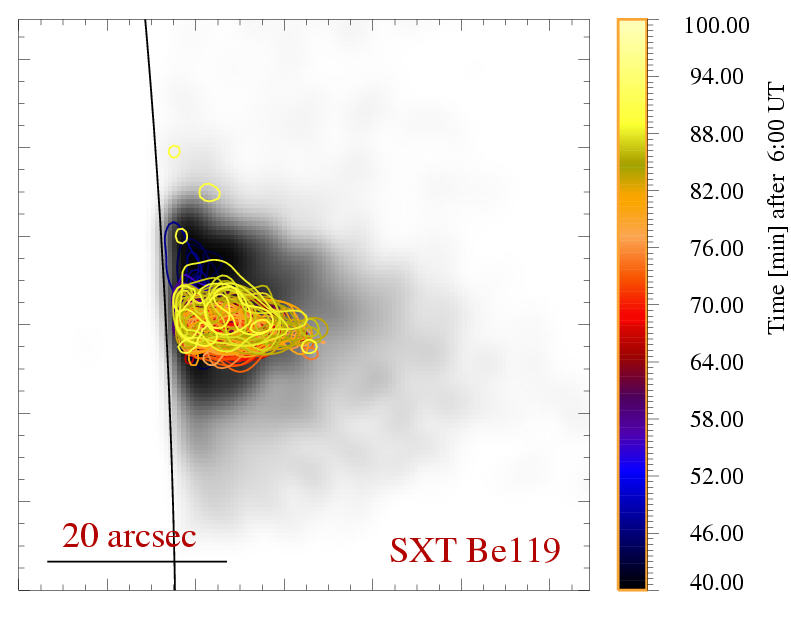
Figure 8: The evolution of maximum brightness location (contours drawn at 0.85 of maximum intensity) for consecutive frames of Al12 deconvolved images. The contours are overlaid atop the emission pattern (in grey) of the first unsaturated Al12 image. This composite image corresponds to that presented in Figure 4 for the first flare.
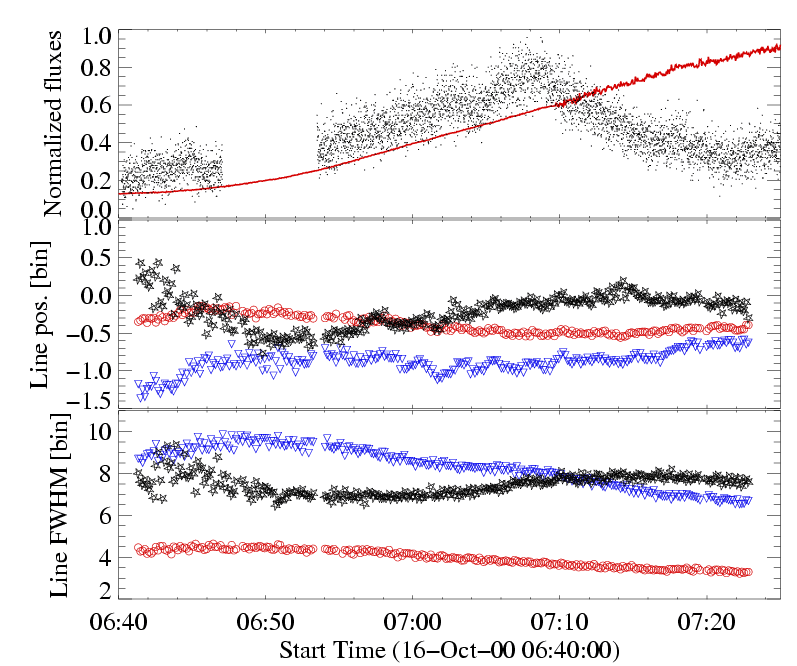
Figure 9: Results of analysis of the BCS spectra for the second flare. In the top panel the time variations of GOES 1 Å - 8 Å emission (smooth curve) and HXT M1 emission are shown. The lightcurves are normalised over the time interval shown. In the middle panel the central positions of resonance lines for Fe XXV (asterisks), Ca XIX (reversed triangles) and S XV ions (circles) are displayed. In the bottom panel the corresponding variations of lines' widths are shown.
Based on the analysis of deconvolved SXT and MEM reconstructed HXT images for the event consisting of two over-the-limb flares from the same active region, a number of following remarks have been drawn:
The reader is referred to the colour version of the Figures presented in this paper. They are available at: www.cbk.pan.wroc.pl/publications/2003/cme_accomp_flare where also appropriate animations are ready for download.
This work has been supported by the Grants 2.P03D.024.17 and PBZ-KBN-054/P03/2001 of Polish Committee for Scientific Research. We acknowledge the SURF for providing data for use in this publication.