RESIK is one of several instruments aboard the CORONAS-F mission managed by IZMIRAN Institute in Russia. The spacecraft orbit is circular (500 km), polar, and Sun-synchronous. Data from the spacecraft are down-loaded to Neustrelitz (Germany). The commanding and uploads are done from the tracking station at the Troitsk (Moscow Region) EOF. The spacecraft is pointed to within 10 arcmin of Sun centre, with a roll stability of 3 arcsec/s. RESIK is co-aligned with the spacecraft Sun-pointing axis. As it has no collimator, flares occurring anywhere on the Sun will give rise to line emission in the detectors. The dispersion axis of the RESIK crystals varies according to the roll angle for any occasion. Possible confusion results in the observed spectra if there are two or more flares or bright active regions on the Sun. Roll angle information is provided to the Space Research Center in Wroclaw by the SPIRIT Team from Lebedev Physical Institute, Moscow.
For exceptionally large flares (X1 and above), the RESIK detectors are saturated for short periods near flare maxima. However, for the most part spectra are successfully observed for all phases of flares, active regions and non flaring corona, usually referred to as ''quiet''. In the rest of this contribution, we will show example spectra obtained at various levels of solar activity and present a tentative list of spectral lines yet identified. The spectra shown are corrected for orbital background and ''notches", features which result from the detector readout and which strongly influence the appearance of observed spectra.
We hope that the results shown below will attract the attention of the solar and atomic physics community which will result in future collaborations. RESIK data are in the public domain, available for download from http://surfwww.mssl.ucl.ac.uk/surf/data_request.html.
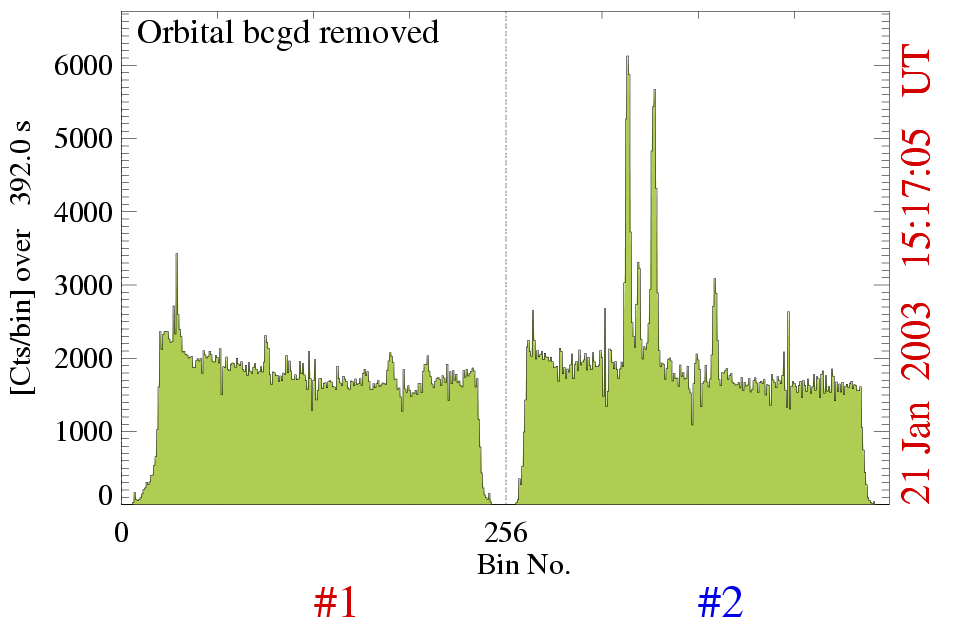
Another instrumental effect encountered in RESIK is the so-called notch. The position of a photon in the detector is calculated from the signals measured on the two wedges of the wedge-and- wedge cathode. In the electronics this calculation is done using a look-up table held in ROM. Because of the quantized nature of this digital technique, spikes and dips are seen in what should be a flat field. No photons are lost, they are merely displaced into adjacent bins. The total spectral intensity over small ranges is not affected, but the shape of the spectrum may be substantially influenced. An illustration is shown in Figures 1 and 2. Channel #1 and #2 spectra are shown as the notch effect is largest for them. Notch corrections are dependent on the setting of the detectors at the time of observation. Over the period since launch, many different settings have been used to minimize the amount of silicon fluorescence radiation which is produced by illumination of the crystals by solar X-rays. Optimal settings of the detector high voltages and amplitude discrimination were finally achieved in late 2002. We will only show spectra from this period in this presentation.
Figure 1: Example of the 21 January 2003 rise phase spectrum corrected for the background only. The spectra are affected by ``notches" resulting from detector readout and are occuring approximately every 64th bin.
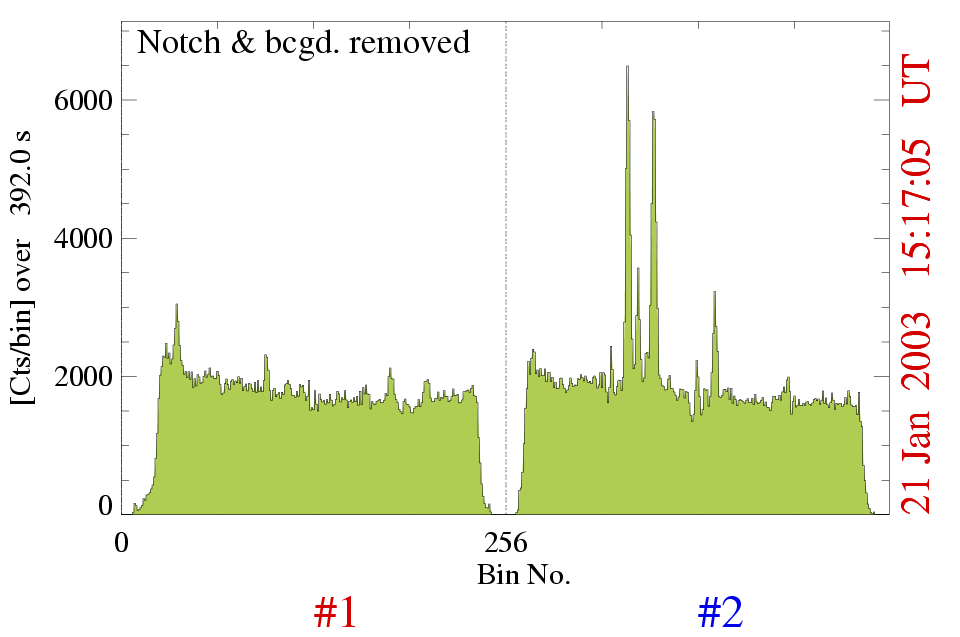
Figure 2: The same spectrum as in Figure 1 with the notch instrumental effects removed. Modelling of the optimum notch correction is complicated as the effect is non-linear. In the example shown the first complete model of the notch correction has been used, so some uncorrected residuals are still present. Work on this is in progress.
In designing RESIK, we had to trade instrument sensitivity with wavelength coverage. As we were more concerned to cover a large wavelength range, we compromised somewhat on sensitivity, although RESIK is still much more sensitive than, e.g., the scanning flat crystal spectrometers which covered the same wavelength range on SMM. The slightly reduced sensitivity meant that a fixed data gathering interval (DGI) of a few seconds would have resulted in only a few hundred counts in over one thousand spectral bins. We therefore arranged for the DGI to be dynamically determined by the onboard computer (COMP) according to the level of solar X-ray emission in order to maintain count statistics. Thus, the DGI decreased from 5 minutes during the rise of large (X- class) flares, to only 1 s at flare maximum. For the purposes of line identification, we decided to build-up a composite normalized spectrum containing records from the entire duration of the rise phase of typical flare. In order to obtain spectra with approximately equal statistical significance, we formed a composite spectrum comprising data obtained over the entire rise of typical flare. We removed background, corrected for notch and normalised spectra to maximum line intensity, before adding to the composite. In this way, all lines making their most significant contributions at various moments during the rise can be more easily seen. However, this means that line intensities cannot be compared quantitatively. Since RESIK is pointed towards the centre of the solar disk, and its dispersion axis can assume any direction relative to solar coordinate system, the wavelength coverage of the recorded spectra depend on the flare's heliographic coordinates. For purposes of the line identification, we have selected the (East) limb flare of M1.9 class (start: 14:59 UT, max: 15:26 UT, end: 15:52 UT). This was one of only a few flares with spectra down to very small wavelengths, so rather unusually we recorded, e.g. the Ar XVII 3.367 Å line. The composite spectrum, made up of 120 individual records and normalized to maximum intensity, is shown in Figure 3. A label is shown above each spectral feature we believe to be of solar (not instrumental) origin which is identified by ion and transition in Table 1. The identifications were made having in mind the expected composition of the flare plasma and the expected temperature (between 5 and 25 MK). For some features like Ar XVII and S XV triplets, and a number of strong 1s2-1s(np) transitions the identification was obvious. Using theoretical wavelengths of these lines which can definitely be identified and are strong resonance lines, we determined the "observed'' wavelengths of other lines by linear interpolation. This is justified as a first approximation, as the dispersion of RESIK is quite linear in the central part of each channel. We have extensive laboratory calibration data but they still await detailed analysis. Some 34 line features are identified in Table 1. Many of the lines have never been seen in solar flare (or any other non-terrestrial source) before.
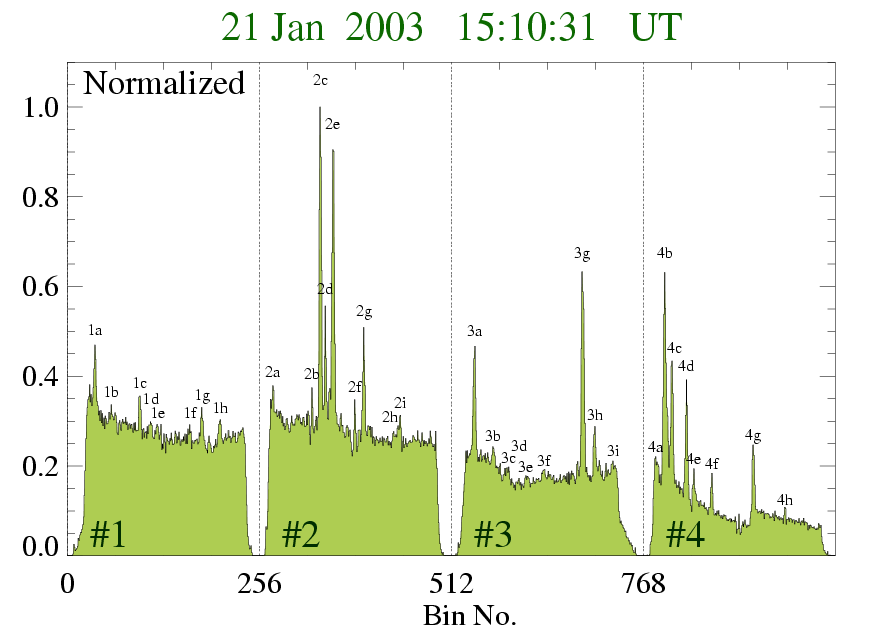
Figure 3: Example RESIK spectrum in the wavelength range between 3.35 Å and 6.15 Å . The spectrum has been collected during ~ 20 min over the rise phase of M1.9 (S07 E90) limb flare. In order to present all the lines having different relative intensities (as the flare builds-up), we decided to normalise each collected spectrum to its maximum before averaging. This means that each spectrum coming into the sum shown has equal weight independent of momentary intensity. The key numbers placed above each significant spectral feature correspond to respective entries in Table 1. We have not designated with key numbers these spectral features which are believed to be of instrumental origin.
| Key | l [Å] | Ion | Transition |
| Ch. #1 | |||
| 1a | 3.367 | Ar XVII | 1s2 1S0 - 1s3p (1,3)P1 |
| 1b | 3.422 | ? | |
| 1c | 3.532* | K XVIII | 1s2 1S0 - 1s2p 1P1 |
| 1d | 3.548 | K XVIII | 1s2 1S0 - 1s2p 3P1,2 |
| 1e | 3.571 | K XVIII | 1s2 1S0 - 1s2s 3S1 |
| 1f | 3.689 | S XVI (?) | 1s 2S1/2 - 5p 2P3/2,1/2 |
| 1g | 3.733* | Ar XVIII | 1s 2S1/2 - 2p 2P3/2,1/2 |
| 1h | 3.798 | S XVI (?) | 1s 2S1/2 - 4p 2P3/2,1/2 |
| Ch. #2 | |||
| 2a | 3.805 | S XVI (?) | 1s 2S1/2 - 4p 2P3/2,1/2 |
| 2b | 3.919 | ? | |
| 2c | 3.949* | Ar XVII | 1s2 1S0 - 1s2p 1P1 |
| 2d | 3.967 | Ar XVII | 1s2 1S0 - 1s2p 3P1,2 |
| 2e | 3.994 | Ar XVII | 1s2 1S0 - 1s2s 3S1 |
| 2f | 4.055 | ? | |
| 2g | 4.088* | S XV | 1s2 1S0 - 1s4p 1P1 |
| 2h | 4.186 | Cl XVII | 1s 2S1/2 - 2p 2P3/2,1/2 |
| 2i | 4.197 | ? | ? |
| 2j | 4.299* | S xv | 1s2 1S0 - 1s3p 1P1 |
| Ch. #3 | |||
| 3a | 4.299* | S xv | 1s2 1S0 - 1s3p 1P1 |
| 3b | 4.376 | ? | |
| 3c | 4.444 | Cl XVI | 1s2 1S0 - 1s2p 1P1 |
| 3d | 4.466 | Cl XVI | 1s2 1S0 - 1s2p 3P1,2 |
| 3e | 4.496 | Cl XVI | 1s2 1S0 - 1s2s 3S1 |
| 3f | 4.578 | ? | |
| 3g | 4.729* | S XVI | 1s 2S1/2 - 2p 2P3/2,1/2 |
| 3h | 4.775 | ? | |
| 3i | 4.855 | Si XVI | 1s 2S1/2 - 5p 2P3/2,1/2 |
| Ch. #4 | |||
| 4a | 4.968 | Si XVI | 1s 2S1/2 - 4p 2P3/2,1/2 |
| 4b | 5.039* | S XV | 1s2 1S0 - 1s2p 1P1 |
| 4c | 5.102 | S XV | 1s2 1S0 - 1s2s 3S1 |
| 4d | 5.194 | Si XIV | 1s 2S1/2 - 3p 2P3/2,1/2 |
| 4e | 5.253 | Si XIII | 1s2 1S0 - 1s5p 1P1 |
| 4f | 5.384 | Si XIII | 1s2 1S0 - 1s4p 1P1 |
| 4g | 5.681* | Si XIII | 1s2 1S0 - 1s3p 1P1 |
| 4h | 5.919 | Si XII d | 1s22p 2P3/2- |
| - 1s2p (3P)3p 2D5/2 |
Since the exact position of spectral lines depends on solar location, the S XV line (2j, 3a) sometimes appears in channel #2 (2j), at other times in channel #3 (3a). Normally, the optical axis of RESIK lies within 5 arcmin of Sun center, and the dispersion direction varies with a timescale of months according to the spacecraft orientation.
Several large flares observed in the first 18 months of RESIK operation have detectable K XVIII and Ar XVIII line emission above the flare continuum, the first time these solar lines have been seen (Sylwester et. al., 2002; Phillips et. al., 2003). There is in fact only one other X-ray potassium line observation for the solar corona (Doschek, Feldman, & Seely 1985).
Note that the line identifications presented here are still tentative and await further analysis which is continuing at present.
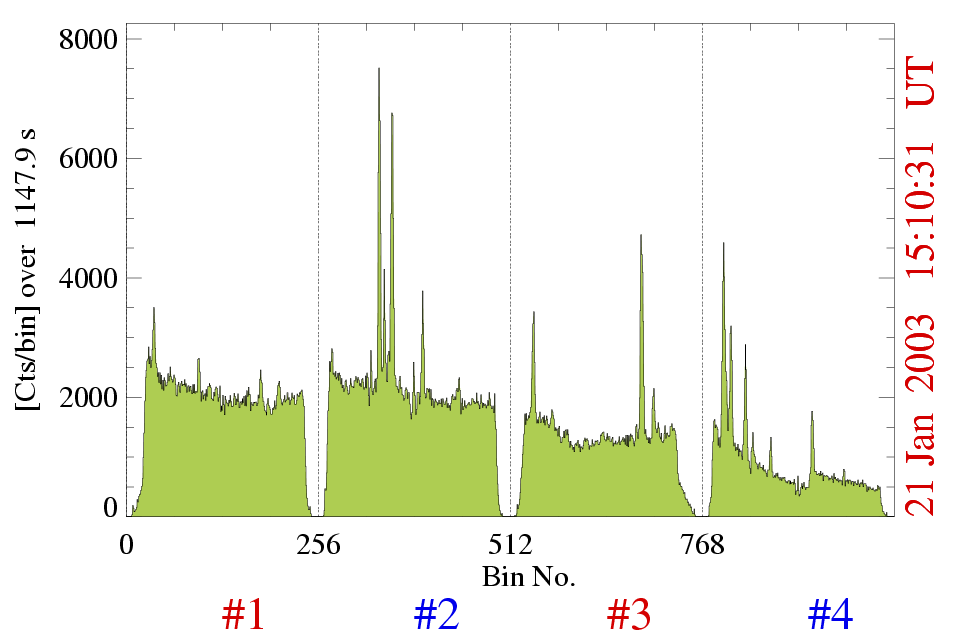
Figure 4: Integrated (NOT-normalized) spectrum corresponding to that presented in Figure 3. The GOES level (during integration between 15:01 UT and 15:19 UT) was ~ M2. Note the slope of the continuum here and in the following Figures.
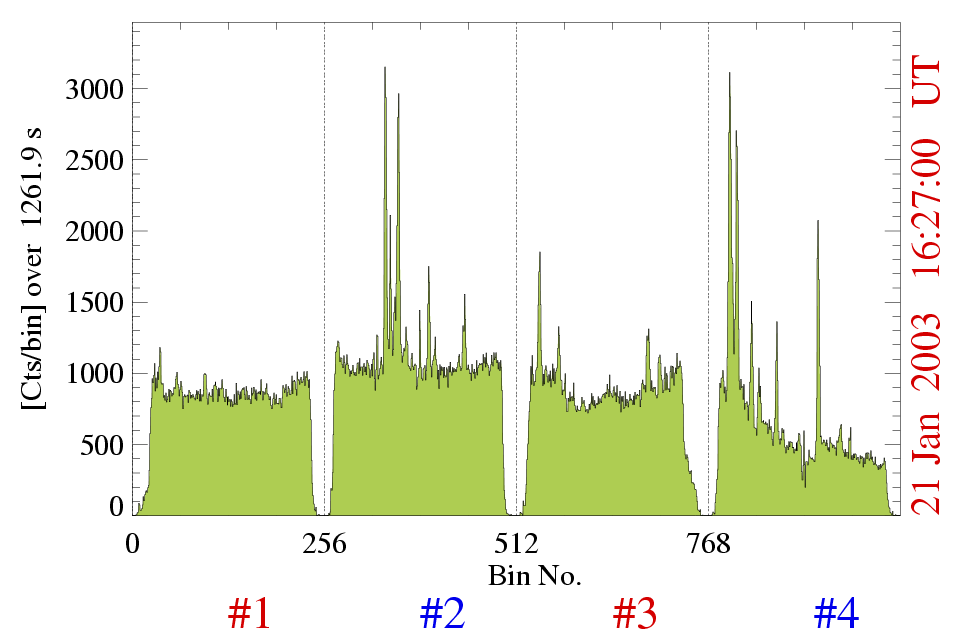
Figure 5: The same flare (21 January 2003). The spectrum has been integrated during the decay phase (16:16 UT - 16:38 UT). Corresponding GOES level was C4.
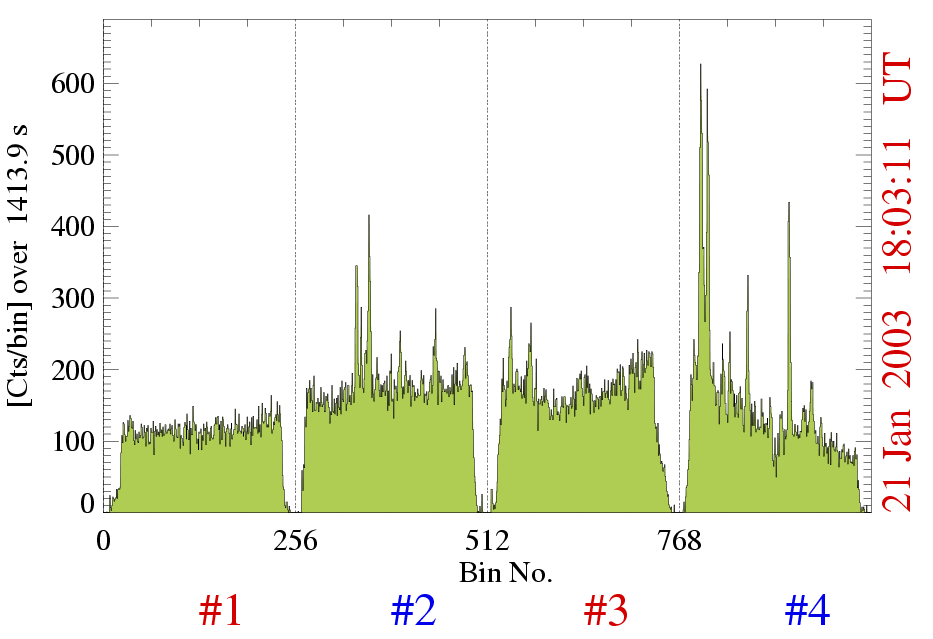
Figure 6: The same flare (21 January 2003). The spectrum has been integrated towards the end of this event (17:48 UT - 18:15 UT). Corresponding GOES level was B8.
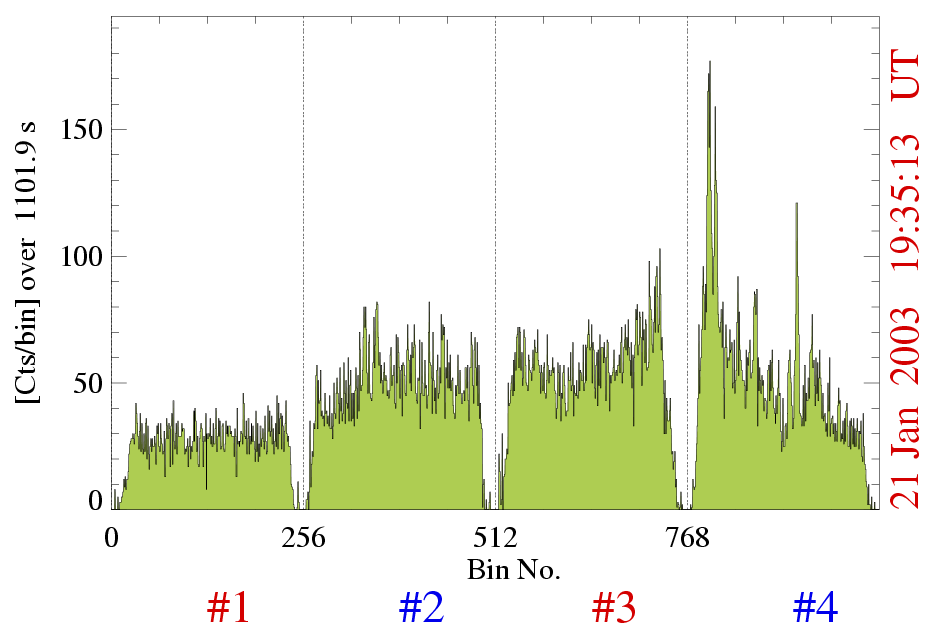
Figure 7: Example of the RESIK spectrum representative for active, but non-flaring Sun. The X-ray activity was at the B7 GOES level. The spectrum has been integrated over time interval from 19:26 UT to 19:46 UT on 21 January 2003.
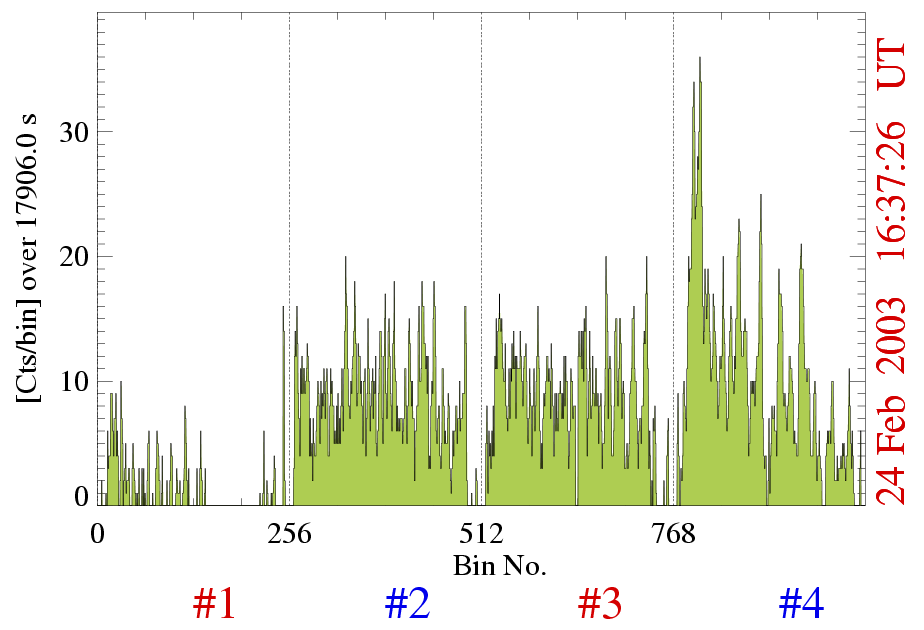
Figure 8: Example of the RESIK spectrum collected over particularly quiet activity period (between 15:50 UT and 17:40 UT on 24 February 2003). During this interval GOES records show no flaring activity and the overall level of X-ray emission is the lowest (B1 - B2) since the beginning of 2003.
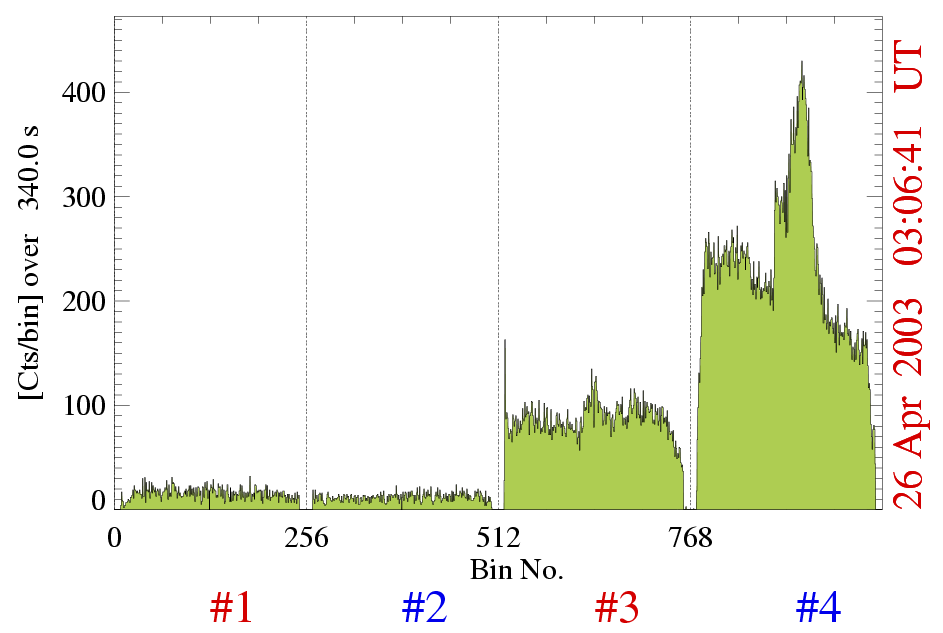
Figure 9: Example of the RESIK spectrum seen in third order reflection during maximum phase of M1.2 flare on 26 April 2003. Note, that in channels #1 and #2 only a week signal coming from high energy (E~8-10 keV) continuum is seen. In channel #3 some line features are visible on top of the continuum, while in channel #4, a clear spectrum of the Fe XXV He-like ion line complex is undoubtedly present.
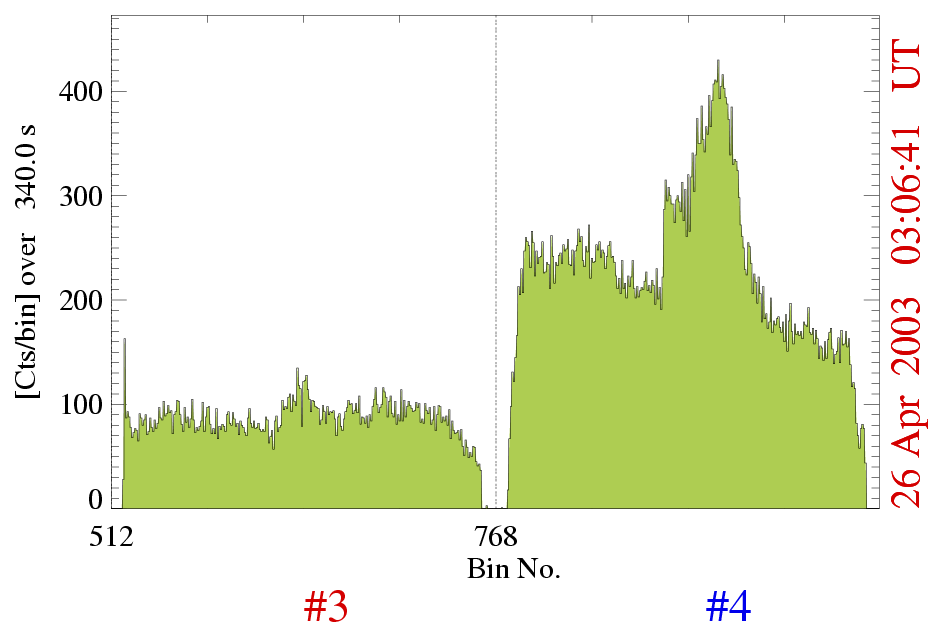
Figure 10: Enlargement (of Figure 9) showing the channel #3 and channel #4 spectra seen by RESIK in third order reflection. We are working at present on the identification of individual line groups seen. It is possible, that the spectral features seen in Channel #3 contain contribution not only from transitions in iron, but also from highly ionised nickel.
The RESIK instrument has been extremely successful in obtaining unique solar flare X-ray spectra. Several hundred thousand spectra have been collected in the soft X-ray wavelength range. This range has never been systematically investigated before. Tens of yet unseen solar spectral emission lines have been observed and tentatively identified. Among them many belong to the Lyman series of hydrogenic Si, S, and Ar ions. The relative line intensities are seen to vary on the spectra, sometimes by a factor of several times, as the flare evolve. In the longest wavelength spectral channel (between 5 Å and 6 Å) emission lines are always observed, even during periods of low overall solar activity. The pattern of spectral variability presented here indicates that the main scientific goal of the experiment: ''Determination of coronal plasma composition'' is quite within reach. However, this will necessitate further work on the absolute calibration of the spectrometer.
We strongly encourage interested people to work with RESIK data, as the Wrocaw experiment team is presently overwhelmed with the calibration and software development work.
The present work has been supported from the grant 2.P03D.002.22 of the Polish Committee for Scientific Research.