ApJ, 589:L113-L116, 2003 June 1
SOLAR FLARE ABUNDANCES OF POTASSIUM, ARGON, AND SULPHUR
National Research Council Senior Research Associate, NASA Goddard Space Flight Center, Code 682, Greenbelt, MD 20771
Space Research Centre, Polish Academy of Sciences, Ul. Kopernika 11, PL-51-622 Wroclaw, Poland
AND
Artep, Inc., Ellicott City, MD 21042; and E. O. Hulburt Center for Space Research, US Naval Research Laboratory,
Washington, DC 20375; Received 2003 April 3; accepted 2003 April 17; published 2003 April 23
ABSTRACT
The absolute abundance of potassium has been determined for the first time from X-ray solar flare line and continuum spectra. The absolute and relative abundances of Ar and S have also been determined. Assuming that the flare plasma is coronal, and since potassium has the lowest first ionization potential (FIP) of any common element on the Sun, this determination is of importance in the continuing debate concerning the nature of the coronal/photospheric element abundance ratios, which are widely considered to depend on the FIP. The measurements were made with the RESIK crystal spectrometer on the
Coronas-F spacecraft. A differential emission measure DEM ![]() exp (-ßTe) was found to be the most consistent with the data of three models considered. We find that the K/H abundance ratio is (3.7 ± 1.0) x
10-7, a factor of 3 times photospheric. Our measured values of the Ar/H ratio, (2.8 ± 0.2) x
10-6, and of the S/H ratio, (2.2 ± 0.4) x 10-5, are equal to previous coronal and photospheric determinations to within uncertainties. These measurements therefore fit a pattern in which low-FIP elements are enriched in the corona by a factor 3 and in which high-FIP elements (including S) have equal coronal and photospheric abundances.
exp (-ßTe) was found to be the most consistent with the data of three models considered. We find that the K/H abundance ratio is (3.7 ± 1.0) x
10-7, a factor of 3 times photospheric. Our measured values of the Ar/H ratio, (2.8 ± 0.2) x
10-6, and of the S/H ratio, (2.2 ± 0.4) x 10-5, are equal to previous coronal and photospheric determinations to within uncertainties. These measurements therefore fit a pattern in which low-FIP elements are enriched in the corona by a factor 3 and in which high-FIP elements (including S) have equal coronal and photospheric abundances.
Subject headings: Sun: abundances — Sun: corona — Sun: flares — Sun: X-rays, gamma rays
1. INTRODUCTION
In recent years, measurements of solar gamma-ray line emission, solar energetic particles, and X-ray and ultraviolet line emission have indicated that the coronal abundances of elements with low first ionization potentials (FIPs < 10 eV) in the solar corona are higher than corresponding photospheric abundances by a factor of about 3 but that high-FIP elements have coronal and photospheric abundances that are approximately equal. This is the so-called FIP effect (Feldman & Laming 2000). In this Letter, we report on measurements during long-duration solar flares of X-ray lines emitted by potassium, argon, and sulphur ions, which, together with X-ray continuum measurements, allow both relative and absolute abundances of these elements to be determined. Assuming the flare plasma to be coronal in origin, our determination of the absolute K abundance is the first ever made. In addition, the abundance of K relative to Ar through line-to-line intensity ratios should be the best available since, unlike previous spectra, the lines are fairly strong and were measured several times over periods of hours during the decay of each flare. This K abundance determination is of importance in discussions of the FIP effect since potassium has the lowest FIP of any common element on the Sun. The elements K, Ar, and S represented in our spectra in fact have a very wide range of FIPs (K: 4.34 eV, Ar: 15.76 eV, and S: 10.36 eV), allowing us to discriminate between various models of the FIP effect that predict different FIP dependences of the coronal/photospheric abundance ratios.
The observations were made with the REntgenowsky Spek-trometr s Izognutymi Kristalami (RESIK) instrument on the Russian Coronas-F mission, launched on 2001 July 31. Table 1 summarizes instrumental details of RESIK, which is described further by Sylwester et al. (2002) and J. Sylwester et al. (2003, in preparation). The instrument consists of two uncollimated
crystal spectrometers (A and B), each having a double position-sensitive proportional counter that detects solar X-rays Bragg-diffracted by two crystals. Each crystal is slightly bent convex so that the Bragg condition
![]() sin
sin ![]() (where
(where
![]() is the Bragg angle, n is the diffraction order, and d is the crystal lattice spacing) varies across the crystal face. A spectrum from each of the four wavelength ranges is measured over a data-gathering time interval of 2 s. Channel 1 includes the
1s2-lsnl (nl — 2s, 2p) lines of He-like K (K XVIII,
is the Bragg angle, n is the diffraction order, and d is the crystal lattice spacing) varies across the crystal face. A spectrum from each of the four wavelength ranges is measured over a data-gathering time interval of 2 s. Channel 1 includes the
1s2-lsnl (nl — 2s, 2p) lines of He-like K (K XVIII,
![]() ) and the
) and the
![]() (Is 2Sl/2-2p
2Pl/2, 3/2) doublet of hydrogen-like Ar (Ar XVIII
,
(Is 2Sl/2-2p
2Pl/2, 3/2) doublet of hydrogen-like Ar (Ar XVIII
, ![]() ). Channel 2 includes the
1s2-lsnl lines of He-like Ar
). Channel 2 includes the
1s2-lsnl lines of He-like Ar ![]() and the
1s2-ls3p, 1s2-ls4p`resonance lines of He-like S (S XV,
and the
1s2-ls3p, 1s2-ls4p`resonance lines of He-like S (S XV,
![]() and
and
![]() , respectively). Since RESIK has no collimator, the exact location of spectral lines in the detector range depends on the position of the emitting source on the Sun. For some flares, the S
XV
, respectively). Since RESIK has no collimator, the exact location of spectral lines in the detector range depends on the position of the emitting source on the Sun. For some flares, the S
XV ![]() line is outside the range of channel 2. Normally, the optical axis of RESIK lies within 5' of Sun center, and the dispersion direction varies with a timescale of months according to the spacecraft's orientation.
line is outside the range of channel 2. Normally, the optical axis of RESIK lies within 5' of Sun center, and the dispersion direction varies with a timescale of months according to the spacecraft's orientation.
Several large flares observed in the first 18 months of RESIK's operation have detectable K
XVIII and Ar XVIII
line emission above the flare continuum, the first time these solar lines have been seen. There is in fact only one other X-ray potassium line observation (of the
1s2 lS0-ls3p 1P1 line at 3.01
Å) to our knowledge (Doschek, Feldman, & Seely 1985).
An accurate sensitivity calibration of RESIK is still in progress. However, since the instrumental sensitivity is fairly constant over the narrow wavelength range of each channel, we have been able, with assumptions about the flare emission's temperature structure, to find the Ar/K and Ar/S abundance ratios from the line flux ratios K
XVIII/Ar XVIII
and Ar XVII/S XV, respectively. Channels 1 and 2 observe the solar continuum with little
TABLE 1 RESIK INSTRUMENT PARAMETERS
|
CHANNEL |
||||
| PARAMETER | 1 | 2 | 3 | 4 |
| Wavelength range (Å)a,b | 3.37-3.88 | 3.82-4.33 | 4.31-4.89 | 4.96-6.09 |
| Crystal and plane | Si 111 | Si 111 | Quartz |
Quartz |
| 2d spacing (Å) | 6.27 | 6.27 | 8.51 | 8.51 |
| Peak reflectivityb (%) | 51 | 36 | 24 | 13 |
| Rocking curve FWHMb (mÅ) | 0.427 | 0.543 | 0.446 | 0.619 |
| Spectrometer | A | B | A | B |
| Principal lines in range | Ar XVIII, K XVIII | Ar XVIII, S XV | S XVI | S XV, Si XIV, Si XIII |
a Wavelength ranges are for an on-axis source.
b For first-order diffraction.
or no instrumental background, enabling us to measure line-to-continuum ratios from which Ar/H and S/H abundance ratios are derived. In this Letter, we report on these abundance determinations and comment on their relevance to the FIP effect.
2. OBSERVATIONS AND ANALYSIS
RESIK spectra were recorded in 4-24 minute time blocks separated by intervals between a few minutes and over an hour. Four long-duration flares with peak GOES intensities of M or larger were selected, where line fluxes were measured many times over periods of hours. The flare with the best coverage occurred on 2002 July 26/27 with intermittent RESIK observations from July 26 at 21:11 UT to July 27 at 04:06 UT For the other flares, all in 2002, RESIK observations covered the following times: April 14 22:30 UT to April 15 07:30 UT; July 11 14:45-19:20 UT; July 22 23:20 UT to July 23 05:45 UT. Strong Ar
XVII and S XV line emission was detected by RESIK throughout these periods, but the K
XVIII lines were only observed when the solar X-ray emission was above GOES class C4, and Ar
XVII lines above Ml. Total count rates in the line profiles were determined by iteratively fitting the profiles with Gaussians on a linearly sloping background. Gaussians are not strictly appropriate since the line profiles are a convolution of the true solar profile (thermal Doppler plus any nonthermal broadening) and an instrumental profile determined from pre-launch measurements to be non-Gaussian. However, the goodness of fit in each case had an acceptably small reduced
x2 so that Gaussians are adequate in practice.
We define a spectral line contribution function G(Te) by
where N2 is the number density (in units of cm-3) of ions in the upper energy level 2,
A21 is the spontaneous transition probability from level 2 to the ground level (1),
Ne, is the electron density, N(E)/N(H) is the abundance of element E with respect to hydrogen, and
Nion/N(E) is the fractional abundance of the emitting ion.
Taking the soft X-ray flare emission to be isothermal has sometimes been found to be a good approximation (Landi et al. 2003; Feldman et al. 2003), but an analysis with a temperature-dependent differential emission
measureDEM(Te = ![]() Ne2 dV/dTe (where
Ne is the electron density and V is the emitting volume) is likely to be an improvement. In our analysis, we assumed three forms for the temperature distribution: (A) isothermal plasma with temperature
Te, (B) DEM =
Ne2 dV/dTe (where
Ne is the electron density and V is the emitting volume) is likely to be an improvement. In our analysis, we assumed three forms for the temperature distribution: (A) isothermal plasma with temperature
Te, (B) DEM = ![]() Te-
Te-![]() , and (C) DEM =
, and (C) DEM =
![]() exp (-
exp (-![]() Te), where
Te), where
![]() and
and ![]() (>0) in forms B and C are free parameters. Any temperature-dependent flux ratio of lines of the same element observed by RESIK can be used to determine
Te in model A and
(>0) in forms B and C are free parameters. Any temperature-dependent flux ratio of lines of the same element observed by RESIK can be used to determine
Te in model A and ![]() in models B and C. (The parameter a is not determined.) The Ar XVII lines are available for this, but the temperature dependence is stronger for the ratio
Rsi, defined by the sum of the fluxes in the Si XIII
1s2-ls3p and 1s2-ls4p lines (
in models B and C. (The parameter a is not determined.) The Ar XVII lines are available for this, but the temperature dependence is stronger for the ratio
Rsi, defined by the sum of the fluxes in the Si XIII
1s2-ls3p and 1s2-ls4p lines (![]() ,
,
![]() ) divided by the flux in the Si
XIV ls-3p line
) divided by the flux in the Si
XIV ls-3p line ![]() . For the isothermal model A,
Te can be obtained by setting the observed ratio Rsi to the ratio of the summed contribution functions of the Si
XIII lines Gl to the contribution function
G2 of the Si XIV line evaluated at
Te. For nonisothermal models, e.g., model B, Rsi is given by
. For the isothermal model A,
Te can be obtained by setting the observed ratio Rsi to the ratio of the summed contribution functions of the Si
XIII lines Gl to the contribution function
G2 of the Si XIV line evaluated at
Te. For nonisothermal models, e.g., model B, Rsi is given by
A corresponding expression applies to model C. We used the CHIANTI code (Dere et al. 1997; Young et al. 2003) to determine
Gl and G2 with ionization fractions
Nion/N(E) from Mazzotta et al. (1998) and hence determine Rsi as a function of
![]() . The contribution functions of Mewe, Gronenschild, & van den Oord (1985) have a very similar temperature dependence. For each RESIK data block, values of
`Te and
. The contribution functions of Mewe, Gronenschild, & van den Oord (1985) have a very similar temperature dependence. For each RESIK data block, values of
`Te and ![]() were derived from the observed Rsi according to the emission model assumed.
were derived from the observed Rsi according to the emission model assumed.
For the isothermal model A, we calculated expected ratios from Rexp =
G3(Te)/G4(Te), where G3 and
G4 are the contribution functions of the Ar XVIII
and K XVIII lines and Te is the temperature derived from
Rsi. For models B and C, the expected Ar XVIII/KXVIII ratio is
Again, we used the CHIANTI code for the contribution functions with the Mazzotta et al. (1998) ionization fractions and assumed coronal abundances Ar/H = 3.8 x 10⁻⁶, S/H = 1.9 x 10⁻⁵, and K/H = 4.7 x 10⁻⁷ taken from Feldman & Laming (2000) and Landi, Feldman, & Dere (2002). The atomic data for K XVIII are not available in the literature, so we interpolated them from atomic data for other He-like ions in the CHIANTI database. (The K XVIII data will be included in the next CHIANTI release.) The contribution functions of Mewe et al. (1985) are different from these only by constant factors corresponding to the cosmic abundances used in that work. If models A-C accurately describe the flare's temperature structure, any differences between observed line flux ratios Robs
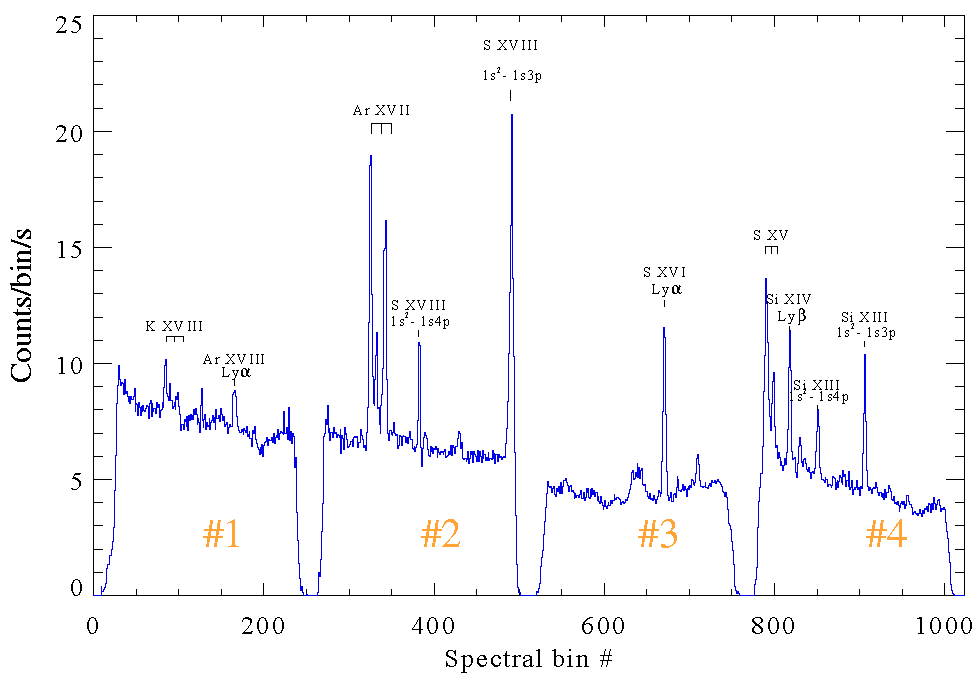
FIG. 1. RESIK spectra in all four channels, with lines indicated, for the period near the peak of the flare on 2002 July 26 at approximately 21:36 UT. The wavelength ranges for each channel are given in Table 1. The broad feature near the center of channel 3 near the S XVI line is of instrumental origin.
(taken to be count rate ratios since the sensitivity is practically constant within a RESIK channel) and
Rexp can be attributed to differences in the assumed element abundances.
RESIK has pulse-height analyzers designed to accept solar photons but reject those produced by fluorescence of the crystals by solar X-rays. They allow RESIK channels 1 and 2 to observe the solar continuum with little or no fluorescence contamination. The analysis given above for line ratios has therefore also been done for line-to-continuum ratios, with expected ratios given by similar expressions but with temperature-dependent functions describing the sum of free-free, free-bound, and two-photon con-tinua. These were obtained from the CHJANTI code with the same set of abundances and ionization fractions as for the line analysis. The analytical expressions for the summed continua given by Mewe, Lemen, & van den Oord (1986) agree to better than 1% with the CHIANTI values for the wavelengths and temperatures used here.
3. RESULTS AND CONCLUSIONS
We discuss results from the large flare of 2002 July 26/27 in detail since the data coverage for this event was the most extensive of the flares analyzed. The first maximum occurred in
GOES light curves at July 26 21:12 UT at the M9 level, and a second maximum occurred at July 26 22:18 UT at M5.5. There are eight intervals, from 5 to 21 minutes long over the period July 26 21:ll-July 27 04:06 UT, when RESIK spectra were recorded and line fluxes could be measured so that element abundances could be repeatedly determined. Figure 1 shows an example of a RESIK spectrum in all four channels. During the longer intervals, spectra were summed over two or three subintervals when the strength of lines permitted this. From these spectra, total count rates in the Ar
XVIII Ly![]() doublet (
doublet (![]() ), the S
XV lines
), the S
XV lines ![]() ), the K
XVIII w line
), the K
XVIII w line ![]() , and neighboring continua were
determined.
, and neighboring continua were
determined.
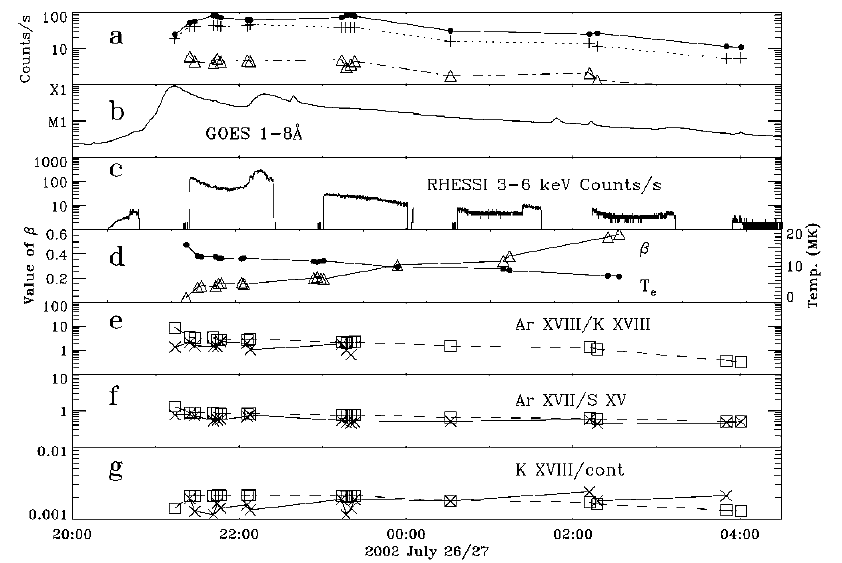
FIG. 2. (a) Total RESIK count rates (per second) in the S xv lines
(![]()
![]() 4.09, 4.30; summed, filled circles), Ar xvn w line
(
4.09, 4.30; summed, filled circles), Ar xvn w line
(![]() 3.95; plus signs), and K
XVIII
w line
(
3.95; plus signs), and K
XVIII
w line
(![]() 3.53; triangles) during the flare of 2002 July 26/27. (b) GOES 1-8
Å X-ray light curves, (c) RHESSI 3-6 keV count rates (per second). The count rates are corrected for different attenuator states but not decimation levels (Smith et al. 2002), hence the sudden jumps at 20:40 and 01:20 UT. (d) Values of
Te (in units of megakelvins) in the isothermal model A (filled circles) and
3.53; triangles) during the flare of 2002 July 26/27. (b) GOES 1-8
Å X-ray light curves, (c) RHESSI 3-6 keV count rates (per second). The count rates are corrected for different attenuator states but not decimation levels (Smith et al. 2002), hence the sudden jumps at 20:40 and 01:20 UT. (d) Values of
Te (in units of megakelvins) in the isothermal model A (filled circles) and
![]() (triangles) in model C (DEM = const, exp
(—
(triangles) in model C (DEM = const, exp
(—![]() Te). (e)` Observed (crosses) and expected (squares) values of the Ar
XVIII/K XVIII line ratio in units of photons. (/) Same as (e), but for the Ar
XVII/S XV line ratio, (g) Observed (crosses) and expected (squares) values of the K
XVIII/continuum ratio, with the continuum in units of counts
Å -1. The expected ratios in (e)-(g) are calculated from model C and with coronal element abundances from Feldman & Laming (2000).
Te). (e)` Observed (crosses) and expected (squares) values of the Ar
XVIII/K XVIII line ratio in units of photons. (/) Same as (e), but for the Ar
XVII/S XV line ratio, (g) Observed (crosses) and expected (squares) values of the K
XVIII/continuum ratio, with the continuum in units of counts
Å -1. The expected ratios in (e)-(g) are calculated from model C and with coronal element abundances from Feldman & Laming (2000).
Figure 2 shows the measured and derived parameters as a function of time through the 2002 July 26/27 flare. The caption gives details. The double-peaked nature of the flare in
GOES is not obvious from the light curves of the RESIK lines (Fig. 2a) because of a gap in the data between 22:09 and 23:12 UT that includes the peak of the second flare. A spike in hard X-rays was recorded by the
Reuven Ramaty High Energy Solar Spec-troscopic Imager (RHESSI; Smith et al. 2002) at 22:08 UT, which marks the impulsive stage of the second flare. At this time, the Si
XIII and other lines have profiles that are 10% wider. A similar broadening of soft X-ray lines has been observed on many previous occasions at higher temperatures. Ha flare images indicate that the two X-ray peaks originated from the same active region, resulting in zero relative displacement of RESIK spectra. After 23:12 UT, the RESIK line intensities showed a decline lasting several hours. The Ar
XVIII line doublet was measurable from July 26 21:22 to 23:23 UT, but other lines, including the Si
XVIII and Si XIV lines from which Te and
![]() in emission models A-C are determined, were measurable till July 27 04:06 UT. The slowly cooling nature of the emitting plasma is indicated by the value of
Te in model A (a decline from 16 to 7 MK), by the value of
in emission models A-C are determined, were measurable till July 27 04:06 UT. The slowly cooling nature of the emitting plasma is indicated by the value of
Te in model A (a decline from 16 to 7 MK), by the value of ![]() in model B (an increase from 0.8 to 4.5), and by the value of
in model B (an increase from 0.8 to 4.5), and by the value of ![]() in model C (an increase from 0.05 to 0.6).
in model C (an increase from 0.05 to 0.6).
The mean of the observed Ar XVIII/K XVIII
count rate ratios from RESIK channel 1 (Fig. 2e) divided by the expected values is 1.7 ± 0.5 for model A, 0.6 ± 0.2 for model B, and 0.3 ± 0.1 for model C (uncertainties are standard deviations). The mean of the observed Ar
XVII/S XV ratios from channel 2 (Fig. 2f) divided by the expected ratios is 0.9 ± 0.2 for model A, 0.7 ± 0.1 for model B, and 0.8 ± 0.1 for model C. These factors do not show any significant trend with time, indicating that there is no time dependence of abundances. As indicated earlier, these differences can be directly related to required adjustments in the abundance ratios since each pair of lines is observed in the same RESIK channel. The different models therefore lead to different results, particularly for the Ar/K abundance ratio.
Some discrimination as to the correctness of the three models is provided by the consistency of the Ar/H abundance ratio, which is determined by both the Ar
XVIII/continuum and the Ar XVII/continuum ratios, measured in RESIK channels 1 and
2, respectively. The fluorescence contribution for this flare is estimated to be 3.2% of the continuum for channel 1 and 0.2% for channel 2. Corrections for these small amounts were made to measured line-to-continuum ratios. For model C, the observed Ar
XVIII/continuum ratios (omitting two values for which the Ar
XVIII line is very weak) are less than the expected values by a factor of 2.5 ± 0.7 standard deviation (s.d.), and the Ar
XVII/continuum ratios are less than the expected values by a factor of 1.4 ± 0.1 s.d. (the smaller uncertainty reflecting the strength of the Ar
XVII lines; see Fig. 1). For model A, the observed Ar XVIII/continuum ratio is a factor of 3 more than the expected value, and the observed Ar
XVII/continuum ratio a factor of 1.5 less than the expected value. For model B, the observed Ar
XVIII/continuum ratio is a factor of 4 less than the expected value, and the observed Ar
XVII/continuum ratio is approximately equal to the expected value. The differences are due to the fact that the Ar
XVIII ![]() line contribution function has an extended high-Te tail that the Te dependence of model B
(Te-
line contribution function has an extended high-Te tail that the Te dependence of model B
(Te-![]() ) tends to exaggerate relative to model C [exp
(-
) tends to exaggerate relative to model C [exp
(-![]() Te)]` but that an isothermal model A ignores. The greater consistency of results from model C indicates that it is a better approximation to the differential emission measure of this flare than model A or model B.
Te)]` but that an isothermal model A ignores. The greater consistency of results from model C indicates that it is a better approximation to the differential emission measure of this flare than model A or model B.
Using model C and well-measured line/line and line/continuum ratios, we found the following abundance ratios: Ar/K = 4.3 ± 1.5; Ar/S = 0.15 ± 0.03; Ar/H = (1.5 ± 0.4) x
10-6 (from Ar XVIII/continuum); Ar/H = (2.8 ± 0.2) x
10-6 (from Ar xvii/continuum); K/H = (3.7 ± 1.0) x 10-7 ; and S/H = (2.2 ± 0.4) x
10-5.
For well-determined measurements during the flares of April 14/15, July 11, and July 22/23, very similar abundance ratios (at most 30% different from the above values) were obtained with the exception of ratios involving sulphur (S/H and Ar/S) in the flares of April 14/15 and July 11 for which the sulphur abundance was found to be about a factor of 2 lower. For both these flares, the S
XV 1s2-ls3p line is outside the range of RESIK channel 2 owing to the position of the flare on the Sun relative to the crystal dispersion direction. Analysis of a channel 1 spectrum summed over 4 minutes at 22:04 UT during the July 26 flare, showing not only the K
XVIII and Ar XVIII lines but also the S
XVI Ly![]() line at 3.69 Å, provides independent evidence that the sulphur abundances from the July 26/27 and July 22/23 flares are more reliable.
line at 3.69 Å, provides independent evidence that the sulphur abundances from the July 26/27 and July 22/23 flares are more reliable.
This analysis of flare X-ray line and continuum spectra thus indicates that the differential emission model C, which has the
form `DEM = const, exp (-![]() Te), results in the most consistent line/continuum ratios. This being the case, we find a value of the K/H abundance ratio that is only 10% less than that of Doschek et al. 1985; 4.2 x
10-7) based on a single measurement of an argon/calcium line ratio from the P78 spacecraft spectrometer and an isothermal assumption. It is 21% less than the EUV quiet-Sun measurement of Landi et al. 2002; 4.7 x
10-7). Both these determinations agree with our value to within our estimated uncertainties (±27%). However, our value is a factor of 3 more than the photospheric abundance (Takeda et al. 1996).
Te), results in the most consistent line/continuum ratios. This being the case, we find a value of the K/H abundance ratio that is only 10% less than that of Doschek et al. 1985; 4.2 x
10-7) based on a single measurement of an argon/calcium line ratio from the P78 spacecraft spectrometer and an isothermal assumption. It is 21% less than the EUV quiet-Sun measurement of Landi et al. 2002; 4.7 x
10-7). Both these determinations agree with our value to within our estimated uncertainties (±27%). However, our value is a factor of 3 more than the photospheric abundance (Takeda et al. 1996).
The model C value of the S/H abundance ratio, (2.2 ± 0.4) x 10-5, agrees within uncertainties with the coronal value of Feldman & Laming (2000) and the photospheric value of Grevesse & Sauval (1998; 2.1 x
10-5) but is a factor of 2.8 more than the value of Fludra & Schmelz (1999) from Yohkoh X-ray line/continuum measurements. We take the value of the Ar/H abundance ratio to be that determined from the Ar
XVII/ continuum ratio, (2.8 ± 0.2) x 10-6 (the small uncertainty reflecting the high intensities of the Ar
XVII lines), since it is more reliable than that from the more uncertain Ar
XVIII/con-tinuum ratio. It is slightly higher than the solar energetic particles value [(2.1 ± 0.3) x
10-6; Reames 1998] and equal within uncertainties to the value from an impulsive flare thought to have photospheric abundances [(3.9 ± 1.1) x
10-6; Young et al. 1997; Feldman & Laming 2000]. It should be pointed out, in view of the possibility of varying abundances during flares (Sylwester, Lemen, & Mewe 1984), that our results refer specifically to long-duration flares only. With this proviso and the assumption that the flare plasma was coronal in origin, our K, Ar, and S abundances fit a pattern in which low-FIP elements are enriched in the corona by a factor of 3 over the photosphere, but with high-FIP elements (including S) having coronal and photospheric abundances equal to within estimated uncertainties. It rules out the possibility that coronal/photospheric enhancements steadily increase with decreasing FIP, as might be deduced from Figure 13 of Feldman & Laming (2000).
This research was performed while K. J. H. P. held a National Research Council Research Associateship award at NASA Goddard Space Flight Center. J. S. and B. S. acknowledge support from grant 2.P03D.002.22 of the Polish Committee for Scientific Research, and E. L. acknowledges support from the Office of Naval Research. Brian R. Dennis, Peter T. Gallagher, and Anne K. Tolbert are thanked for helpful discussions.
RESIK is a common project between NRL (USA), MSSL and RAL (UK), IZMIRAN (Russia) and SRC (Poland, PI - J. Sylwester).
The instrument is placed aboard the CORONAS-F satellite Mission (Project Scientist - Professor V.N.Oraevsky, IZMIRAN).
REFERENCES
Dere, K. P., Landi, E., Mason, H. E., Monsignori Fossi, B. C., & Young,
P. R. 1997, A&AS, 125, 149
Doschek, G. A., Feldman, U., & Seely, J. F. 1985, MNRAS, 217, 317 Feldman, U., & Laming, J. M. 2000, Phys. Scr., 61, 222 Feldman, U., Landi, E., Doschek, G. A., Dammasch, I., & Curdt, W. 2003,
ApJ, in press
Fludra, A., & Schmelz, J. T. 1999, A&A, 348, 286 Grevesse, N., & Sauval, A. J. 1998, Space Sci. Rev., 85, 161 Landi, E., Feldman, U., & Dere, K. P. 2002, ApJS, 139, 281 Landi, E., Feldman, U., Innes, D. E., & Curdt, W. 2003, ApJ, 582, 506 Mazzotta, P., Mazzitelli, G., Colafrancesco, S., & Vittorio, N. 1998, A&AS,
133, 403 Mewe, R., Gronenschild, E. H. B. M., & van den Oord, G. H. J. 1985, A&AS,
62, 197
Mewe, R., Lemen, J. R., & van den Oord, G. H. J. 1986, A&AS, 65, 511
Reames, D. V. 1998, Space Sci. Rev., 85, 327
Smith, D. M., et al. 2002, Sol. Phys., 210, 33
Sylwester, J., Culhane, J. L., Doschek, G. A., Oraevsky, V. N., Phillips,
K. J. H., & Sylwester, B. 2002, in 10th European Solar Physics Meeting,
Solar Variability: From Core to Outer Frontiers, ed. A. Wilson (ESA SP-
506; Noordwijk: ESA), 765
Sylwester, J., Lemen, J. R., & Mewe, R. 1984, Nature, 310, 665 Takeda, Y, Kato, K.-L, Watanabe, Y, & Sadakane, K. 1996, PASJ, 48, 511 Young, P. R., Del Zanna, G., Landi, E., Dere, K. P., Mason, H. E., & Landini,
M. 2003, ApJS, 144, 135 Young, P. R., Mason, H. E., Keenan, F. P., & Widing, K. G. 1997, A&A,
323, 243