Proceedings of IAU Symposium 233,
St. Petersburg 2004, submitted
First Determinations of Differential Emission Measure Distribution from RESIK X-ray Spectra
Space Research Centre, Polish Academy of Sciences,
Kopernika 11, 51-622 Wroclaw, Poland
e-mail: ak@cbk.pan.wroc.pl
Abstract
RESIK Bragg spectrometer aboard CORONAS-F solar observatory collected spectra of hundreds of solar flares in the unique spectral range between 3.3 Å and 6.1 Å. The instrument's absolute and relative calibrations are now finished which allows for the first time to interpret the observations in terms of the differential emission measure (DEM) distribution. With known DEM shape it is possible to derive and study in detail flaring plasma composition and energy balance. Here we report results of using an improved Maximum Likelihood iterative algorithm (Withbroe-Sylwester) for determination of the DEM distributions for 7 January 2003 flare at 23:30 UT. The study is based on the absolute flux values observed in a number of strong H- and He-like transitions of K
XVIII, Ar
XVIII, Ar XVII, S
XVI, S
XV, Si XIV and
Si XIII ions. In this respect, we use line and continuum X-ray emissivities as provided by CHIANTI package from SolarSoft.
1 Introduction
We present analysis of differential emission measure distribution (DEM) for solar flares. The DEM describes the distribution of emitting plasma with temperature. With known DEM shape it is possible to derive and study in detail flaring plasma composition and energy balance.
For calculations of the DEM shape we use Withbroe-Sylwester multiplicative algorithm (Sylwester, Schrijver and Mewe, 1980).
2 Method
The Withbroe-Sylwester multiplicative algorithm is the iterative procedure in which the next approximation of the DEM distribution
 (T) is calculated from preceding one
 (T). using the following expression:

where:
ci is the correction factor taken as ci = Foi/Fci,
Foi and Fci are the measured and predicted fluxes in particular line/band
i (i = 0, 1, 2 ... k) and wi(T) is the weight function defined by the following relationship:

where:
a - is the optimizing parameter, fi(T) is the emission function in line/band i and
Fci is the flux calculated (in jth iteration) as:

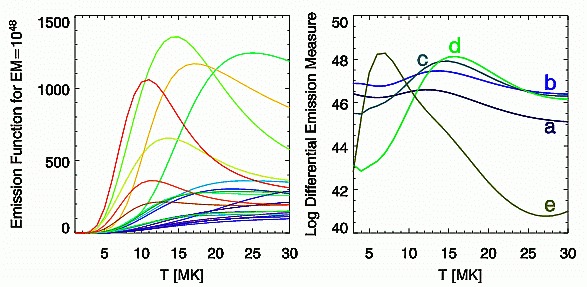
In the set of selected bands used for the DEM analysis the fluxes consist of line and continuum emissions. The emission functions for spectral bands selected have been calculated using CHIANTI (Dere et al., 2001) package ver. 4.2.
3 Results
>From a large RESIK database covering hundreds of flares,
we choose well observed (class M4.9) flare on 7 January 2003 ( ~ 23:30 UT).
Derived variations of DEM for this event are consistent with similar
determinations of DEM shape from the FCS SMM observations.

Figure 1: L: The theoretical emission functions (in
photons cm-2 s-1, lines plus continuum included) used
in the calculations; R: Example DEM curves for 5 time
intervals (a, b, c, d - rise phase, e - late decay) for the
7 January 2003 flare.
Particularly interesting findings obtained are: a)
development of high temperature plasma component (T > 20 MK)
during flare rise phase, b) presence of "flat DEM phase"
near flare maximum, c) development of two-temperature DEM
pattern during decay phase with a slow cooling of the hotter
plasma component.
RESIK (PI - J. Sylwester) is a common project between NRL (USA), MSSL and
RAL (UK), IZMIRAN (Russia) and SRC (Poland). The authors acknowledge support from grant
2.P03D.002.22 of the Polish Committee for Scientific Research.
References
Sylwester J., Schrijver J. & Mewe R. 1980
Solar Physics 67, 285-309.
Dere, K. P., Landi, E., Young, P. R. & Del Zanna, G. 2001
ApJS 134, 331-354.
BACK
File translated from TEX by TTH, version 2.25.
On 15 Sep 2004, 10:43.


