Space Research Centre, Polish Academy of Sciences,
Kopernika 11, 51-622 Wroclaw, Poland
e-mail: js@cbk.pan.wroc.pl
The analysis of results obtained from these earlier spectroscopic solar missions led us to the idea of verifying, this time in absolute terms, the determinations of Doppler shifts observed early in flares. We tested in the sounding rocket flight (Vertical-11, 1983) the concept of a new type of scanning Bragg X-ray spectrometer - so called Dopplerometer and decided, following its success to devise a satellite version of this instrument called Diogeness (Sylwester & Farnik, 1990). Diogenes flew on CORONAS-I, however, the mission ended before really big flares took place and no useful spectra were recorded. On CORONAS-F we were more successful and acquired many spectra as reported below.
In preparing our programme of experimental spectroscopic studies of the corona, we have noticed that large "gaps'' are still present in detailed observations of solar spectra in the soft X-range, below ~ 7 Å. Therefore we decided to devise a new spectrometer intended to cover this spectral region with observations in a systematic way. In collaboration with leading groups from Naval Research Laboratory, USA (NRL), Mullard Space Science Laboratory (MSSL) and Rutherford-Appleton Laboratory (RAL, both from UK) we constructed REntgenovsky Spektrometr s Izognutymi Kristalami (RESIK), the bent crystal spectrometer, described in details by Sylwester et al. (2004).
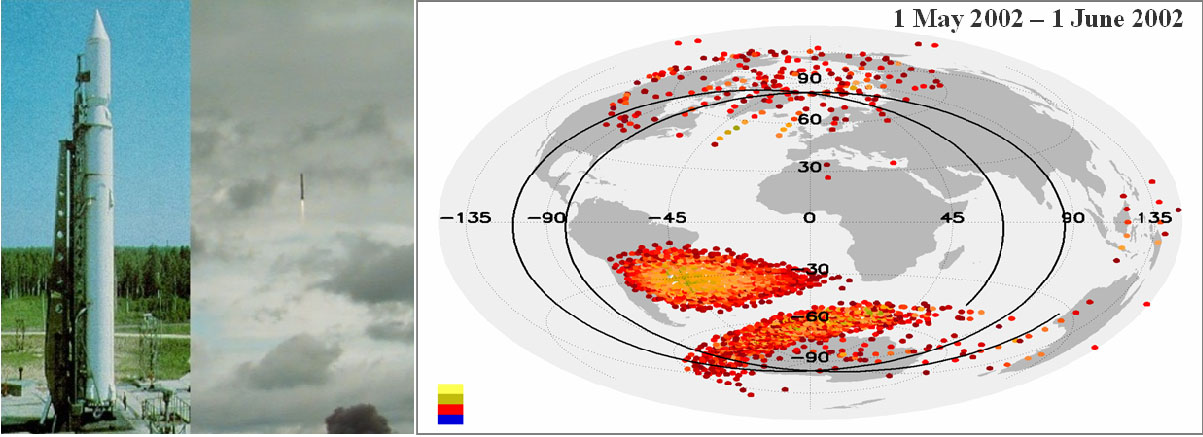
Figure 1: A composite showing the Cyclone 3 rocket booster which lifted the CORONAS-F satellite on 2001 June 31. In the right panel, the satellite orbit is plotted over the map showing locations of increased orbital background. The map is constructed based on the data from the PIN particle sensors placed within RESIK spectrometer.
Both Diogeness and RESIK have been launched aboard the Russian CORONAS-F solar spacecraft on 2001 July 31, (Sylwester & Kordylewski, 2002).
In this paper we show the average spectra observed from these spectrometers. The spectra shown include yet unobserved regions.
The CORONAS-F spacecraft is in a near-circular orbit with an altitude ranging from 501 km and 549 km, with an orbital plane inclined at 82�.5 to the equator, and orbital period of 95 minutes. The near-polar orbit allows periods of uninterrupted observations of the Sun for up to about 20 days: the longest satellite night lasts 35 minutes. Passages through the Earth's radiation belts require most X-ray instruments to be turned off in order to secure their health; these include passages through the South Atlantic Anomaly (SAA) as well as the auroral oval (AO) regions near the magnetic poles. In figure 1, the satellite orbit is plotted over the Earth map, with the regions of enhanced particle background indicated.
Diogeness is the scanning flat crystal spectrometer. The scanning range covers ~ 140 arcmin. Details concerning the crystal selection and wavelength ranges are given in table 1. The spectrometer is composed of four crystals. Two of the crystals used are identical quartz mounted in the so-called Dopplerometer configuration (figure 5) back to back. Therefore the wavelength scanning is taking place in the opposite sense. Such arrangement of the crystals allows for precise relative and absolute measurements of Doppler shifts of selected X-ray lines. For plasma at rest, the maxima of lines scanned are being measured approximately at the same instant. If any radial motions are present, the lines are observed off-set in time. The off-set is directly related to the plasma radial velocity, independent of the position of the flare on the solar disk. The observed widths of spectral lines (Figures 2, 3 & 4 ) reflect mostly the intrinsic line widths (thermal and non-thermal broadening) since the instrumental rocking curves widths are much smaller. Since the four crystal-detector sections are equipped with a small proportional detector windows (0.3 cm2 area) covered with Be 130 mm filter, only larger flares (above C5 GOES class) provide spectral signal above background. Even in the strongest X-class flares, the detectors did not get saturated.
Table 1: Characteristics of Diogeness spectrometer
| Channel 1 | Channel 2 | Channel 3 | Channel 4 | |
| Crystal | Quartz | ADP | Beryl | Quartz |
| plane |
| 111 |
|
|
| 2d spacing [Å] | 6.69 | 10.57 | 15.96 | 6.69 |
| Wavelength range [Å] | 3.14-3.39 | 4.98-5.37 | 6.11-6.73 | 2.96-3.21 |
| Principal | ||||
| lines in range | Ca XIX | S XVI | Si XIII | Ca XIX |
Hundreds of spectra from particularly well observed X5.3 flare on 2001 August 25, seen by Diogeness include strong emission lines of highly ionized Si, S, and Ca atoms as well as many satellite and subordinate lines. In Figures 2, 3 and 4 we present average spectra recorded for this X5.3 flare. The time averaging extends over the rise, maximum and decay phases with each scanned spectrum taken with equal weight. The averaging allows to see combined spectral features of the hotter (rise and maximum) and cooler plasmas (during flare decay) together. Averaged spectra from so-called left and right scans (in which the scanning took place in the opposite wavelength sense) we plot in logarithmic scale on-top each other. The differences between the left and right averaged spectra are usually so small that the separation of lines is mostly undistinguishable. We are confident of the physical significance of even the weakest features seen, provided the two profiles match. In figure 2, we supplement the Diogeness spectra with those measured earlier by the NRL group (Doschek, Feldman, & Seely, 1985).
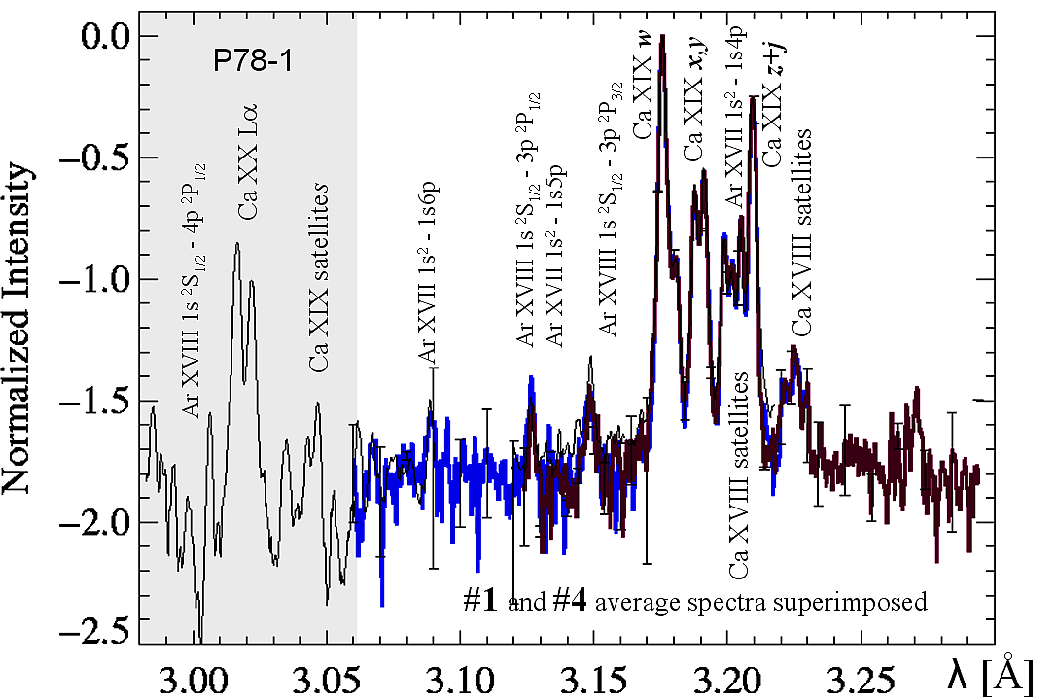
Figure 2: Diogeness average normalized (to maximum) spectrum in
the range covered by channels Nos. 1 and 4. Logarithmic scaling
is used on the vertical axis in order to bring-up weaker
spectral structures. Earlier results (gray area) obtained from
the P78-1 experiment (Doschek, Feldman & Seely, 1985) are
merged using the overlapping part of the continuum as a common
reference. This merging allows to see in one piece the entire
spectral range covering the Ca XX
![]() region as
well as the Ca XIX He-like triplet with their numerous
satellite lines.
region as
well as the Ca XIX He-like triplet with their numerous
satellite lines.
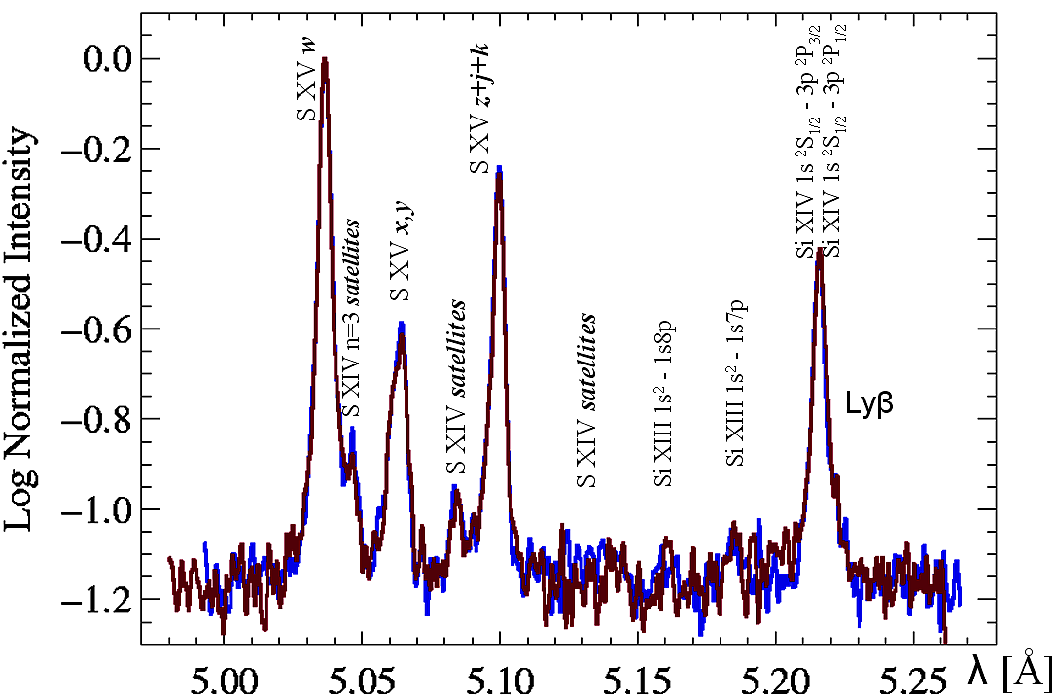
Figure 3: Diogeness average normalized (to maximum) spectra in
the range covered by channel No. 2. Logarithmic scaling
is used on the vertical axis in order to bring-up weaker
spectral structures. The spectrum in the vicinity of S XV He-like
ion triplet is seen in detail as well as the Si XIV
![]() region with their numerous satellite lines. The two
overlapping lines represent spectra as averaged from the left and
the right scans respectively.
region with their numerous satellite lines. The two
overlapping lines represent spectra as averaged from the left and
the right scans respectively.
Besides the strongest He-like triplet lines, Diogeness measures also the other lines important for plasma diagnostics. One of the most interesting is the Lyb line of Si XIV ion at 5.216 Å (figure 3). As this line is mostly formed in the hottest regions of the flare, its intensity is observed to fall rapidly during the decay (Siarkowski et al., 2002). Several features seen on the presented spectra are observed for the first time. Their identification is still tentative.
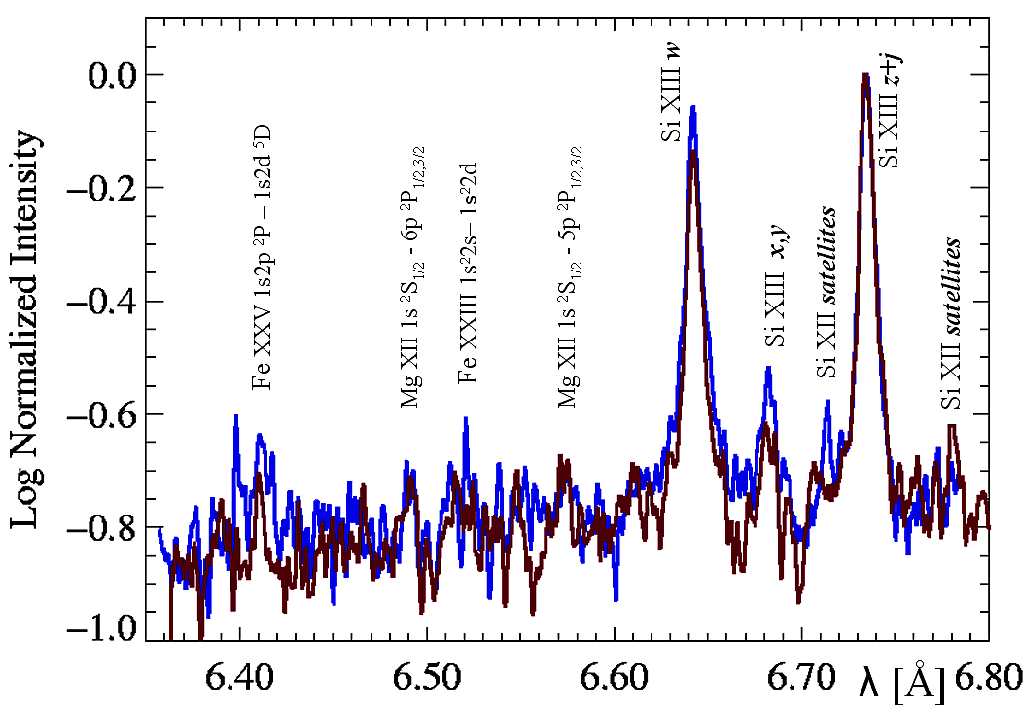
Figure 4: Diogeness average normalized (to maximum) spectra in the range covered by channel No. 3. Logarithmic scaling is used on the vertical axis in order to bring-up weaker spectral structures. The spectrum in the vicinity of Si XIII He-like ion triplet is seen in detail. The two overlapping lines represent spectra as averaged from left and right scans respectively.
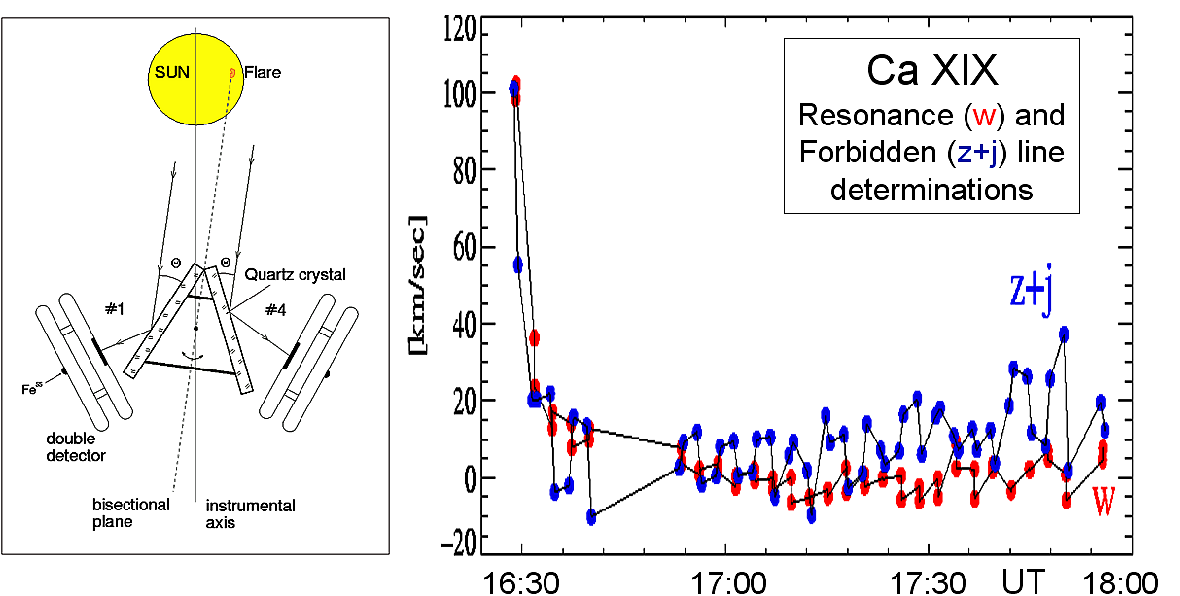
Figure 5: Left: The scheme of Dopplerometer configuration
adopted in the experiment. Bi-sector plane of the crystal
pair #1 and #4 (dotted line) points momentarily towards the
source (flare). Crystals are fixed mechanically at the exact
angle of 2![]() . By rotating fixed crystal section back and
forward, the Bragg-reflected spectra in the vicinity of strong
lines are measured by a pair of double proportional counters. In
the ideal case of perfect co-alignment and for the source plasma
being at rest, the line centres are recorded in channels #1 and
#4 at the very same time during the scans performed in the
opposite wavelength sense. Any radial
motions of the hot flaring plasma will displace (in time) the
relative position of lines. The displacement is
proportional to the line Doppler shift and is independent of the
position of the source (flare) on the disc and/or the relative
pointing, provided they are stable.
Right: Velocities determined from X-ray line shifts
observed by Diogeness. Determinations for Ca "w'' and Ca "z+j''line are superimposed. A high blue-shift is
observed early in flare. The shifts of entire spectra are
of similar value in all lines measured. As the Ca "w'' line is not badly blended (as is the case of the
forbidden line) the uncertainties of velocity
determinations are few km/s only for this line.
. By rotating fixed crystal section back and
forward, the Bragg-reflected spectra in the vicinity of strong
lines are measured by a pair of double proportional counters. In
the ideal case of perfect co-alignment and for the source plasma
being at rest, the line centres are recorded in channels #1 and
#4 at the very same time during the scans performed in the
opposite wavelength sense. Any radial
motions of the hot flaring plasma will displace (in time) the
relative position of lines. The displacement is
proportional to the line Doppler shift and is independent of the
position of the source (flare) on the disc and/or the relative
pointing, provided they are stable.
Right: Velocities determined from X-ray line shifts
observed by Diogeness. Determinations for Ca "w'' and Ca "z+j''line are superimposed. A high blue-shift is
observed early in flare. The shifts of entire spectra are
of similar value in all lines measured. As the Ca "w'' line is not badly blended (as is the case of the
forbidden line) the uncertainties of velocity
determinations are few km/s only for this line.
As concerns the results coming from the Dopplerometer section, with all the satellite drift motions and the other instrumental effects found unimportant (Plocieniak et al., 2002), the relative observed shifts of the line positions in respect to the bi-sector plane have been interpreted as a consequence of the Doppler effect. The results are plotted in figure 5 for the X5.3 flare on 2001 August 25. The velocity determinations have been performed independently from the shifts observed for the resonance lines and blends of forbidden with satellite lines of Ca XIX (lines w and z+j respectively in figure 2). It is seen that these independent determinations compare well to the level of the uncertainty of velocity determinations (few km/s). This agreement provides strong argument in favour that for the observed flare, the entire X-ray spectra were Doppler shifted by ~ 100 km/s for Ca XIX ion abundant at T > 15 MK. Similar pattern of shifts have been observed for cooler plasma contributing to S XV and Si XIII ions line emission (Plocieniak et al., 2002).
Table 2: Characteristics of RESIK spectrometer
| Channel 1 | Channel 2 | Channel 3 | Channel 4 | |
| Crystal | Si | Si | Quartz | Quartz |
| plane | 111 | 111 |
|
|
| 2d spacing [Å] | 6.27 | 6.27 | 8.51 | 8.51 |
| bend radius [cm] | 110.0 | 100.0 | 145.0 | 52.5 |
| Wavelength rangea [Å] | 3.40-3.80 | 3.83-4.27 | 4.35-4.86 | 5.00-6.05 |
| resolution [mÅ] | 8 | 9 | 12 | 17 |
| Dispersion [mÅ/bin] | 2.49 | 2.28 | 2.85 | 4.99 |
| Principal | ||||
| lines in range | Ar XVIII, | Ar XVII, | S XVI | S XV, Si XIV, |
| K XVIII | S XV | Si XIII |
a Nominal wavelength ranges are those recorded always
The observed widths of spectral lines (Figures 6 & 7 ) reflect the instrumental line widths as the spectral bin has to be wide enough in order to cover the large spectral range selected. Full description of RESIK instrument is given in Sylwester et al., (2004). It is possible to observe with RESIK in higher orders of reflections.
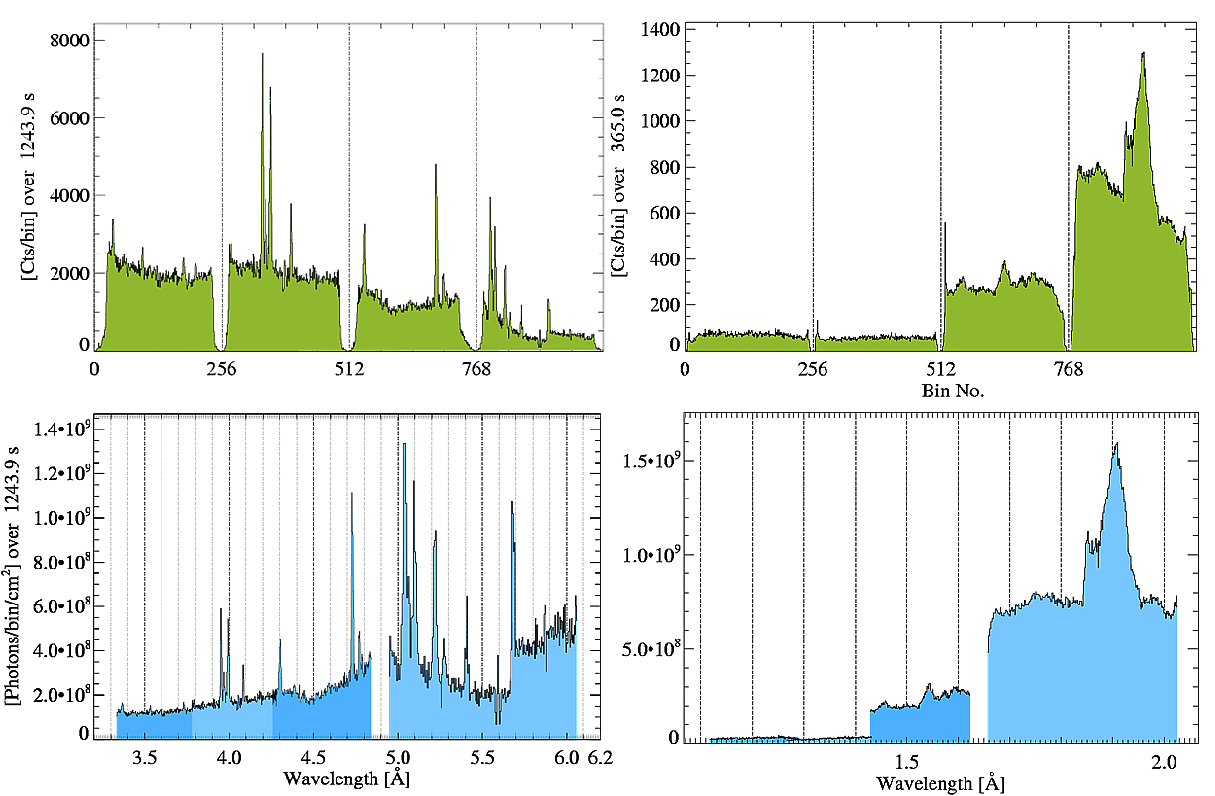
Figure 6: Left: Example composite RESIK spectra as measured (upper panel) and after reduction (lower panel). During the reduction process, orbital background and fluorescence contamination have been removed. The spectra shown were collected during the 20-minute rise phase of the M1.9 East-limb flare on 2003 January 21. Right: Spectra measured in the mode where detectors were sensitive to photons reflected from the crystals in second and third order. The spectra shown were collected over 365 s during the maximum phase of the M2.1 flare on April 26, 2003.
In figure 6, we show examples of the spectra collected in individual contiguous time intervals in the four spectral channels (first and third order reflections) before (as recorded) and after the reduction to the absolute units.
RESIK primary wavelength coverage, 3.3 Å - 6.1 Å, has been very little explored by previous solar spacecraft. Spectra from solar flares seen by RESIK include strong emission lines of highly ionized Si, S, and Ar atoms, together with lines from the low-abundance, odd-Z elements K and Cl. Some of these lines are also seen in the spectra of brighter, non-flaring active regions and "quiet Sun''. Several spectral features have been observed for the first time in solar X-ray spectra. In figure 7 we present a composite of the observed spectral variability in four RESIK channels. The reduced spectra shown are averages of many individual (from a sample of ~ 1200) for five temperature categories. Before averaging, the spectra have been normalized to unit emission measure (1044cm-3). The temperature has been assigned to each individual spectrum based on the interpretation of the signal ratio measured in channels No. 1 and No. 4. What appears unexpected is presence of few broad-band spectral features (bumps), systematically changing their appearance with temperature. Importance of bumps at ll 3.60-3.85 Å, 4.05-4.25 Å, and 4.5-4.9 Å, decreases with temperature, but the role of the bump at 5.6-6.0 Å grows with increasing T. We are yet unsure of the processes contributing to presence of the observed bumps.
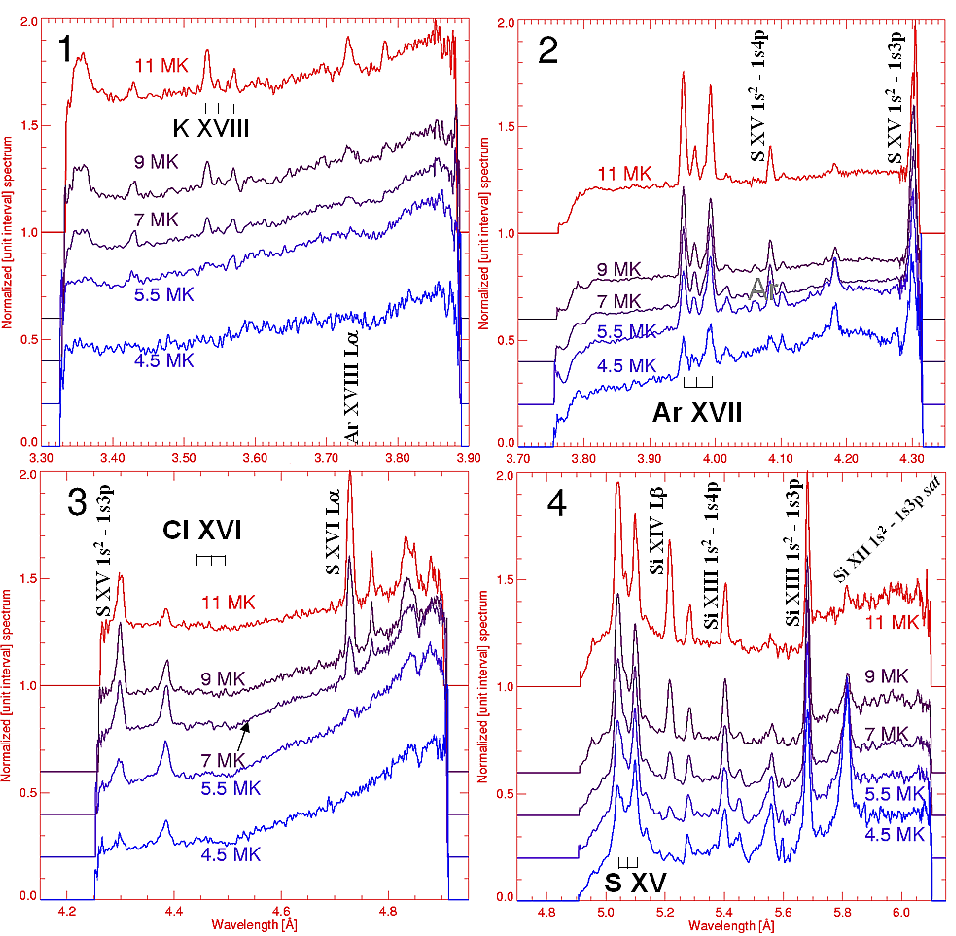
Figure 7: Composite showing temperature dependence of average spectra observed by RESIK in five temperature categories in all four first order channels. Spectra are normalised to their respective maxima and slighly vertically shifted (see the side levels) in order to increase visibility. Main lines are identified and positions of He-like triplets indicated.
The spectra recorded cover yet unexplored spectral ranges with unprecedented resolution and constitute the reference spectral atlas in the range below 6.8 Å. Many spectrafeatures including broad "bumps'' has not been observed before. The variability of spectra with changing temperature is discussed which will lead to the identification of the spectral features seen. This will be the subject of forthcoming papers. All the Figures presented here in black and white are available in colours at the address: http://www.cbk.pan.wroc.pl/publications/2004/IAU223_Bragg.html.
I would like to thank Barbara Sylwester for useful discussions and help in preparing this review. We acknowledge financial support for RESIK from the Polish grants 2.P03D.002.22 and PBZ-KBN-054/P03/2001, and the Exchange Visitors Programme of The Royal Society-Polish Academy of Sciences.