1Space Research Centre, Polish Academy of Sciences,
Kopernika 11,
PL-51-622 Wroclaw, Poland
1 Introduction
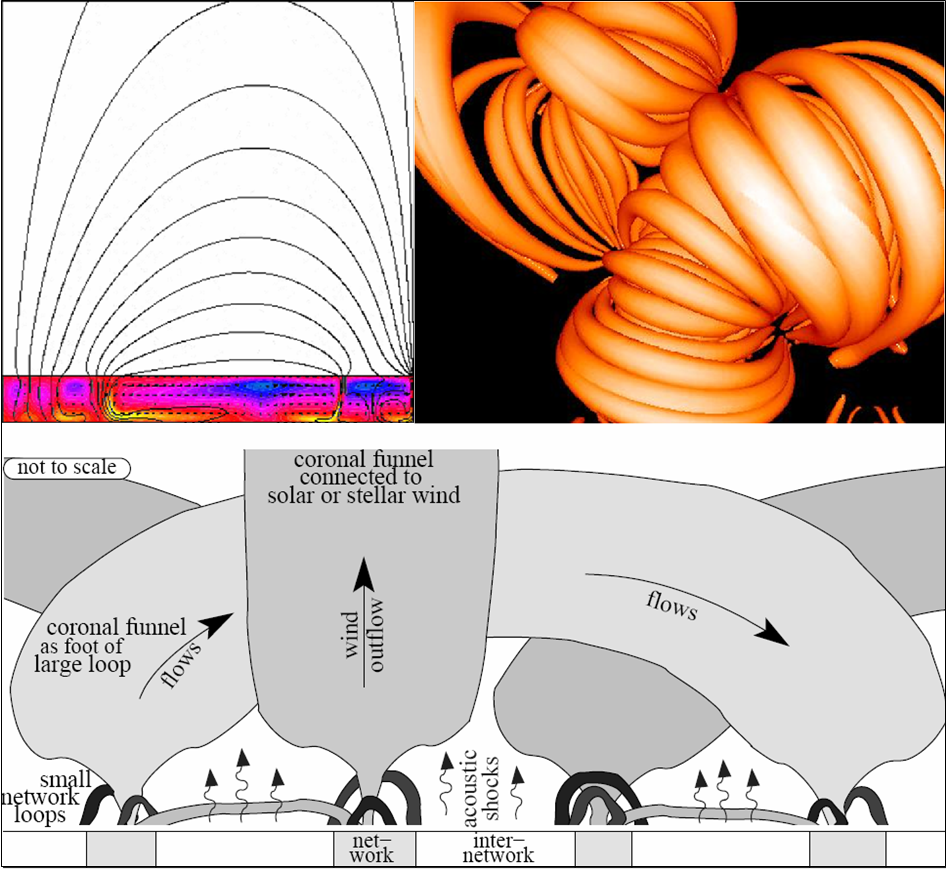
Over past decades, space as well as ground observations of the Sun have revealed many interesting emission features. Practically all of them show emission structures which are (most probably) tracing magnetic field lines. Such observations in conjunction with good magnetograms (MDI) more or less enabled to figure out general idea of the coronal magnetic fields as a direct extension of flux-tubes evanescing (through funnels, McKenzie et. al, 1998) from below the photosphere in the form of magnetic elements. This ''classical'' view is summarized in Figure1.
Figure 1: Upper-left: Snapshot from the movie (http://soi.stanford.edu/press/ssu11-01/TRACE/mhd361n300_3.mov) showing the evolution of magnetic field lines as obtained form MHD modelling of the interaction of the corona with the sub-photospheric convecting layers (Hurlburt and Rucklidge, 2000). Relevant talk of Uitenbroek containing basics of MHD formulations can be found at the address: http://science.nasa.gov/ssl/pad/solar/presentations/UitenbroekTalk.pdf. Upper-right: Nested system of simple loops placed in three dimensions representing ''coronal extension'' of the magnetic flux tubes evanescent from below the photosphere. For interactive animation visit: http://science.nasa.gov/ssl/pad/solar/CurveHome.html. Bottom: Sketch of the transition layer between the photosphere and the low corona illustrating the funnels (Peter, 2004).
The morphology of solar structures is extremely complicated as
observed in every spectral range. With increasing resolution of
present instruments, the complexity of structures is observed to
be getting even more perplexing. From the other side, the models
used in order to interpret properties of the observed structures
are usually pertinently referring to ''single loop'' or arcade of
individual loops. More elaborated ''three-dimensional'' modelling
makes often use also of the concept of a simple magnetic
flux-tube, being replicated on various scales and tightly packed
inside a coronal active region (Aschwanden et. al., 1999). In the
most advanced MHD models, the concepts of fans, spines and
separatrix surfaces bring sufficient necessary complexity into the
description, making the comparison with the observation easier but
more ambiguous (Priest, 2001).
However, in the most of the solar atmosphere the magnetic fields are believed to be responsible for passive bottling the plasma in particular magnetic structure with the gravity playing role on the longer sizes/time scales. It is generally assumed that plasma transport is highly non-isotropic, being very efficient along the field lines (this processes being rapid, because information is transmitted along the flux tubes at the Alfven speed) and (in comparison) nearly completely prohibited across. The condition of plasma being frozen-into the field is expected to be valid about everywhere in the visible portion of the atmosphere, with the importance of the magnetic forcing growing in regions of lower plasma b (b - gas-to-magnetic pressure). Flux freezing in the coronal plasma is relaxed when local field gradients become sufficiently steep: the magnetic field then changes its topology, and releases energy by reconnection events. Transition from the dominance of gas pressure (b > 1) to magnetic field pressure (b < 1) occurs within the observed layers (transition region). In a picture shared at present by the most of researches, so called magnetic funnels are rooted in the network elementary magnetic flux-tubes. They are rapidly widening to fill the whole space in the corona. In order to understand the emissivity observed in lines formed below 105K, Dowdy et al. (1986) and Peter (2002) postulate presence of closed loop-like structures below these magnetically open funnels (cf. Figure 1). Without the magnetic field, the temperature of the atmosphere would become more or less horizontally uniform within minutes.

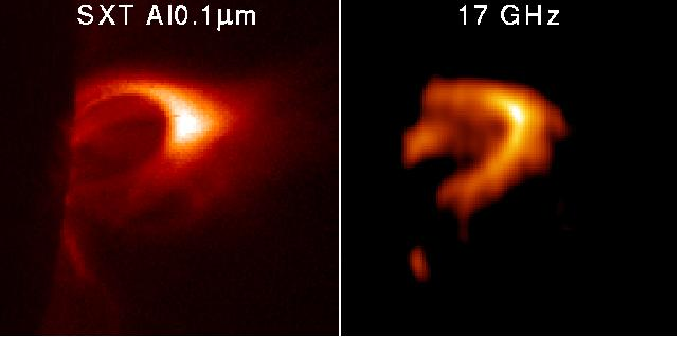
Figure 3: NoRH observation of the prominence filled with the plasma of relatively low temperature (T ~ 10 000 K) taken on 31 July 1992. This is a composite image: The three ''filaments'' out of the limb are the snapshots at different times of a single erupting prominence. The disk image is a negative soft X-ray image, showing the arcade flare. On the enlarged portion of the image (right panel) the internal structure (multiple kernels) of the eruptive filaments are clearly resolved. Figure taken from http://solar.nro.nao.ac.jp/norh/html/gallery/sun_10kk.html
With the inhomogeneous magnetic field present, its concentrations would diffuse across plasma in time scale comparable to the age of the Sun only. This picture usually standing behind ''classical'' thinking of basic atmospheric structuring, certainly does not constitute a generally valid description for most (any?) of the phenomena observed in the solar atmosphere. In numerous cases rather fast (even timescales of activity cycle are fast for typical magnetic diffusion times) reconfiguration (as deduced from the observed changes of the morphology) is observed. This necessitates corresponding changes of the (directly invisible) pattern of currents contributing to the magnetic field. Some of the field lines of such time-varying magnetic configurations are distinctive by their brightness reflecting enhanced plasma densities. An outstanding problem is our lack of understanding about how the Sun chooses different field lines to populate with plasma - a kind of evaporation scenario might be in work - see the discussion later on. In the present study we pop up selected images of solar structures where the emission patterns particularly well indicate for specific organization of links in the corona. These patterns, however complicated by themselves, reveal to us some internal order, in the sense that the overall complexity of the structures may be broken up into segments similar in shape, but different in size. These elementary structures - building blocks - appear to be replicated and linked in a self-organized manner over few orders of sizes. These we call stages. The tiniest of them are seen at the present observational limit of ~ tens of kilometers in the photosphere. The largest observed structures: stramers and CMEs extend well into the interplanetary space filled with the solar wind, for many solar radii outwards.
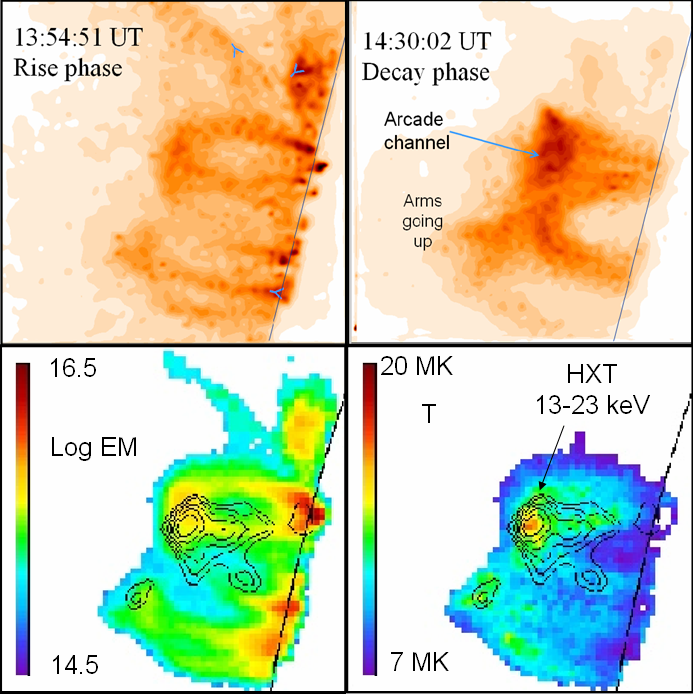
Figure 4: Limb flare of 28 June 1992, Yohkoh observations. See the text.
In the example shown in Figure 3, multiple 17 GHz cool kernels are clearly distinguished in eruption. These multiple kernels could be the regions where arcade rays (spikey) origin. The supra-arcade flow field occurs between an assumed higher reconnection site (kernel) and the top of the loop arcade seen below in X-rays. This is as expected from the standard CSHKP (Carmichael-Sturrock-Hirayama-Kopp-Pneuman) model http://solar.physics.montana.edu/magara/Research/Topics/cshkp.html. As concerns the SXT images, we have been inspired by looking to hundreds of deconvolved images. Deconvolution removes the instrumental blurring and increases the spacial resolution down to ~ 1 arcsec level (Sylwester and Sylwester, 1998b, 1999a). In Figure 4, we show very instructive image of the ''arcade'' long duration (LDE) flaring system, in which, to our opinion, the suggested picture of the coronal links is particularly well distinguished. The system is seen close to the Eastern limb which is helpful to discern true widths and slightly avoid the ambiguity of projection effects. Observations of disc events which are in support of the present model are presented in the paper by Sylwester and Sylwester (1999). Study of LDE's are of spectial interest for morphological considerations, as the rate of changes in the configuration is slow enough for the variations to be seen with sufficient cadence. The flare shown in Figure 4, has been studied by Tomczak (1997) and is presented by Kosugi http://soi.stanford.edu/results/SolPhys200/Kosugi/images/21feb92/21feb92.html. The evolutionary changes of the magnetic field configuration for 28 June 1992 are represented by X-ray emission observed using SXT aboard Yohkoh. The upper row images have been obtained using Be119 filter sensitive to emission of hotter plasma component (T > 5 MK) with the subsequent deconvolution applied. This removed the instrument point spread function, bringing-up details down to ~ 1 arcmin. During the rise phase of this arcade (left image), within the ''multi-loop'' flare many ''Y''-like joints are discernible (look for small ''Y'' signs). During the decay (right), the up-winded structures constituting the ''extension'' of the arcade spine are exceptionally well seen. In the bottom row the emission measure (left) and temperature maps derived using filter ratio technique for the rise phase are shown in respective shades. The hard X-ray (HXT) contours represent the hottest plasma component at (T > 20 MK). The flare shows many soft X-ray loop-like structures clearly. Some of them are ''rooted'' within the smaller ''footpoint'' bright loops, much shorter in size. In the HXT L-band images (13-23 keV), there are two hard X-ray sources near the loop-top of the arcade edge loops. This region corresponds to the high-temperature region in a temperature map. The hard X-ray patch is seen also at the edge of the footpoint loop. The pattern presented is typical of many events studied. One can easily imagine, that the arcade, similar to this presented in Figure 4 would resemble a single loop event with the X-ray source slightly above the soft X-ray loop apex, when seen edge-on. Studies and illustrations of such loop systems are overwhelmingly often meet in the literature, as they nicely fit to many of suggested flare scenarios - see cartoons collected by Hudson in ''Grand Archive of Flare and CME Cartoons'' http://solarmuri.ssl.berkeley.edu/ ~hhudson/cartoons/.
Another set of beautiful SXT images corresponds to two limb,
multiple events evolving slowly on 29 November 1992 and 21
September 1999 (Figures 5 and 6 respectively). It is clearly seen,
that the plasma kernels present at the
''loop-tops''
are the
root-points of the other (presumed magnetic) connections. The
kernels appear to play fundamental role in the organization of the
structures seen. According to the concept proposed by Jakimiec et
al., 1998, (see also Hugh Hudson atlas of flare cartoons
http://solarmuri.ssl.berkeley.edu/~hhudson/cartoons/thepages/Jakimiec.html)
these kernels (in the corona)
consist of denser (N > 1011 cm-3) turbulent plasma, where
the most of energy release takes place. This energy release takes
place within the entire volume of the kernel with the maximum
efficiency close to the surface of the kernel, where the kernels'
wiggly magnetic field came in contact with the outside field. MHD
turbulence keeps boiling within the kernel which leads to
simplification of tangled magnetic field. There are many suitable
points within the kernel volume where the field gradients are
large and conductivity is turbulent hence the reconnection gets
easier. As time progress, the field within the kernel simplifies,
the plasma leaves kernel, some of it being snatched, some drained,
some convected away and the kernel disappears.
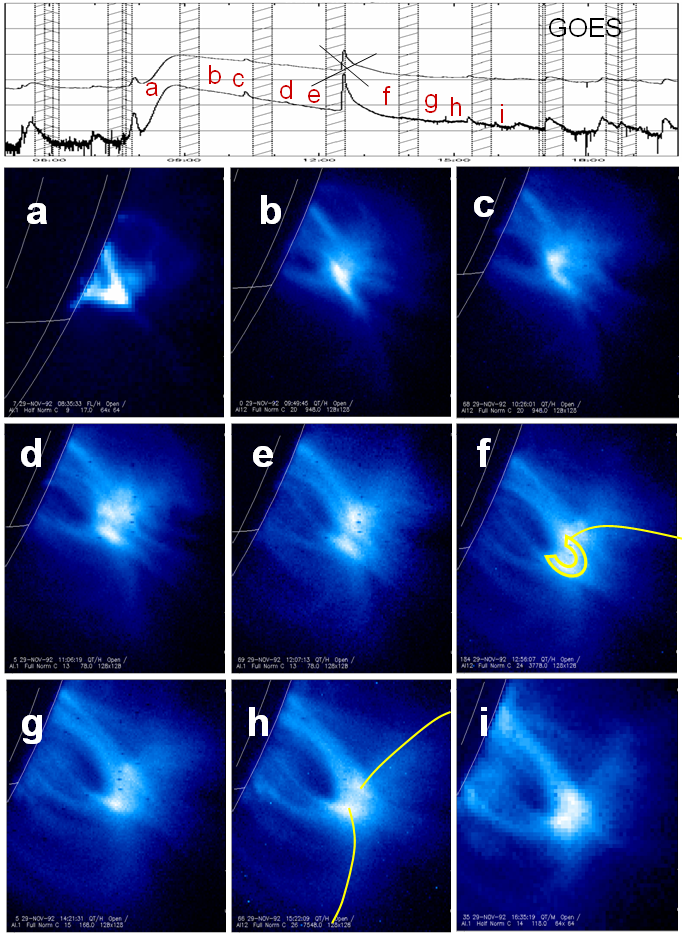
Figure 5: Evolution of the X-ray morphology of the C9.1 long duration limb flare as seen using Al12 Yohkoh SXT filters on 29 November 1992. On the upper GOES plot, the times of images are indicated.
In the image sequence seen in Figure 5, the evolution of the ''loop-summit'' kernel shows its rise (phases a-c) most probably due to the upward force exerted on it by a system of up-winded loops crossing at the kernel. The kernel appears to split during the decay phase (d-e) together with the formation of the visible arcade. In frame (f), a loop like connection is formed between these two kernels (sketched) with the arms (rooted in these edge kernels) going far away (also drawn in frame (h).
Another example shown here has been observed by SXT on 21 September 1999 and its evolution is presented in Figure 6. Here also, kernel rise is observed (a-b), splitting into two (b-c), this time more vertical (in projection). The up-winded arms become filled with plasma, probably drawn from the kernel itself (e-g). The formation of ''hanging arcade'' with the bright edge kernels is seen around (g-h) with subsequent relaxation at (i). At this late phase down- and up-winding arms cross, as is schematically drawn on top.
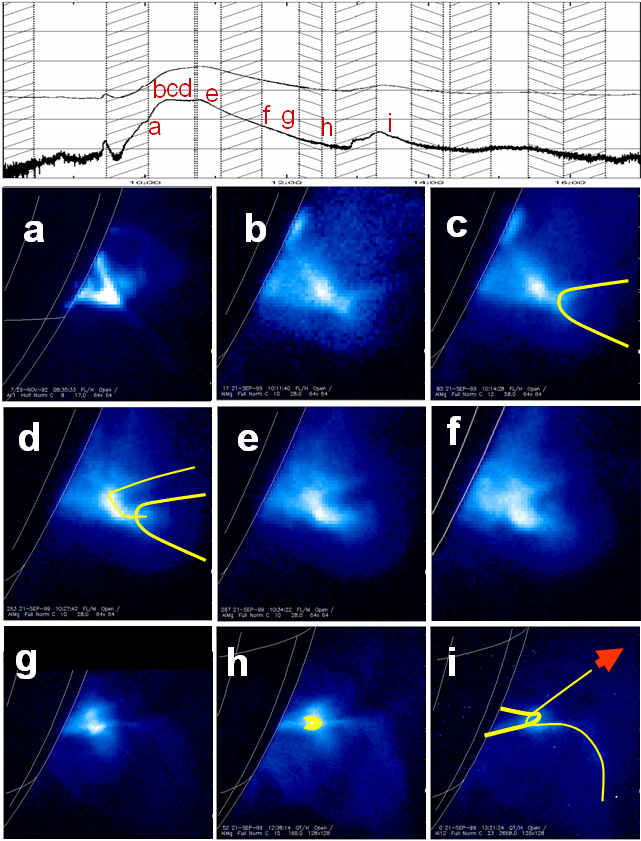
Figure 6: Evolution of the X-ray morphology of the C7 gradual rise and fall limb flare as seen using Al Yohkoh SXT filters on 21 September 1999. On the GOES plot, the times of images are indicated.
It appears from these and many other flare sequences studied that edge loop-top kernels are the root-points for the other (magnetic) connections. One of the most striking for us pattern of such magnetic rooting ''via kernels'' is shown in Figure 7. Here is seen in more details the transition of a longer structure connecting the opposite polarity regions of the atmosphere with the short, arcade-like bright emission patches at the foot-points. On the enlarged sequence, taken with cadence of few seconds, the root-points (circles) are seen to jump from one to the other side of this footpoint arcade, as the event evolve, with the corresponding change of the brightness of the longer interconnecting loop. This may indicate that the interconnecting loop is actually composed of two near-parallel threads, rooted to a pair of edge kernels of the foot-point arcade.
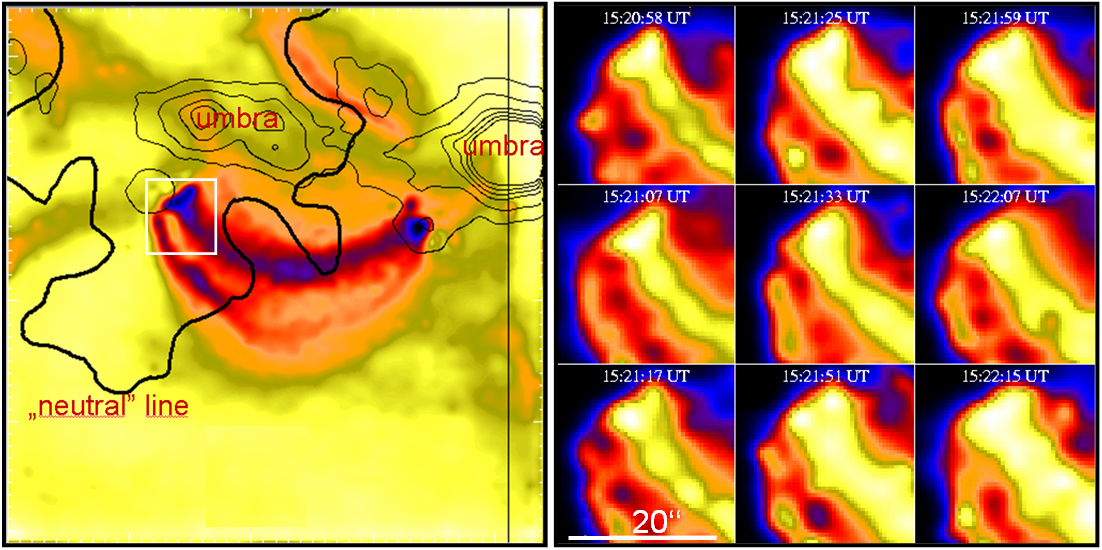
Figure 7: Left: The overlay of deconvolved SXT Al01 image (gray scale - dark indicates higher X-ray intensity) with the white light (SXT sensor) contour image. The SXT image represents the plasma being at the temperature above ~ 2 MK. The iso-contours indicate the umbrae locations. Deconvolved X-ray image represents the mean of 10 exposures taken over the period 15:20:57 UT - 15:22:20 UT on 11 July 1992 when the flare (prominent double loop) was in progress. Heavy line marks the ''neutral line'' shape as derived from the Marshall vertical magnetic field component. Right: Nine consecutive deconvolved SXT Be119 images (column order) for the indicated ''foot-point'' region of this flare. The size of individual sub-frame is 24.5 arcsec ×24.5 arcsec).
Even more illustrative in the context of ''rooting'' are images of protuberances, especially these, being ''in eruption'' where the expansion enlarges the substructures sometimes many times allowing to see them as through the magnifying glass. An example is presented in Figure 8. Here, the cool plasma resumes shapes of multiple nested arches, showing beautifully the sequence of ''rooting'' for at least three adjoining stages. It would be impossible to model this field line configuration by means of potential/force-free extrapolations from the photosphere. A particularly interesting feature is the splitting of the higher stage structures into branches at the endpoints (see magnified portions). Similar split-end branches are observed by TRACE as presented recently by Aschwanden and Title, (2004). The authors comment that the structures presented follow along dome-like and canopy-like configurations.
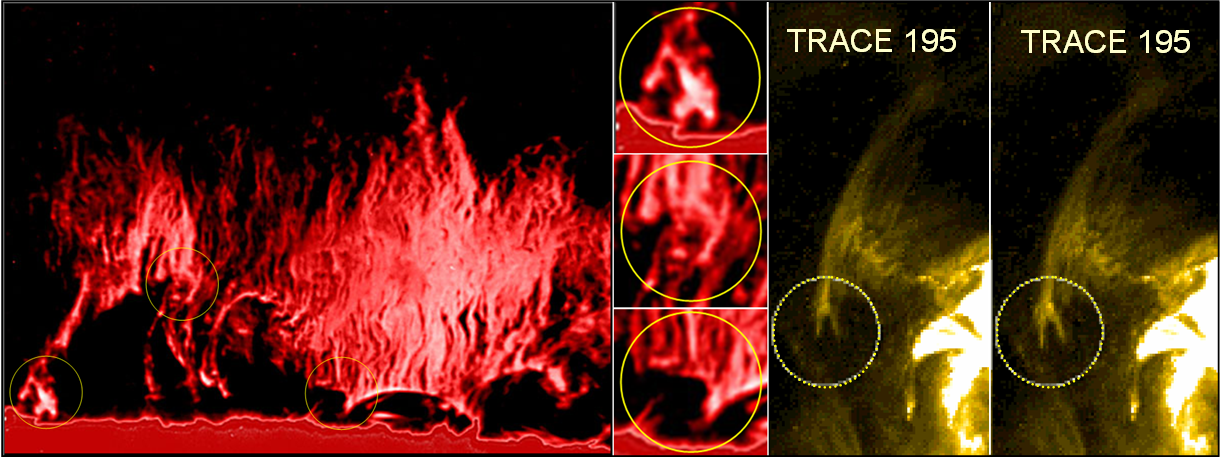
Figure 8: A small limb prominence about 50000 km high observed on 7 December 1970, showing the characteristic vertical structure which remains static while material flows downs through the magnetically defined filamentary tubes. These tubes are apparently ''anchored'' in the spine of the ''lower stage'' structure. The joints are presumably the plasma kernels where the magnetic field lines of the tube merge through the field lines of the spine. Picture was taken in Ha line. Enlarged are three regions in the picture showing the basic structures in more details. Courtesy: Sacramento Peak Observatory, John W. Evans Solar Facility (http://nsosp.nso.edu/esf/pics.html). Similar split-end branches are observed by TRACE (right two panels).
Another striking example of the arcade-like configurations comes
from the recent very high resolution observations of the
photospheric G-band structures obtained using Swedish Vacuum Solar
Telescope (SVST). In Figure 9, we present filtergrams taken in
488 nm light at the Swedish 1-meter Solar Telescope on the island
of La Palma. The image in the right panel highlights the
three-dimensional nature of the photosphere when seen at these
large angles. The structures in the dark sunspots in the upper
central area of the image show distinct elevation above the dark ''floor'' of the sunspot. The height of the structures has been
estimated to be between 200 and 450 km (http://www.lmsal.com/Press/SPD2003.html).
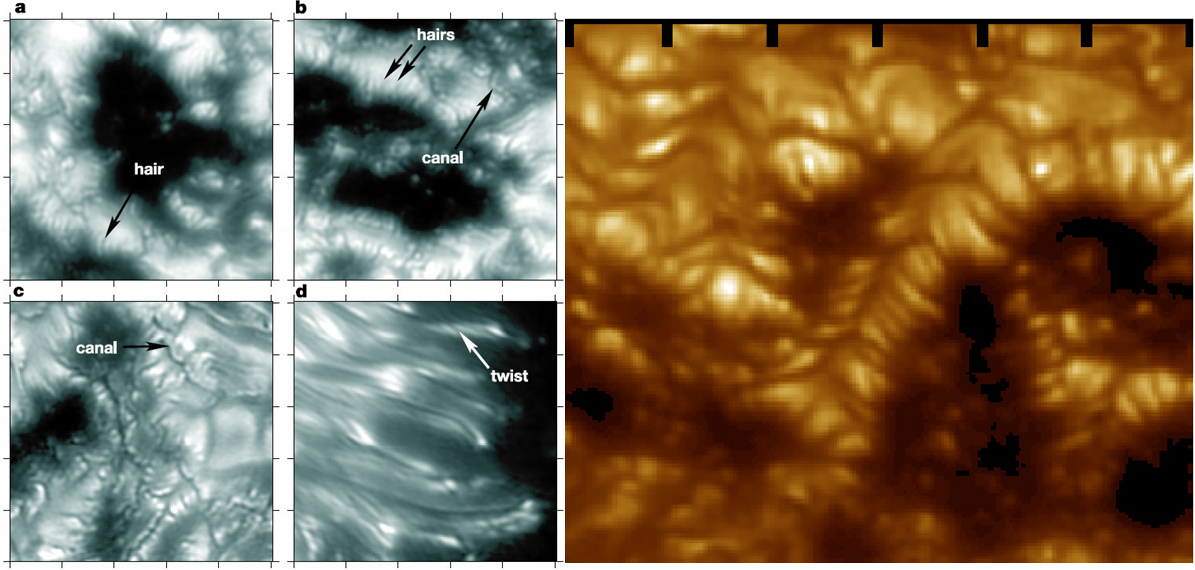
Figure 9: Left: Thin dark features in active region 10030 on 15 July 2002. For detailed description see Scharmer et. al., 2002. Right: Images of a solar active region taken on 24 July 2002 near the eastern limb of the Sun at heliographic coordinates S15 E53. The limb is towards the top of the image. The tick marks are 1000 km apart. The smallest resolvable features in the image are less than 100 km in size.
This is of particular interest to understand what is the nature of
connection between these tiny, stage one magnetized systems with
the overlying structures. In this respect studies of the highest
resolution magnetograms (MDI), ''chromospheric'' and TRACE UV-EUV
images are of particular interest. Rutten (1999), gives a nice
review in this context, showing well-coaligned images in these
ranges. A compilation made of two pictures from his paper is shown
in Figure 10. MDI/TRACE comparison shows that the
chromospheric emission pattern corresponds closely with the
photospheric magnetic field pattern, irrespective of polarity. The
bright chromospheric ''speckles'' overlie patches of positive or
negative field concentrations in the photosphere. Speckles are
somewhat asymmetric, resembling systems of tiny loops at the
TRACE resolution, corresponding possibly to dark features from
Figure 9 observed with much higher resolution. The brighter ones
are arranged in chains looking like arcades. Even more convincing
in this respect is the image at
http://www.sunspot.noao.edu/sunspot/dstwww/gifs/fill1.gif Also
reproduced on page 268 of Stix (1989) and in many other books.
What is called by Rutten ''as bright grain clusters in the
![]() wings'' might be actually a system of tiny canopies,
forming stage I structures in our description. Similar
impression provides the comparison between the G-band and
overlying Ca II structures (Figure 10, bottom images). Here the
diffuse patches of Ca II K network emission appear to consist of
bright kernels and the net of diffuse links in between. Tendency
to form arcades predominate the organization of brighter patches.
wings'' might be actually a system of tiny canopies,
forming stage I structures in our description. Similar
impression provides the comparison between the G-band and
overlying Ca II structures (Figure 10, bottom images). Here the
diffuse patches of Ca II K network emission appear to consist of
bright kernels and the net of diffuse links in between. Tendency
to form arcades predominate the organization of brighter patches.
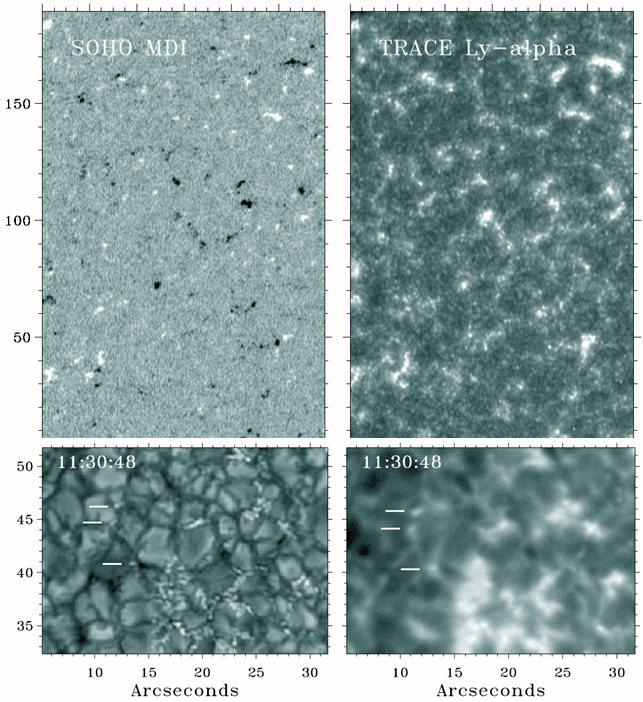
Figure 10: Upper row: Part of an MDI magnetogram and a
co-aligned part of a simultaneous TRACE
![]() filtergram (right, from Rutten, 1999: Figure 1). Lower row:
Part of a high-resolution (0.2 arcsec) G-band filtergram (bandpass
10 Å FWHM) from a sequence taken by R.A. Shine with the SVST and
simultaneous Ca II K filtergram (bandpass 3 Å FWHM) of the same
area (left, from Rutten, 1999: Figure 6).
filtergram (right, from Rutten, 1999: Figure 1). Lower row:
Part of a high-resolution (0.2 arcsec) G-band filtergram (bandpass
10 Å FWHM) from a sequence taken by R.A. Shine with the SVST and
simultaneous Ca II K filtergram (bandpass 3 Å FWHM) of the same
area (left, from Rutten, 1999: Figure 6).
So we conclude at this point that recent observations support the view of plasma being organized into systems of tiny canopies (arcades) of fluxropes joining opposite magnetic elements, as soon as they became visible from outside. Such organization is probably possible through establishing magnetic contacts across the arcade summits. This process involves the formation of turbulent kernels (of the cross-section < 100 km) at the photospheric level.
From the other global boundary of postulated, hierarchical
organization of links in the solar atmosphere, the largest
structures may be observed by the coronographs, with the
overwhelming majority of data collected by LASCO aboard
SOHO. By looking through a large archive of the images presented
in LASCO Gallery
http://lasco-www.nrl.navy.mil/public_images.html, we selected a representative shown in
Figure 11. Normally, the brightness of ''guiet'' corona is too low
for their structures to be seen clearly above ~ 2 solar radii,
except some coronal helmets and rays. The plasma higher-up in the
corona becomes visible during transient effects (different types
of CME's) when denser structures are moving out of the Sun. In the
Figure, a particular transient is seen, observed by C2
coronograph. On this and many other images of coronal transients,
the moving plasma appears to be driven outwards by stretched
magnetic configuration. Common impression is that the observed
system behaves like slingshot in action with both the rubbers and
the load outlined.
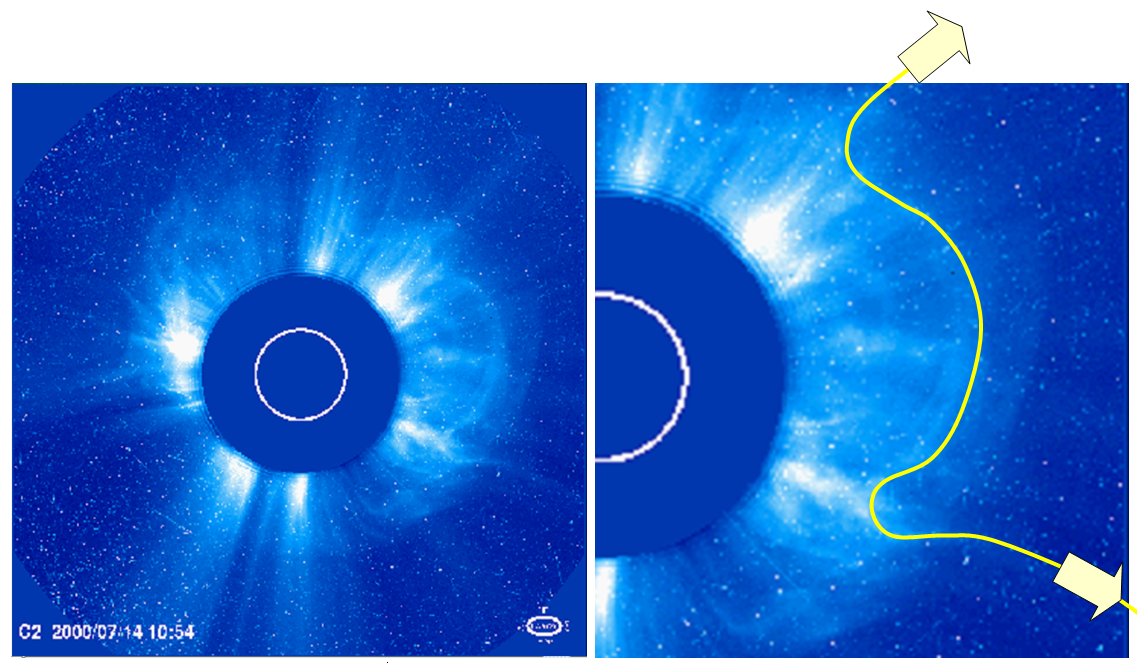
Figure 11: Observation of the large system of transient structure seen on 14 April 2000. The line drawn on an enlargement, represents a direct link between plasmas originating from active regions on both hemispheres. Envisaged stretching of the supporting magnetic field line is indicated (http://lasco-www.nrl.navy.mil/images/000714_c2eit_sm.gif).
As a consequence of looking through many of images similar to those shown above, we came to the idea of hierarchical model of organization of links in the solar atmosphere. Description of this model in more details we start with the summary of properties of its basic constituting structure.
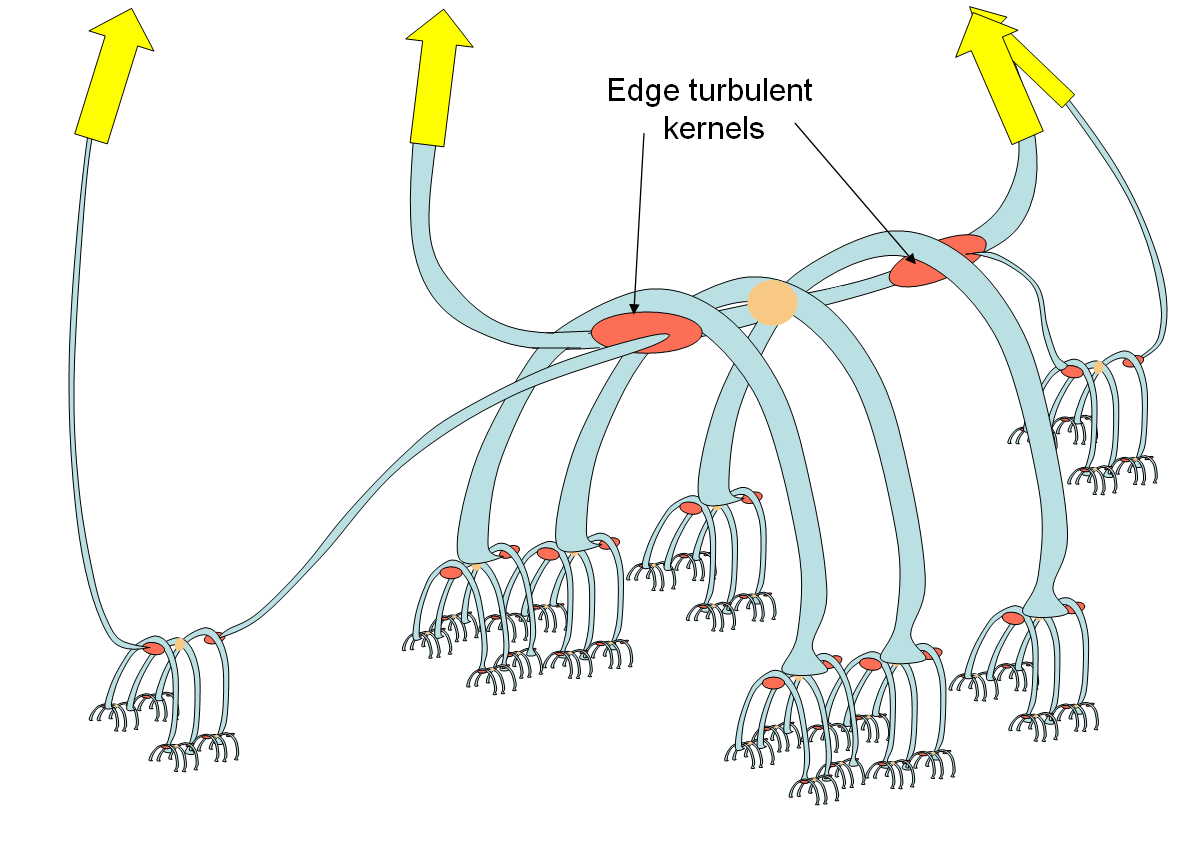
Figure 12: Proposed hierarchical structure of magnetic links in the visible atmosphere. The basic structure consists of kernels located along the arcade summits. The most active are the edge kernels within each arcade. The links to larger scale structures occur through edge kernels. Magnetic tension is represented by arrows.
In this model, we propose that the corona consists of numerous interlinked basic structures: ''spiders''. Within the body of elementary ''spider'' a number of distinctive plasma kernels and links between them are present: legs are linking to lower structures (their kernels), arms to upper. There may be many legs in the spider (more in the smaller structures) and usually less (two) arms linking to the kernels of the structure above. Down-links provide rooting to below (eventually to magnetic elements) while up-links introduce upward stress (eventually through links to solar wind). The other, more detailed properties of the spiders are listed below.
As concerns the plasma condition inside the turbulent kernel, we refer to the model presented by Jakimiec et al., (1998). For more details see also http://solarmuri.ssl.berkeley.edu/~hhudson/cartoons/thepages/Jakimiec.html.
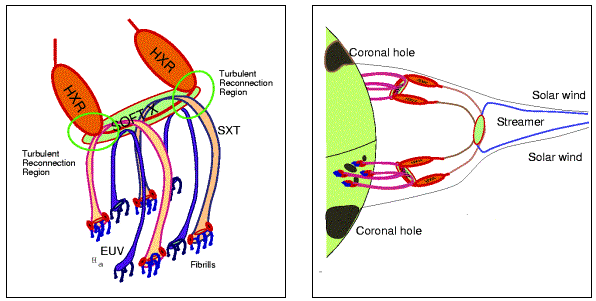
Figure 13: Simplified configuration of magnetic fiels in hierarchical model in the lower and upper corona.
Within the hierarchical equatorial structure, 6 - 7 distinct stages can be identified. Each of the stages may relate to particular solar phenomenon. In Table 1, we name and list these stages and present their basic properties.
In the turbulent kernel, magnetic field is very complicated, with the magnetic field lines strongly braided, like in skein. This effectively isolates the kernel from the surrounding atmosphere allowing it to resume symmetric shape. The plasma contained in the kernel is compressed. The only transport is allowed along those few field lines which escape outside through legs and arms. Those escaping field lines provide links to the other kernels. The filling factor in the kernel is expected to be nearly one, dropping dramatically at the edges. One can think of a bunch of magnetic field lines which emerge from particular kernel with a given mass, volume and temperature. Through each emerging field line, a stretching force (magnetic tension) acts on the entire kernel. Kernel's position and dynamics result from the balance of all such forces and the gravity. If those forces are not balanced, entire kernels may move respective each other in a complicated way. For those pairs being directly linked, this relative motion may result in acceleration/deceleration (heating/cooling) of the particles fixed to connecting field lines. Magnetic mirroring of particles trapped in the portion of ''local atmosphere'' between linked kernels is easy to imagine. The hard X-rays may came as a result of the precipitation of accelerated particles escaping from the loss cone and penetrating the surface of an associated denser kernel. This might be an equivalent of the classical scenario of high energy particles penetrating the dense transition region of a classical loop. The role of the photosphere is resumed in this case by the dense plasma contained in the kernel, and the propagation of accelerated particles takes place along the arm(s) connecting the kernel to the other one in a hierarchical system. Inside the kernel, the conditions are expected to be close to thermal, but not necessarily isothermal as the heating rate might be distributed within the kernel in many ways. Plasma flows between kernels may also take place provided necessary pressure and/or potential energy differences exist along interconnecting channels. This flows may lead to a slow filling of the spider system through the chain of most active kernels along the way to the tiniest one linked directly to dense plasma in the photospheric magnetic element. This staged filling may be taught as a counterpart of classical evaporation.
Following our earlier considerations (Sylwester and Sylwester, 1998a, Sylwester, 1999), we postulate here that most of the corona is organized in a hierarchical net of magnetic links extending from the levels just below the photosphere up to the interplanetary space. This concept, illustrated in Figure 12 is extended to links between the magnetically closed portion of the solar atmosphere (forming one equatorial hierarchical system) and the regions of fast solar wind originating from coronal holes in Figure 13.
As concerns dynamics, the reconfiguration of stage I structures is the fastest with the typical correlation times of minutes. On the largest scale, typical life-time of a global configuration constitute a fraction of solar cycle. Constant reconfiguration is however a basic property of the entire structure.
Table 1: Characteristic stages and scales of spiders in a
global equatorial hierarchical structure
[km]
[cm-3]
[MK]
(post) flaring
(low) corona
10-12
5-30
stage
size/width
feature
location
log N
T
I
300/50
phot.filament
photosphere
15
0.006
II
3000/500
blinkers, spicules
trans. region
11-13
0.006-0.1
III
10000/2000
moss, brigt points
trans. region
9-10
0.5-1
IV
50000/10000
coronal loops
(low) corona
8-9
1-5
V
150000/10000
AR interconnecting
corona
7-8
2-5
VI
500000/10000
transequatorial
corona
6-8
2-3
VII
global
streamers
upper corona
4-6
1-2
At any time,
reconnection simplify the magnetic configuration in some kernels
braking some links, and creating new interconnections, the plasma
contained spreads along the field lines. A new kernels are created
as the new magnetic flux emerge from below. Some field lines,
closing within the structure, those close to the envelope current
sheet recombine to fast solar wind gaining tension from the solar
wind plasma expanding into heliosphere. This picture, if real,
elucidate that the plasma system (under the envelope) undergoing
constant stresses is in a chaotic transient equilibrium state
(self-organized criticality) like in a sandpile. The smallest
disturbance (recombination - tether-cutting) may lead to
catastrophic energy release (flare, CME) involving a part (up to
total) of the energy contained in stressed system. Smaller, of
local importance, energy releases (micro-flares, chromospheric
explosions, various brightenings etc.) are much more common (power
law with the exponent ~ 2, Hughes et. al., 2003), like in any
self-organized system in the critical equilibrium.
The solar atmosphere can easily be imagined as the forced system
where solar magnetic fields are subject to permanent stress from
below (due to convective motions in photosphere) and above (large
scale reconfigurations on the closed/open field boundaries). If
such description is indeed appropriate for the solar atmosphere,
the consequences of such a system of self-organized links are
far-reaching.
One may ask: Single loops are generally well seen - don't they?
This is easy to imagine that one of the edge kernels is dominant,
filing preferentially only one side of the spider. In this case a
structure resembling a single loop would be seen, except with the
brighter thermal kernel at the summit - just the picture observed
by SXT.
Our model appears distinct from those yet suggested and contained
in the ''Grand Archive of Flare and CME Cartoons'' at
http://solarmuri.ssl.berkeley.edu/~hhudson/cartoons/.
Some indirect associations can be traced to models of Vlahos,
(1993)
and Gary-Moore, 2004
http://solarmuri.ssl.berkeley.edu/~hhudson/cartoons/thepages/Gary-Moore.html
5 Summary and Conclusions
It is among the most deeply rooted beliefs among solar physicist
that the solar upper atmosphere consists of a number of magnetic
loop-like structures rooted directly in individual magnetic
unipolar elements present at the photospheric level. However, the
images presented and discussed in this paper show that in numerous
cases, a ''standard single loop'' model of magnetic field
organization in solar atmosphere is certainly not an adequate
description of the complexity seen. We attempt to illustrate a
different model of plasma-magnetic field structuring in the
atmosphere. In the proposed pattern, direct, longer distance
conductive links between coronal and photospheric plasmas are
prohibited, in the contrary to the ßingle loop scenario". The
inferences drawn here may have important consequences for
understanding the behaviour of every portion of solar atmosphere.
http://solarmuri.ssl.berkeley.edu/~hhudson/cartoons/thepages/Vlahos.html
Acknowledgements
This work has been supported by the Grant PBZ-KBN-054/P03/2001 of
Polish Committee for Scientific Research.
References