1 Space Research Centre, Polish Academy of
Sciences, 51-622 Wrocław, ul. Kopernika 11, Poland
2 Astronomical Institute of Wrocław University, 51-622 Wrocław, ul.
Kopernika 11, Poland
Key words. Sun: chromosphere – Sun: corona – Sun: flares – Sun: magnetic fields – Sun: hard X-rays
According to these results:
However there are examples of flares that do not fit the above scenario. From 5 flares analysed by Sakao (1994) for which magnetograms were available, one has a brighter footpoint located in the stronger photospheric magnetic field region. Asai et al. (2002) also reported an example of a flare for which the stronger footpoint was found in a stronger magnetic field.
Double sources are interpreted as regions of precipitation of non-thermal electrons along the legs of the magnetic loop (Sakao 1994, Kundu et al. 1995, Li et al. 1997, Aschwanden et al. 1999). In such a model a weaker convergence of the magnetic field lines in a loop's leg with a weaker magnetic field allows more electrons to reach the chromosphere and vice versa. During the impulsive phase of a solar flare, hard X-ray emission is often connected with microwave radio emission. Radio emission should be correlated with the magnetic field, so in asymmetric loops the strongest microwave emission should appear at the footpoints together with weaker hard X-ray emission. This was confirmed by observations made by Kundu et al. 1995.
For the majority of the observed flares authors usually restore a few HXT images during the impulsive phase. In most cases this is the result of low measured counts in HXT channels. These images are averaged over accumulation times of a dozen seconds or so. Thus it is hard to catch relative changes with time between footpoints and usually only a single value of asymmetry is calculated for given flare. In our investigation we have found an example of a strong flare for which many images with cadences as high as 0.5-1 sec could be restored. This flare shows strong asymmetric time dependence of the hard X-ray footpoint emission. The analysed flare occurred on 25 August 2001, having a peak GOES intensity of X5.3.
In a previous paper (Falewicz et al. 2002) we analysed a moving feature visible in hard X-rays (Yohkoh/HXT). The moving feature was seen between 16:30:06 UT and 16:31:09 UT. This feature moved in a south-west direction with a velocity of about 450 km/s. The moving source was visible in all HXT channels up to channel H (53-93 keV). We have found a strong connection of this structure with EUV kernel emission moving along bright, low lying Transition Region and Coronal Explorer (TRACE) EUV loops. We interpreted this moving structure as plasmoid-like. Metcalf et al. (2003) analysed this moving feature in a more detailed way, using TRACE white-light channel, Yohkoh/HXT data and additionally Michelson Doppler Imager (MDI; Scherrer et al. 1995) data from the Solar and Heliospheric Observatory (SOHO) satellite. They found that this feature is moving along a magnetic separatrix. According to these authors this is evidence in favour of particle acceleration models, which energise the electrons via magnetic reconnection at magnetic separators. Another possibility is that this source corresponds to the end of reconnected magnetic loops. This may suggest that the earlier reconnections lead to more highly sheared loops, with the later ones less sheared. This kind of observation is presented in the paper by Somov et al. (2002) in the analysis of the "Bastile Day 2000" flare. Such a mechanism can also operate in our event because a clear arcade of loops can be seen in the TRACE/EUV images after 18:00 UT.
In this paper we concentrate mainly on the analysis of the hard X-ray (HXR) emission in the footpoints and in the loop-top kernel. We try to explain the observed behaviour of the footpoint hard X-ray asymmetry as the differences in the injection conditions in each loop leg. In Sect. 2 we describe the available observations of this flare. In Sect. 3 we present and discuss the asymmetry of hard X-ray footpoint emission and its possible causes. The energy and time behaviour of the spectral slope (gamma index) of the HXR spectrum is presented in Sect. 4. We summarise and discuss the results obtained in Section 5.
The active region NOAA AR 9591 appeared on the east solar limb on 21 August 2001 and disappeared behind the west limb on 4 September 2001. This very active region had a beta-gamma-delta magnetic configuration and produced 26 flares including one X, four M and twenty-one C events on the GOES rating. The most intense flare (X5.3/3B) occurred on 25 August at S17E34 (see SGD Data). The flare began at 16:24 UT, peaked at 16:45 UT and ended after 21:00 UT. The main flare was preceded by the three precursors at 14:45 UT, 15:35 UT and 16:18 UT, all occurring in the same active region. This flare was well observed by a number of space observatories (Yohkoh, SOHO and TRACE).
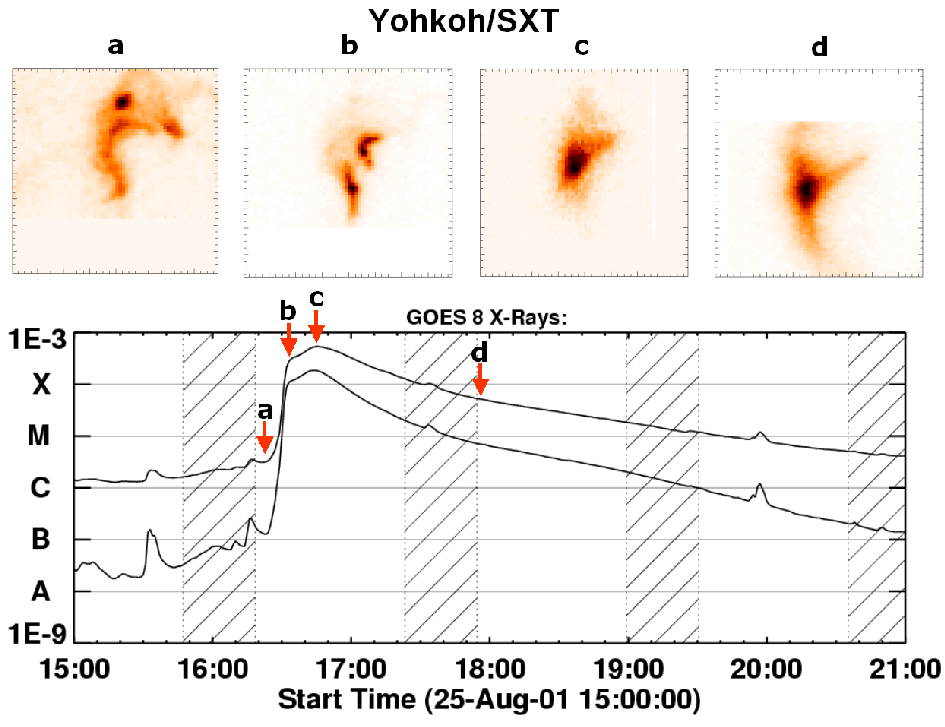
Figure 1: Yohkoh Soft X-Ray Telescope (SXT/Be119) images (upper panel) and GOES 8 lightcurves of the 25 August 2001 flare (below). The arrows indicate the time of the images on the GOES light curves. The images are each 160 arc sec × 160 arc sec with 2.5 arc sec pixels.
The Yohkoh satellite observed this flare from 16:18 UT, during four consecutive orbits up to about 22:00 UT. In Figure 1 we present the soft X-ray images observed with the Yohkoh Soft X-ray Telescope (SXT; Tsuneta et al. 1991) during different phases of the flare. The arrows indicate the times of the images on the GOES light curves. The flare began with the brightening of a large loop system as seen in an SXT image at 16:25:57 UT (picture a in Figure 1. However, the main rise phase of the flare began with the interaction of two small, lower-lying loops seen at 16:30:05 (picture b in Figure 1). These loops connected and developed into a bright flare kernel at flare maximum, at about 16:46 UT (picture c in Figure 1). Finally this flare kernel rose slowly and cooled during the next few hours (picture d in Figure 1). Yohkoh/HXT recorded very strong emission in all of the four channels during the impulsive phase. Thus, a high flux was seen in the H (53-93 keV) channel of HXT from 16:29 UT for 6 minutes, with a maximum flux of 2500 counts/sec/subcollimator. After 16:31:30 UT the error amplitude in the low energy channel L (14-23 keV) increased significantly. This effect is consistent with detector saturation or overloading. After 16:31:30 UT we cannot reconstruct reasonable images from this channel data.
This flare was a particularly energetic event. Yohkoh's Wide Band Spectrometer (WBS) observed gamma-ray emission up to 10 MeV with nuclear lines evident at 1.63 MeV and 2.22 MeV. Gamma-ray emission with energies up to 100 MeV were also observed by the Russian gamma-ray spectrometers (SONG) on the Koronas F satellite (http://www.coronas.ru/skl/data-song/250801.html).
This flare was also associated with a strong coronal mass ejection (CME) event. The CME was seen as early as 16:27:10 UT by the SOHO Large Angle Spectroscopic Coronograph (LASCO) C2 at a distance of a few solar radii. According to the SOHO/LASCO CME Catalog (http://cdaw.gsfc.nasa.gov/CME_list/) a fast, bright front initially filled the south-east sector at 16:50 UT and was a full halo CME in C2 by 17:26 UT. The estimated CME velocity was 1130 km/s over this period.
TRACE (Handy et al. 1999) observations indicate a strong white light flare and a large EUV (284Å and 195Å) post flare loop system. Magnetograms of the active region before and after flare were obtained from SOHO/MDI images at 16:03 UT and 17:39 UT respectively.
Hard X-ray images of the flare were obtained using the standard pixon reconstruction procedure (Metcalf et al. 1996). We have used variable accumulation times assuming a threshold count rate of 200 counts in the H band (53–-93 keV), giving a range of accumulation times from about 0.5 -– 1.0 seconds during the flux maximum (about 16:30-–16:33 UT).
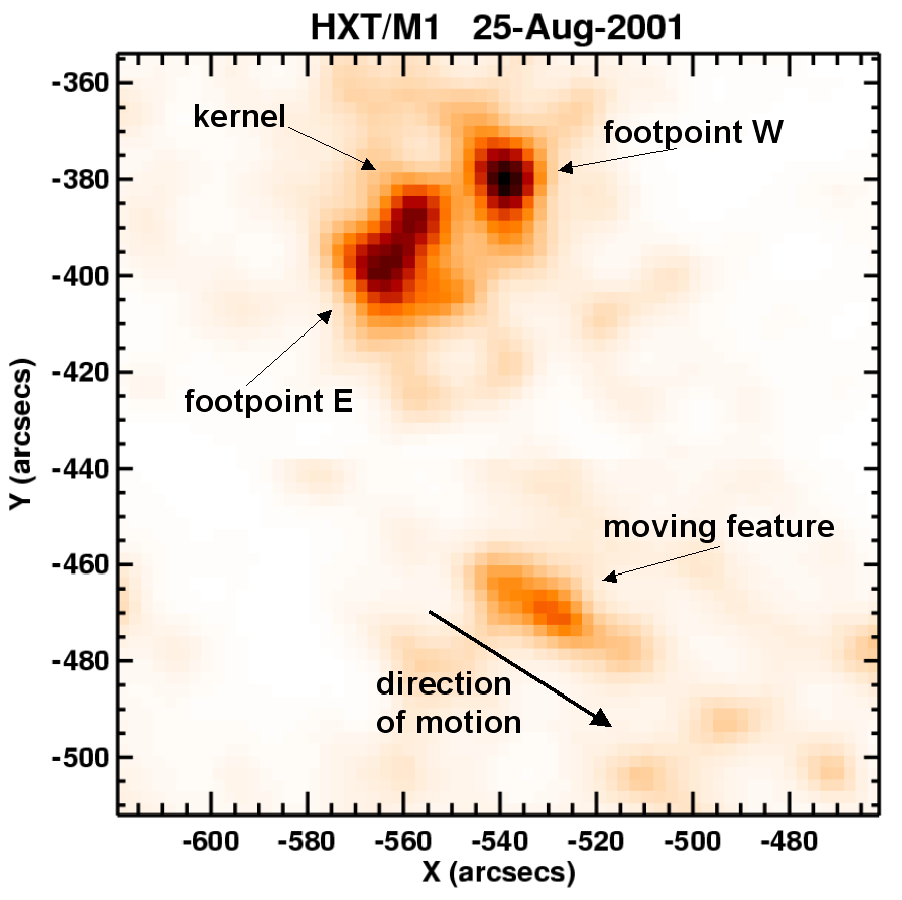
Figure 2 shows an image obtained from the M1 channel (23-33 keV) over the period 16:28 UT - 16:33 UT. Two structures are evident: the first we interpret as a flare loop and the second a moving feature. Between 16:28 UT and 16:32 UT two bright footpoints were seen in the flare loop. After 16:32 UT a bright loop-top source developed.
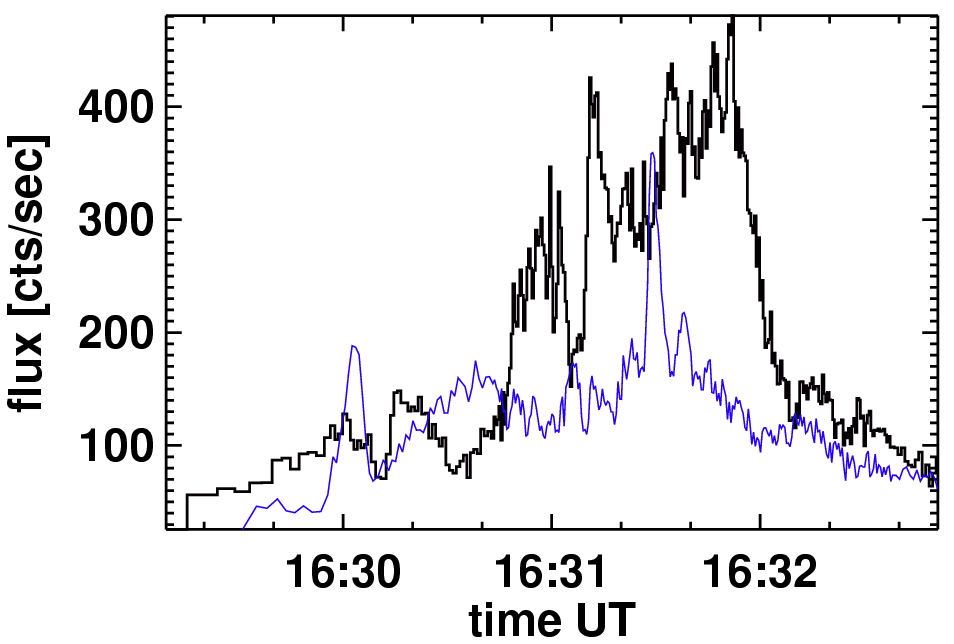
Figure 3: Light-curves of hard X-ray footpoint sources obtained in the M1 channel of HXT. Strong quasi-periodic oscillations are seen. The thinner line (blue) corresponds to the flux measured at footpoints E and thick to the footpoints W.
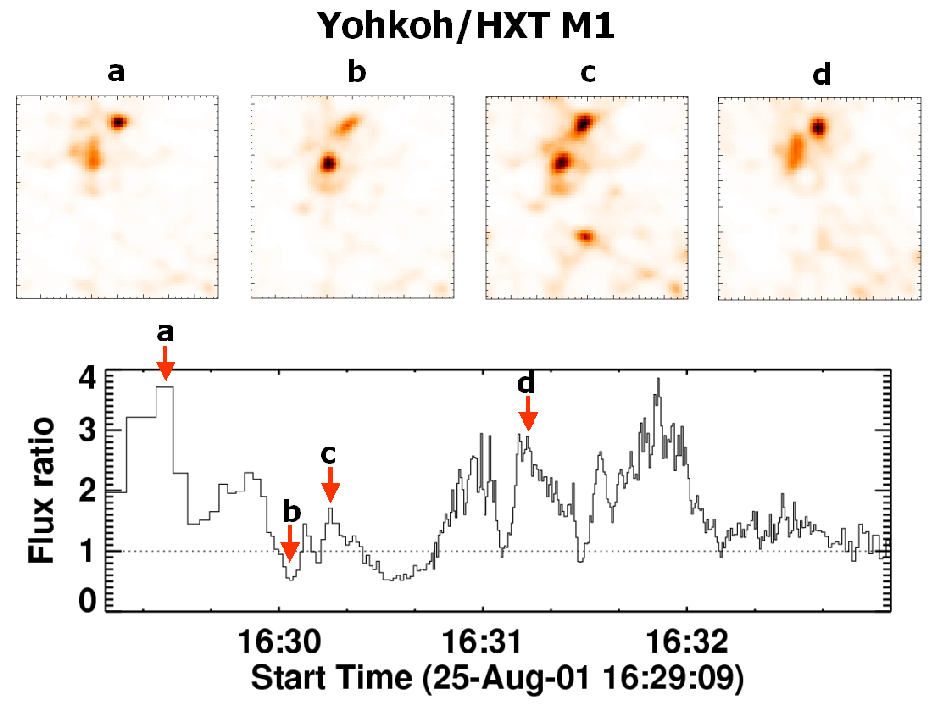
Figure 4: Lower panel: Flux ratio of the E and W footpoints as obtained in the HXT/M1 channel. Upper panel: Images of emission in HXT/M1 for selected moments of time. The arrows indicate the times of the images on the flux ratio curves.
Both footpoint sources presented in Figure 2 indicated fluctuations in both flux and position. We have calculated the flux in each footpoint summing countrates in adjacent co-moving boxes. Figure 3 presents the light- curves for each footpoint as measured in channel M1. The observed variations are very obvious in a movie obtained from the reconstructed images. Figure 4 presents four images from this movie obtained at channel M1 at 16:29:40 UT, 16:30:15 UT, 16:30:22 UT and 16:31:23 UT respectively. It is seen that the initially brighter footpoint W weakens and at 16:30:15 UT is less bright than footpoint E, but after some time it again starts to dominate after 16:31:20 UT. The fluxes in the individual structures were derived from the reconstructed images for three channels, namely M1, M2 and H. The fluxes were derived for all four structures presented in Figure 2.
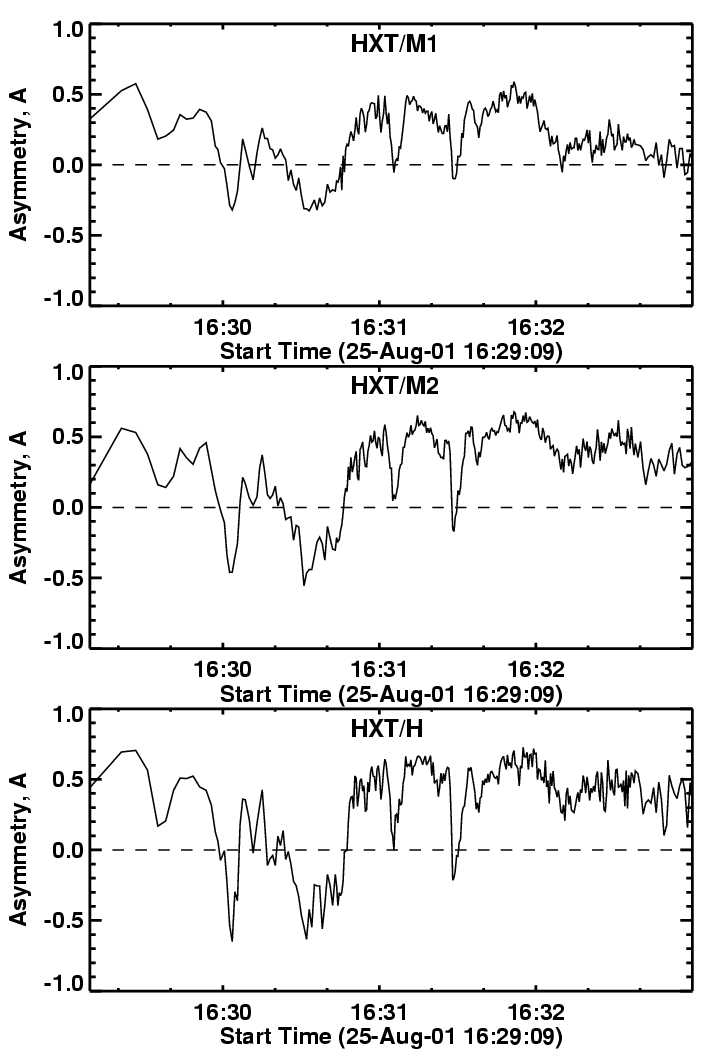
We defined asymmetry by A=(FW- FE)/(FW+FE) where FW and FE are the fluxes at footpoints W and E respectively. For full symmetry FW=FE, and A = 0; for perfect asymmetry A=±1. The time profiles of the asymmetry in the three HXT channels are presented in Figure . Strong time variations can be seen in the range up to A=±0.7. Changes of the asymmetry are similar in all the channels but in the channel H they are the strongest.
It is hard to explain the observed changes assuming photospheric magnetic field oscillations. One possible reason for flux changes in loop footpoints is that there are movements of the loop anchorages in the strong gradient of the magnetic field. Figure shows the positions of the footpoints E and W as a function of time, superimposed on a TRACE WL 1700Å image. The white line in this Figure shows the magnetic neutral line as obtained from the SOHO/MDI magnetogram. Footpoint E is located near the penumbra of the large spot and moves on average in the NE direction, to the centre of the spot. Similarly, footpoint W is located near the more complicated penumbra of the leading spot and moves in a SW direction. Generally, both footpoints move in opposite directions relative to the magnetic neutral line. During this motion both footpoints approach and then recede from the neutral line. The amplitude of this motion is about 7". Similarly, there is clear evidence of footpoint movement, as now reported by the Reuven Ramaty High-Energy Solar Spectroscopic Imager (RHESSI; Lin et al. 2002) satellite observations (Fletcher and Hudson, 2002). According to Masuda et al. (2001) two kinds of motion, parallel and vertical to the magnetic neutral line, are observed in the hard X-ray kernels within the flare ribbons. Assuming that pairs of hard X-ray sources correspond to the two ends of reconnected magnetic loops, this result suggests that the earlier reconnections lead to more highly sheared loops, with the later ones less sheared. This kind of observation introduces a new way of studying the 3-D coronal field dynamics as presented e.g. in the paper by Somov et al. (2002) (see their figures 5 and 6).
We have estimated the footpoints' magnetic flux using the SOHO/MDI magnetogram. It is hard to estimate the true magnetic fields because of uncertainties in relative HXT and MDI co-alignment and locations of both footpoints in a strong magnetic field gradient. It can be in principle possible to use pointing information of the HXT and MDI but we prefer direct cross-correlation of appropriate images.
We use the fact that in practice, there is a good correspondence between bright moving structure observed by Yohkoh/HXT and TRACE EUV kernels or knots (Falewicz et al. 2002). Thus, we can assume good co-alignment of both instruments. To calculate the magnetic field at the footpoints, MDI maps were corrected for solar rotation and converted from SOHO-view to Earth-view point. Next, for more precise alignment, MDI continuum images of sunspots were correlated with TRACE WL maps. We found that MDI images should be shifted by 7".6 to the north and 6".4 to the east. After the co-alignment of MDI and HXT images the magnetic field was calculated as the mean value of nine pixels around the position of centre of gravity of the HXT footpoint images. The estimated magnetic field in the W footpoint changes in the range 800 - 1100 Gauss. For the footpoint E the field changes in the range of -400 to -200 Gauss. The ratio of magnetic fields at these footpoints is greater than 2. According to Melrose and White (1979), Sakao (1994) and Aschwanden et al. (1999) in such a case in the hard X-ray one footpoint should dominate all the time. So in our opinion, observed movements of the loops footpoints in the presence of the magnetic field gradient cannot explain the observed strong asymmetry variations.
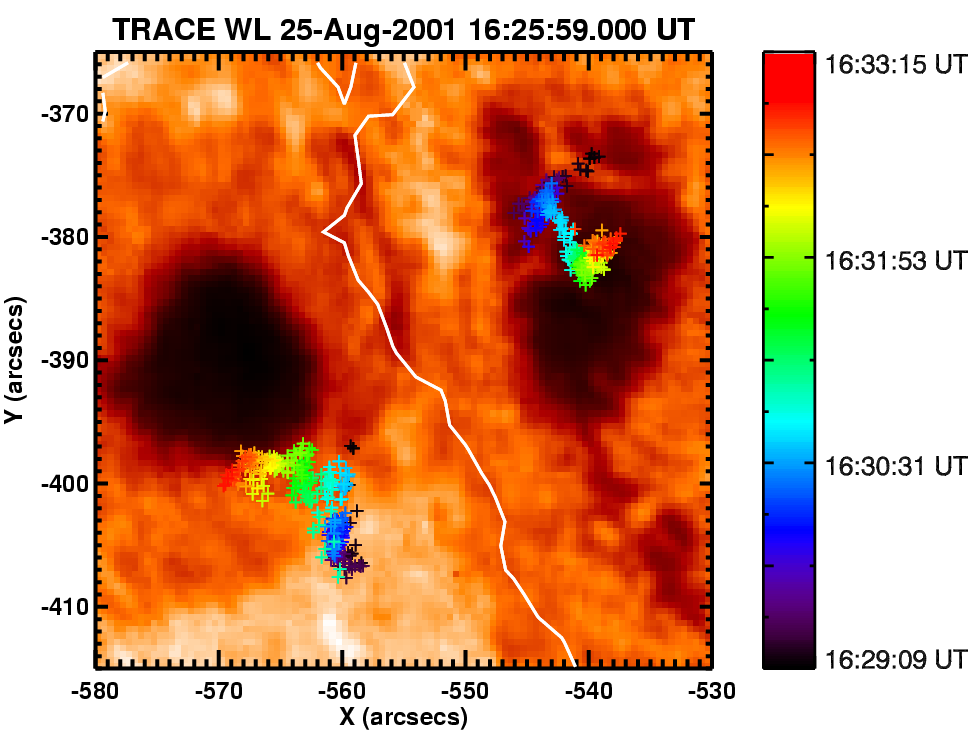
Figure 6: Image of the TRACE WL data at 16:25:59 UT overlaid with positions of the footpoints E and W as function of time and magnetic neutral line (white line).
It seems that observed effects may be connected to the mechanism of energy release. The simplest one is the mechanism that allows asymmetric injection of non-thermal electrons into each loop leg. An attractive candidate for the above-mentioned mechanism of energy release is a turbulent kernel located near the top of the flaring loop (Jakimiec et al. 1998). In such a kernel, electrons moving along the loop legs (and emitting HXR at footpoints) are produced at small-scale reconnection sites, independently in both legs of the loop. Quasi-continuous changes of asymmetry can tell us about the time or spatial scale or the number of these elementary processes. One of the possible realisations of this mechanism may be a configuration in which the magnetic field is stressed by the plasma contained. This process continues as long as the magnetic pressure in the region of MHD turbulence is higher than the plasma pressure. In this state, electrons are still accelerated in the stressed, turbulent plasma until its pressure reaches the magnetic pressure causing plasma ejection in a given direction. This process can be repeated in a quasi-periodic manner producing local maxima in the hard X-ray emission and microwaves, until the energy (contained in the magnetic field) is exhausted. The expected effects are in good agreement with observations (Aschwanden & Güdel 1992; Kundu et al. 1994).
According to Melrose and White (1979) we can consider two additional possible models. In the first one, the source of asymmetry can be a different scattering rate for particles moving into both legs. In the second one, the source of asymmetry can be a asymmetric way of injection (or acceleration within the trap) of the energetic particles. A detailed model of the asymmetry in the trap plus precipitation scenario was elaborated by Aschwanden et al. (1999). The authors found that the asymmetry is inversely correlated with the trapping efficiency. Symmetric traps account for the highest trapping efficiency. The spatial asymmetry of magnetically conjugate HXR footpoint sources provides important information to estimate coronal magnetic field in a flare loop and to constrain the resulting particle kinematics. The authors concluded that this information is necessary to understand the resulting photon bremsstrahlung spectrum at both footpoints.
Information about the electron energy distribution can be also obtained from the analysis of the hard X-ray spectral slope, given by the spectral index, gamma.
We have calculated gamma for power-law energy distributions using standard Solarsoft procedures for two ratios channels, namely M2/M1 and H/M2. The minimum values of gamma for all four structures are between 2 and 2.5 from the M2/M1 and H/M2 ratios respectively. The maximum values do not exceed 6.0 in either case. Like the asymmetry index A, the spectral gamma index also indicates strong time variations. But in general, a clear soft-hard-soft spectral behaviour can be seen. This is typical for the majority of large solar hard X- ray flares and was revealed from the earliest hard X-ray observations (Parks & Winckler, 1969). Recent examples are presented from the RHESSI and HXRS instruments (Hudson and Farnik, 2002; Fletcher and Hudson, 2002). The soft-hard-soft pattern can be observed in the individual impulsive peaks on time scales of seconds or minutes, or during the whole flare. For some long-duration flares a continuous hardening of the X-ray spectra (or at least not softening) after the peak of the gradual burst is observed (Cliver et al. 1986). According to Kiplinger (1995) this soft-hard- harder pattern correlates well with solar proton events.
Values of the spectral gamma index obtained from the M2/M1 ratio are different from those obtained from the ratio of H/M2. The spectral gamma index obtained from higher energies (H/M2) is usually higher at the beginning of the flare. Concerning the footpoints this may be a result of the high-energy electrons remaining longer in the magnetic trap. It is interesting that the differences between spectral gamma indexes obtained from M2/M1 and H/M2 increased linearly with time. As an example, Figure presents this behaviour for the footpoint E. The two left panels in Figure show the gamma indices calculated from different energies. The right panel presents the difference of these indices. We found that the average of one sigma errors of spectral index gamma are 0.4 and 0.34 for M2/M1 and H/M2 respectively. These errors give an uncertainty of the linear coefficient slope for differences in gamma presented in Figure 7 of 10 %. The difference of gamma indices (D gamma index) for footpoint E changes from -2 to +1.5 (between 16:29 UT and 16:33 UT). A similar linear behaviour of the gamma index differences is shown for the footpoint W and the loop-top kernel. The value of this difference for the footpoint W changes from -1 to 0.2. For the loop-top kernel these differences are very similar to the footpoint E values and are from -2 to 1.5 respectively. Only for the plasmoid-like moving feature is the change of the gamma difference not linear.
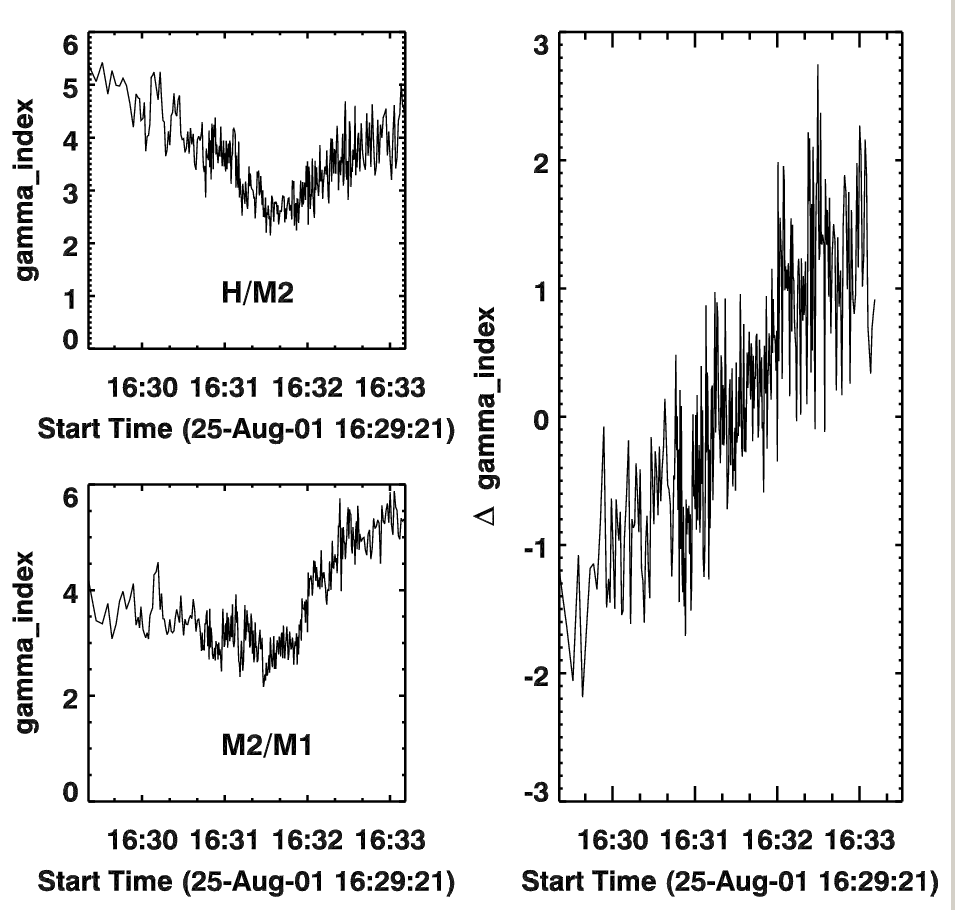
Figure 7: Two left panels show the spectral gamma indexes calculated from different energies for the footpoint E. The right panel presents the difference of these indexes.
This difference of the spectral gamma index means that at higher energies the spectrum hardens with time. For a better illustration of the described effect Figure presents an example of the HXR spectrum for footpoint E for three moments of time. Letters denote average values of the energy for HXT channels and numbers (colors) denote the time sequence. At the beginning (1) component M1-M2 is harder than component M2-H. Next, (2) components M1-M2 and M2-H have the same slope. At the end (3) we observe that component M1-M2 is softer than component M2-H.
This kind of spectral evolution is well known in the literature. From 93 HXRBS flares observed by SMM (Dulk et al. 1992), 60 contain one or more bursts that reverse their spectrum, from one that breaks down near the peak to one that breaks up sometime during the decay.
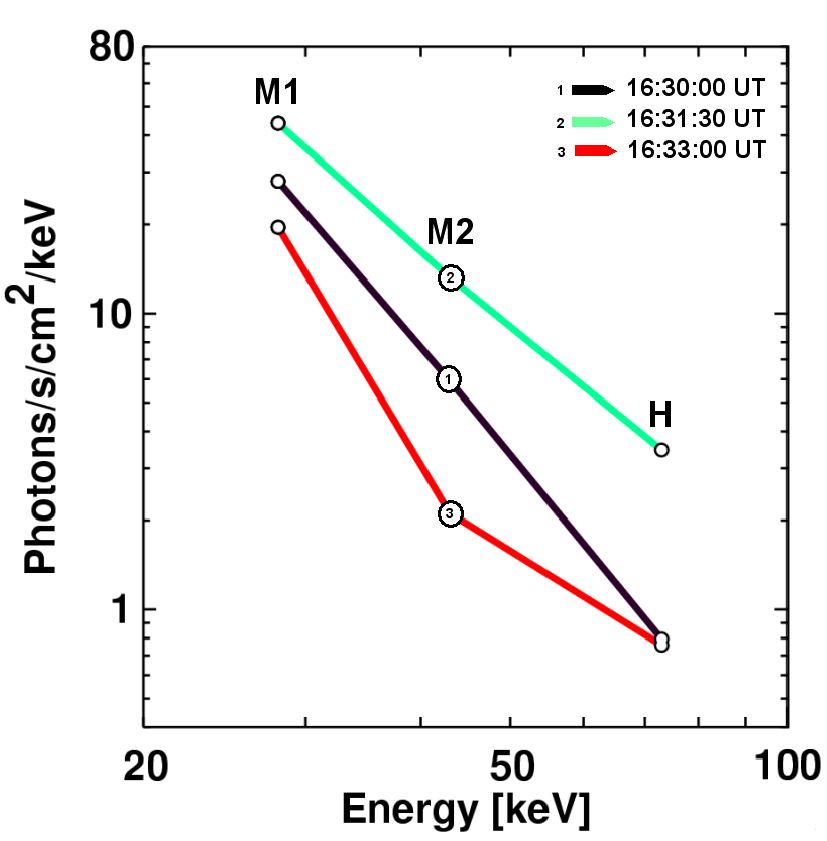
Figure 8: Example behaviour of gamma index for footpoint E. Letters denote average values of energy in the HXT channels (M1, M2 and H). Numbers (colors) denote the time succession.
Relative hardening with time of the spectrum at higher energies can put constraints on the models of both the generation and propagation of electron population during the flare impulsive phase. Still more constraints can arise from linear hardening of the spectrum.
Qualitatively the same kind of evolution of the spectral gamma index as for the footpoint E was present in the footpoint W and the flare kernel. This may indicate the same mechanism of acceleration. However, different values of spectral gamma indices and dissimilarity in ranges of D gamma index variations indicate different population of electrons in both footpoints. While differences in spectral evolution can in principle provide information about the acceleration mechanism, they can also just reflect transport effects. In addition HXT has somewhat limited spectral resolution. The much better spectral resolution of RHESSI may help to address these issues.
For the majority of the observed flares authors usually restore a few HXT images during the impulsive phase. In most cases this is the result of low measured counts in HXT channels. These images are integrated over relatively long timescales (a dozen or so seconds). So it is hard to catch relative changes with time and usually only one (see for example Aschwanden et al. 1999 and their single asymmetry values for 54 flares) or a few asymmetry values are calculated for given flare before the RHESSI era. This single value of asymmetry has a simple interpretation: the brighter the footpoint the weaker the magnetic field convergence (e.g., Sakao 1994). In a stronger magnetic field, more electrons are reflected in the magnetic mirror back into the top of the loop. However there are examples of flares that do not fit this scenario. From 5 flares analysed by Sakao (1994) for which magnetograms were available, one has a brighter footpoint located in the stronger photospheric magnetic field region. Asai et al. (2002) also reported an example of a flare for which the stronger footpoint was found in a stronger magnetic field.
We have found an example of a strong, well-observed flare for which the evolution of footpoint asymmetry can be traced. In this flare strong, quasi-periodic changes in the asymmetry occur over a few minutes. It is hard to explain these changes assuming photospheric magnetic field changes or oscillations. A possible reason for the flux changes in the loop footpoints are the movements of loop footpoints in the magnetic field with strong gradient. In our case, it can be seen that both footpoints really do move. On average they move in opposite directions, the footpoint E moves in the NE direction, and the footpoint W in the SW direction.
The estimated magnetic field in the W footpoint changes over the range of 800 - 1100 Gauss. For the footpoint E, the field changes in the range -400 to -200 Gauss. The ratio of magnetic fields at these footpoints is nearly constant, so the W footpoint should continuously dominate. Hence it is hard to explain the observed strong asymmetry variations using the observed movements of the loop footpoints in the presence of the strong magnetic field gradient.
Another possibility can be related to the means of the energy release. It seems that the energy source produces fluxes of non-thermal electrons that change with time and distributes these fluxes in a different way into each loop leg.
The simplest explanations of the observed asymmetry are mechanisms that allow an asymmetric injection of the electrons into each loop leg.
An attractive candidate for such an asymmetric source of energy release is a turbulent kernel located near the top of the flaring loop (Jakimiec et al. 1998). Such a turbulent kernel can inject electrons independently in each leg.
One of the possible realisations of this mechanism may be a configuration in which the magnetic field is stressed by the plasma contained. This process continues as long as the magnetic pressure in the region of MHD turbulence is higher than plasma pressure. In this state, electrons are still accelerated in the stressed, turbulent plasma until its pressure reaches the magnetic pressure, causing plasma ejection in a given direction. This process can be repeated in a quasi-periodic manner producing local maxima in the hard X-ray emission and microwaves, until the energy (contained in the magnetic field) is exhausted. The expected effects are in good agreement with observations (Aschwanden & Güdel 1992; Kundu et al. 1994).
According to Melrose and White (1979) we can consider two additional possible models. In the first one, source of asymmetry can be a different scattering rate for particles moving into both legs. In the second one, the source of asymmetry can be asymmetric injection (or acceleration within the trap) of the energetic particles. A detailed model of the asymmetry in the trap plus precipitation scenario was elaborated by Aschwanden et al. (1999). The authors found that the asymmetry is inversely correlated with the trapping efficiency. Symmetric traps account for the highest trapping efficiency. The spatial asymmetry of magnetically conjugate HXR footpoint sources provides important information to estimate coronal magnetic field in a flare loop and to constrain the resulting particle kinematics.
Information about the electron energy distribution and acceleration mechanisms also can be obtained from the analysis of the spectral gamma index and its changes with time. Similarly to asymmetry, the gamma index also exhibits strong time variations. In general, a clear soft-hard-soft behaviour can be seen. This is typical for the majority of large solar flares.
Values of the spectral gamma index obtained from the M2/M1 ratio are different from those obtained from H/M2 ratio. The gamma index obtained from higher energies (H/M2) is usually higher at the beginning of the flare. It is interesting that the differences between spectral gamma indices obtained from M2/M1 and H/M2 increase linearly with time. Such a linear behaviour of the gamma differences is present for both footpoints and the loop-top kernel. Only for the plasmoid-like moving feature is the behaviour of the gamma index differences not linear.
Different values of the spectral gamma index obtained from M2/M1 and H/M2 ratios indicate possible double power-law spectra with a break point energy between 35-60 keV. According to Lin at al. (1987) the double power-law shape may indicate a DC electric field acceleration. Test particle simulation (see Dmitruk et al. 2003 for the latest summary) in a dynamic 2-D MHD current sheet indicates that turbulence can temporarily trap particles in strong electric field regions and accelerate them to large energies. This argues that the effects observed in the analysed flare are not contradictory to the presence of the turbulent kernel at the top of the loop connecting both footpoints.
Both footpoints have different spectral gamma indices and the evolution of these indices is also different. Additionally the higher energy spectrum hardens with time, and this relative hardening also occurs in a different manner for aech footpoint. All these features indicate different population of electrons in both footpoints. These different populations are in our opinion the real reason for the observed asymmetry rather than the magnetic mirroring effect.
We are grateful to J. Jakimiec and J. Sylwester for reading the manuscript and helpful discussions. We also thank the unknown referee for useful comments and suggestions. MS has been supported by the Polish Committee of Scientific Research, grant number PBZ KBN 054/P03/2001. RF has been supported by the grant No. 2 PO3D 001 23 of the Polish Committee of Scientific Research.