In solar-terrestrial terms the homologous flares are these events which occur repetitively in the same active region, with essentially the same position and with a common pattern of development. We ask the question whether the five moderate size flares (GOES M class, see Table 1) observed on 1991 December 9 in the active region NOAA AR 6966 belong to this category of flares. From the similarity of the flares' light-curves, one may classify them as homologous. In order to assess the similarity of their development we studied their morphology and dynamics based on the observations collected by BATSE and Yohkoh.
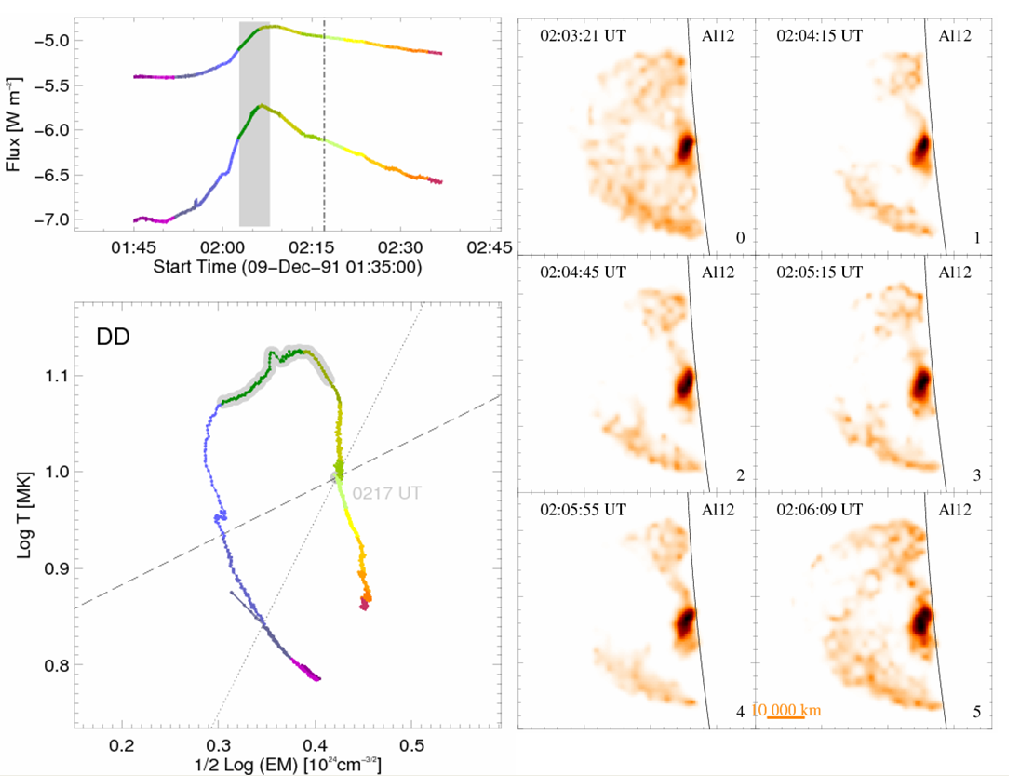
Figure 1: The evolution of flare A in the soft X-ray radiation. Left: The GOES lightcurves with the shaded box indicating time interval of the SXT observations. Below the diagnostic diagram (DD) is presented as constructed based on GOES data. Right: The evolution of flare morphology as seen on the deconvolved SXT Al21 images.
The GOES soft X-ray (3s) fluencies have been used for investigation of flare evolution tracks on the temperature-emission measure diagnostic diagrams (DD).
For the investigated flares we performed deconvolution of sequences of Yohkoh Soft X-ray Telescope (SXT) images in order to increase spatial resolution (down to 1 arcsec). This has been made with ANDRIL algorithm (Sylwester and Sylwester, 1998). We also reconstructed the hard X-ray images using the data from Hard X-ray Telescope (HXT) and the maximum entropy method (MEM). Next we compared the hard and soft X-ray flare morphology and location of emission kernels. From the Yohkoh Bent Crystal Spectrometer (BCS) observations, we analyzed the spectral shapes of the S, Ca and Fe He-like resonance lines, deriving the position of line centers, widths and total intensities. In addition we used GOES "3s" fluxes in order to investigate the flare evolution in the so-called diagnostic diagrams (DD). The DD represents the (log-log) evolutionary tracks of the flare temperature versus the square root of emission measure. The observed pattern of the evolution in the DD can be interpreted based on the results of the hydrodynamic modeling (HD), especially as concerns the character and duration of flare in-situ heating. This type of the flare heating analysis has been proposed by Jakimiec et al., (1992).
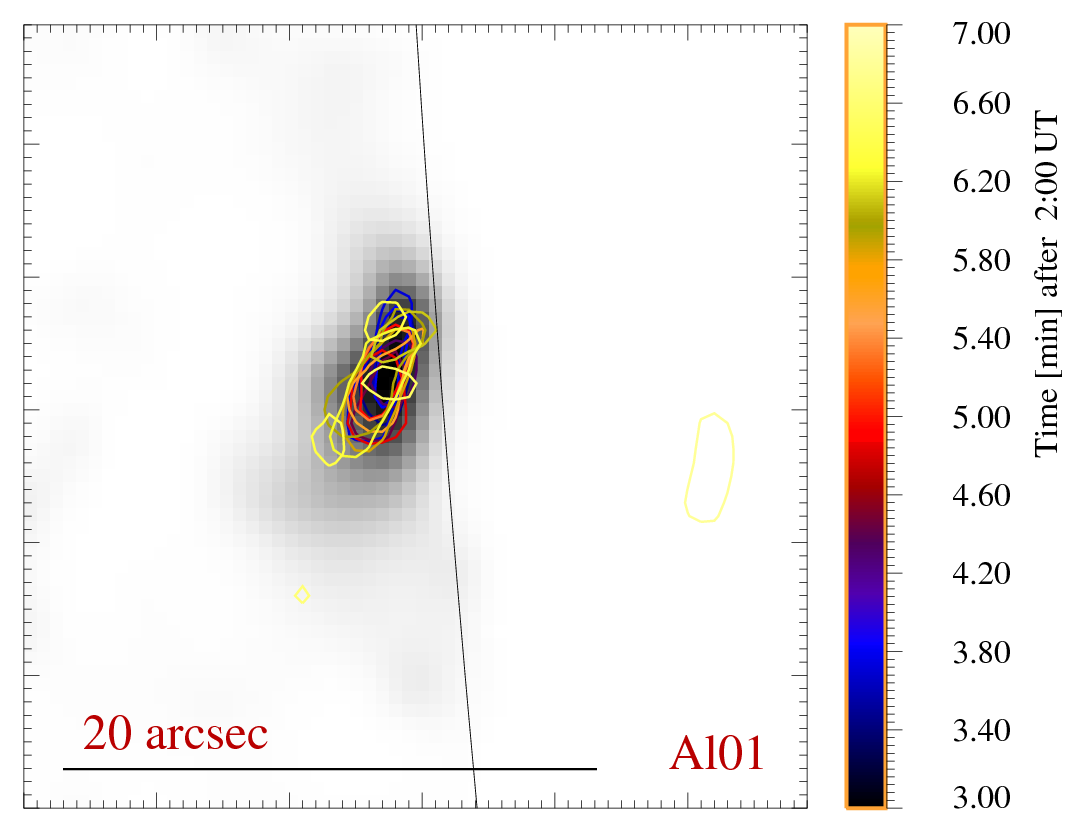
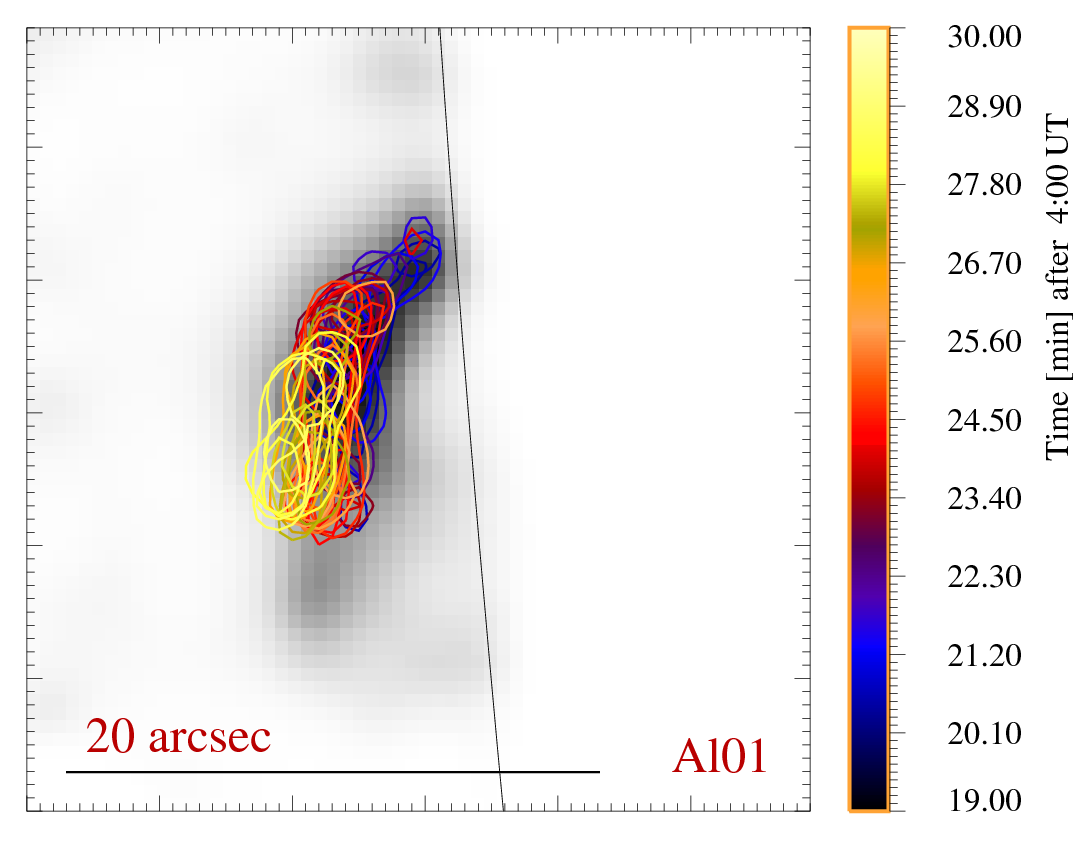
Figure 2: The time sequence of contours plotted at 0.8 of maximum intensity as seen on Al01 SXT images for A flare overlaid atop deconvolved emissivity pattern (gray) of the first unsaturated image in the sequence.
(QSS-dashed) and OFF (dotted) evolutions. The QSS slope represents the situation when N and T are related according to the RTV (Rosner et al., 1978) scaling law: Ttop2 = const Ntop L; OFF slope corresponds to the case when the heating has been abruptly switched-off in the hydrodynamic modeling. It is seen that for B flare (Figure 4) the evolution follows the OFF branch. In case of constant length of the "cooling channel",

the inclination of evolutionary track in DD indicates for slowly/abruptly changing rate of heating - in this case abrupt switch-off. If the flaring plasma geometry vary during the event (loops expanding/compressing), other types of evolutionary behavior are possible, with "non-standard" inclinations. This type of behavior can be seen in Figure 1 for A flare.
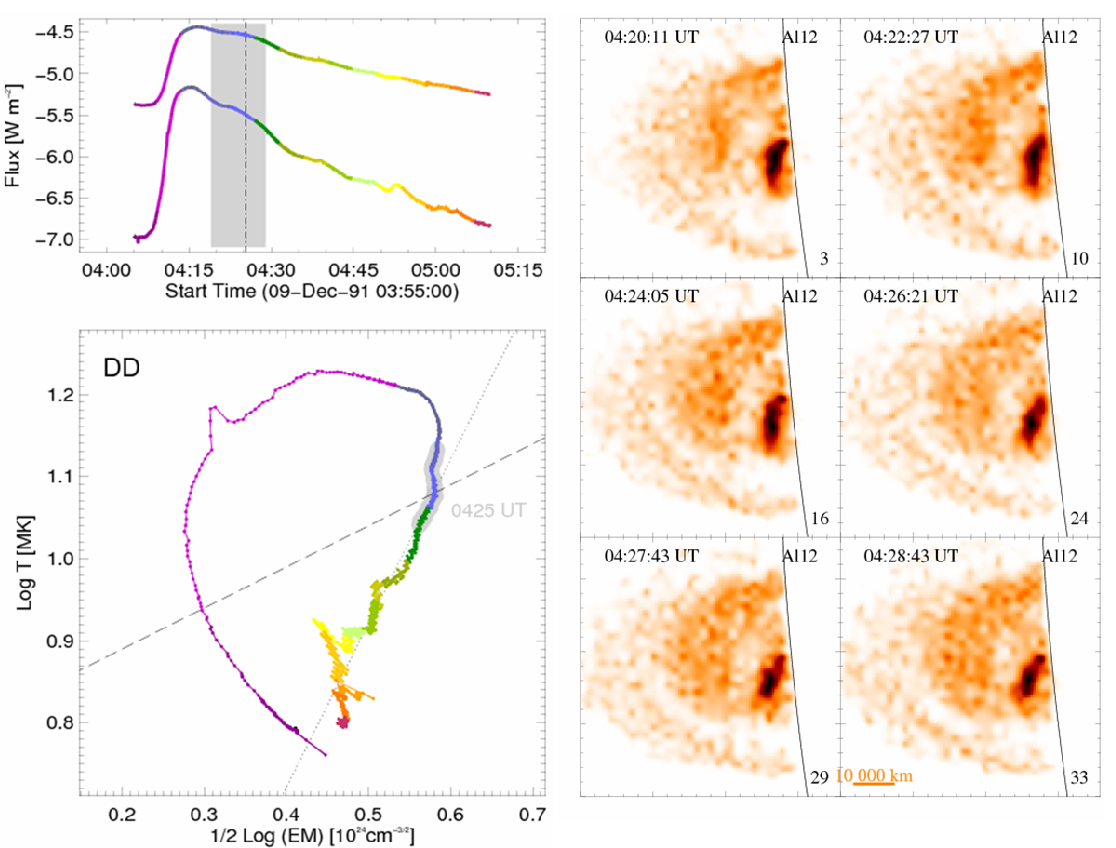
Figure 4: The evolution of flare B in the soft X-ray radiation. Left: The GOES lightcurves with the shaded box indicating time interval of the SXT observations. Below the diagnostic diagram (DD) is presented as constructed based on GOES data. Right: The evolution of flare morphology as seen on the deconvolved SXT Al21 images.
To the right of the DD in Figures 1 and 4, we show for the comparison the variations of actual flare morphology as seen on the deconvolved SXT images. All the images are of the same size (6.5 104 km on a side). Both flares tend to develop similar overall shape, however the details of emission patterns are different. The morphology is dominated by presence of a compact, low lying structure overlaid with much fainter region extending high above the limb. The location and relative brightness of the emission kernels (and their interconnecting patches) change in time during each event, and differ between the events.
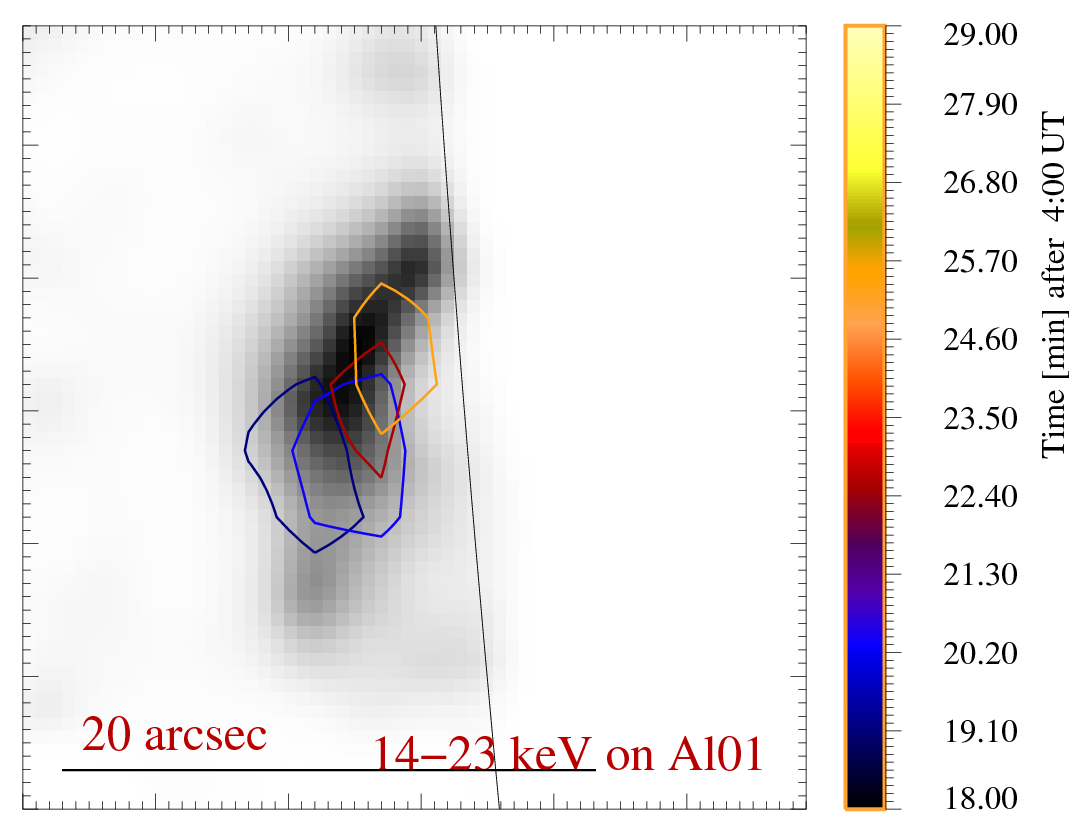
An organized pattern of soft X-ray emissivity development can be tracked in Figures 2 and 5.The contours drawn at the level of 0.8 maximum value of the flux in Al01 SXT images are shown in order to illustrate the relative change of the shape and position of emission. The contours are overlaid atop the emission pattern (in gray) of the first unsaturated (Al01) image within the sequence. In all analysed flares the locations of maximum soft X-ray emission evidently change their position in time. In Figure 3 the results of analysis of BCS data for the A flare are presented for the comparison. At the top panel the time variations of Fe xxv w line flux (stars) are overplot on GOES (red) HXT LO (blue) and BATSE (black). In the middle panel the Doppler velocities are shown as obtained from fitted Gaussian centroid position for S (red), Ca (blue) and Fe (black stars) resonance lines. Negative values mean blueshifts in this respect. In the bottom panel the ion temperatures (obtained as equivalents of the full observed line widths) are shown for S, Ca and Fe resonance lines using consistent colouring. In Figure 6, the contours of maximum hard X-ray emission (LO HXT channel) are drawn atop the soft X-ray emissivity pattern (Al01 SXT image) for B flare. The displacement of maximum hard X-ray emission is directed towards the limb. This is contrary to the "motion" of the soft X-ray emission (see Figure 5). It is also seen in this figure that the soft and hard X-ray emissions are not cospatial. For the five analyzed flares the exact coalignment of hard and soft X-ray sources is not observed. In case of the C flare (Figure 7), the hard X-ray emission encompass the soft X-ray structure forming a helmet. Projection effects are very possible.
But in details, flares are different, as concerns the exact location of the thermal/non-thermal plasma within AR and the time profile of the heating. The GOES observations from which the DD have been constructed indicate for an individual character of heating in each event. There are flares where the abrupt switch-off of the heating following the rise phase is observed (type OFF evolution - for flares B and C) or the "specific" character of evolution with time-evolving effective "cooling length" (for flares A, D and E). A common characteristic of the flares investigated is that the effective heating phase did not lasted long into the decay phase (no evolution along the dashed line has been observed). The "steeper-than-OFF" inclination of the evolutionary branches during the decay are indicative of the shortening of effective "cooling length".
The main emitting region constitutes in each flare a compact structure (kernel) "hanging" low above the limb with extended, much fainter overlying structures composed of the net of individual patches apparently rooted in individual kernels.
For all analyzed flares the brightest, compact region changes its position during the evolution moving mostly outwards. The character of observed transversal motions, where supported with corresponding Doppler shift measurements, indicates for (initially) predominantly horizontal motions of the plasma kernels suggestive of the real motion along the loop arcade channel.
The comparison of deconvolved SXT and MEM reconstructed HXT images indicates that the soft and hard X-ray emissions are not co-spatial in any of the considered events. For flare C, where a distinct compact HXT bright source is not pronounced, the harder X-ray emission outline a faint, extended soft X-ray emission present much higher in the corona (edge of an arcade seen in projection?).
In conclusion: for the analyzed five flares which took place at the limb within the same active region (NOAA 6966), the observed emission patterns show a sort of similarity, however it is hard to claim that the flares analyzed belong to the homologous category.
This contribution has been supported by the Polish Committee of Scientific Research, grant number PBZ KBN 054/P03/2001 and by Polish Ministry of Scientific Research and Information Technology grant No. 1 P03D 017 29.