From many methods available for determination of DEM shape we selected to use the "Withbroe - Sylwester" multiplicative iterative algorithm, in order to interpret of RESIK line and continuum fluxes. The respective emission functions were calculated based on the CHIANTI spectral code. The nineteen independent input fluxes as measured throughout a number of selected flares have been used for DEM determinations. In the present study, we compare and discuss the DEM shapes as obtained for two groups of flares - short and long duration - in order to check for presence of any noticeable differences.
|
| (1) |
where ne is electron density, T - temperature and V is emitting volume.
The knowledge of DEM distribution allows to study in detail physical conditions (eg. mean temperature, total emission measure, total thermal energy content and energetics of flaring plasma).
From many methods allowing to determine DEM (Pottasch, 1964, Batstone et al., 1970, Jordan et al., 1971, Dere et al., 1974, Phillips K.J.H., 1975, Withbroe, 1975, Sylwester et al., 1980, Baker, 1981, Siarkowski, 1983, Fludra et al., 1986, Lemen et al., 1989, Doschek et al., 1990) we have chosen the Withbroe - Sylwester (W-S) multiplicative algorithm (Withbroe, 1975, Sylwester et al., 1980) relying on the maximum likelihood approach. In this paper we present the calculated distributions of DEM for example flares belonging to two classes: short and long duration events (SDE and LDE, respectively). Our aim is to check whether there exist the differences in DEM distributions for this two classes of events.
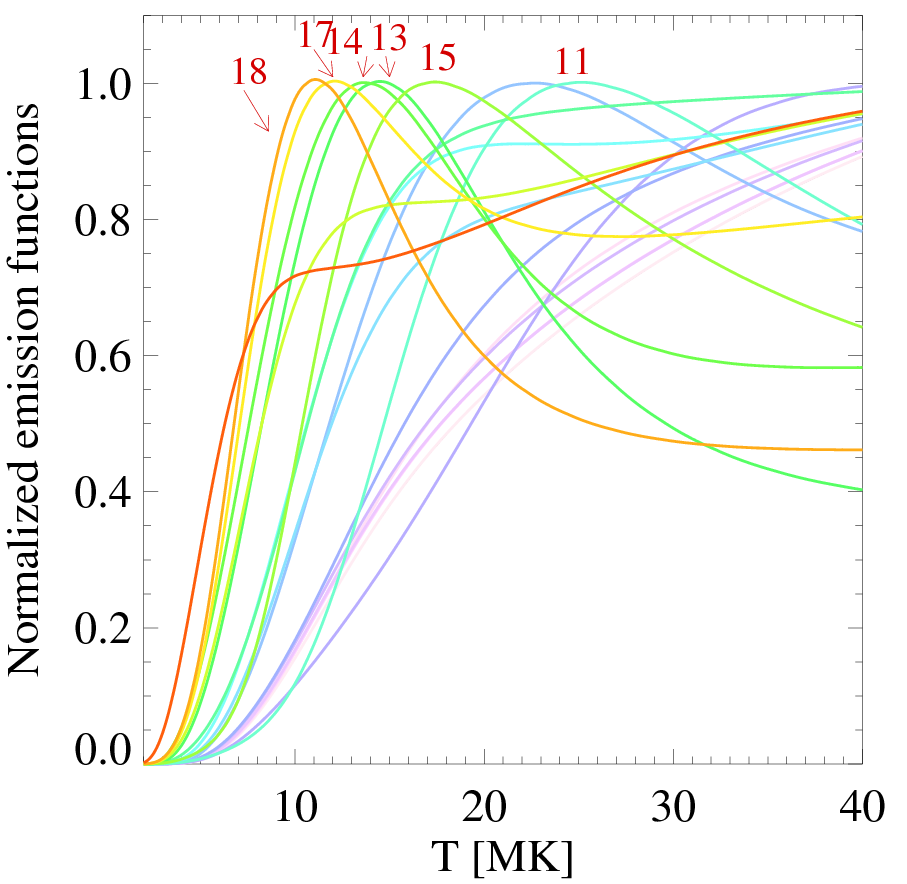
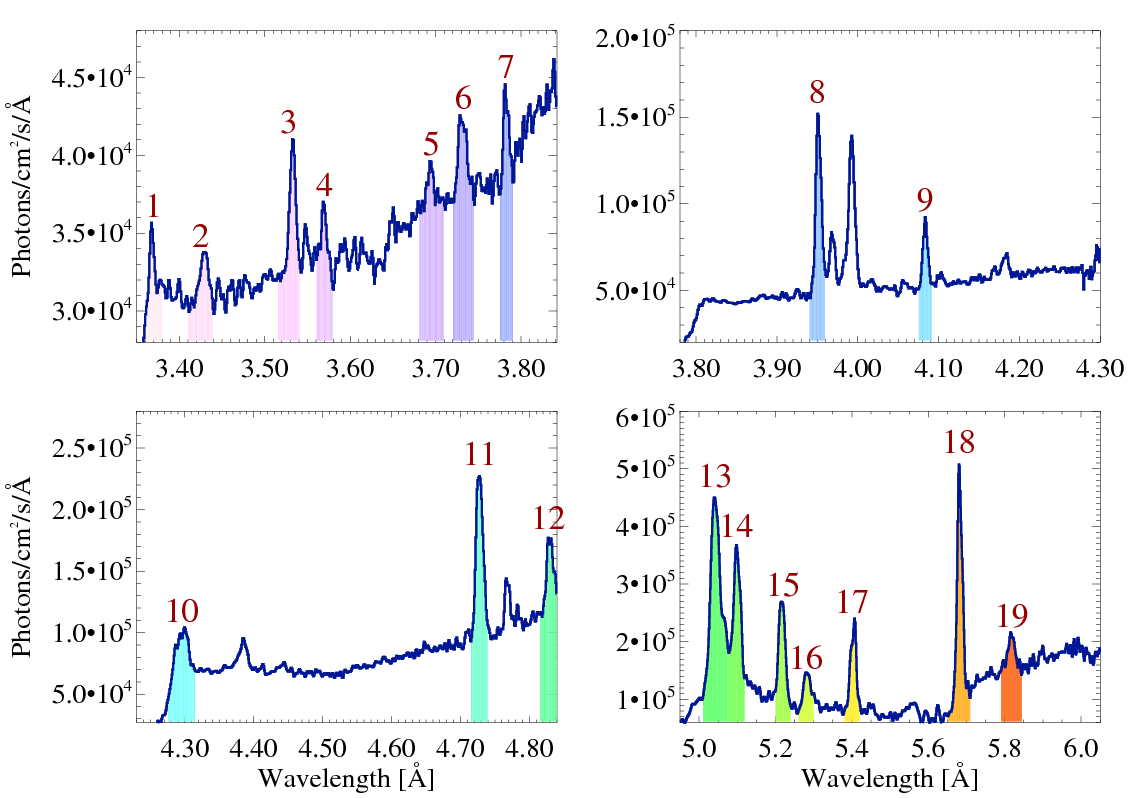
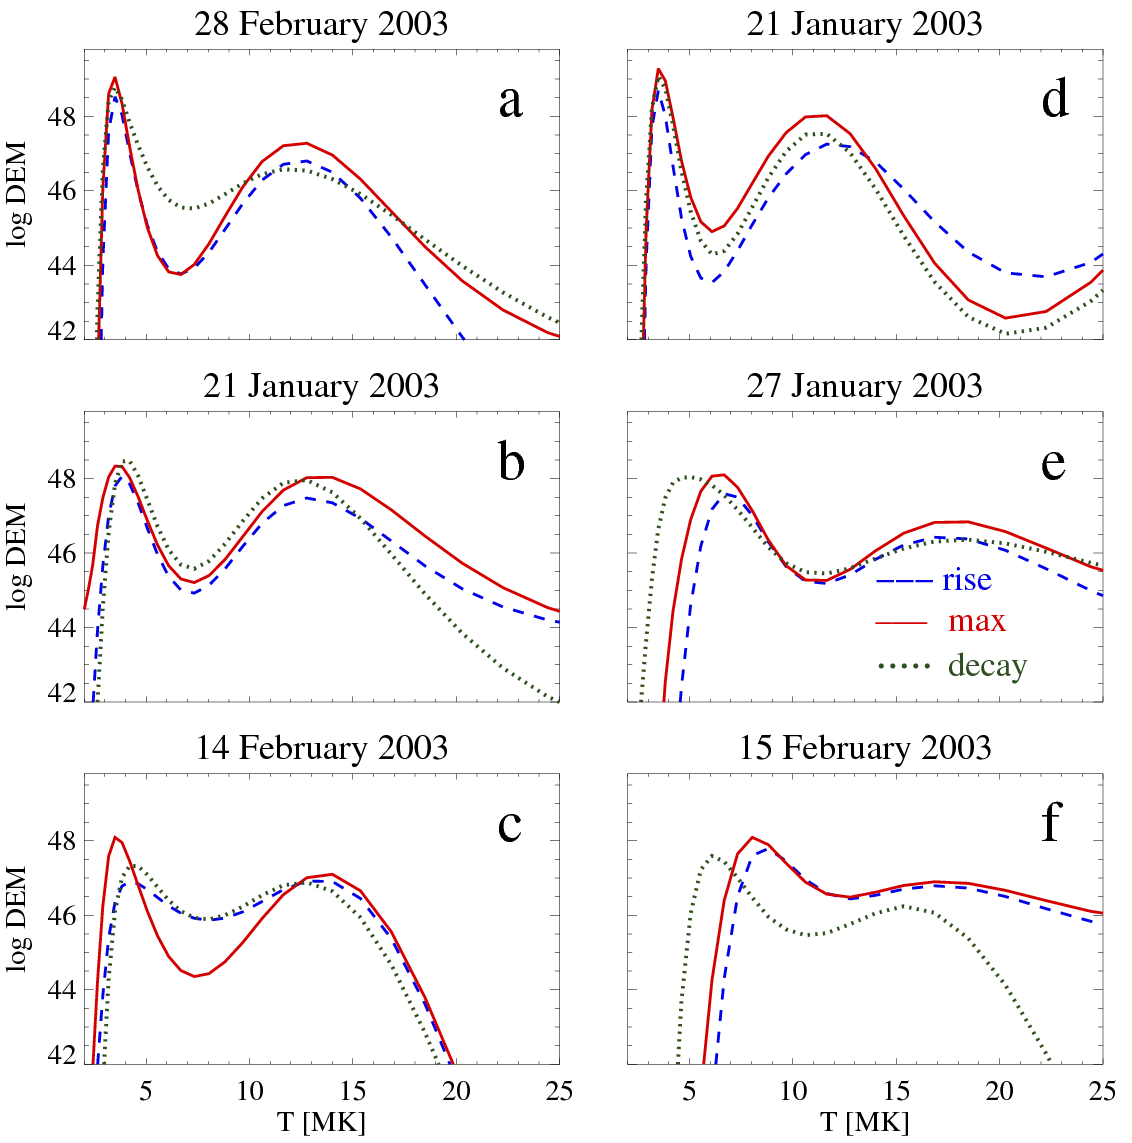
Figure 3: Time evolution of the DEM as calculated for six solar flares (see Table 1). Left panel presents DEM distributions for short duration events, while in right panel DEM shapes for long duration flares are shown for the rise (dashed), maximum (solid line) and decay phases (dotted).
From a large RESIK database, we selected six well observed flares. They occurred in January and February 2003. We have chosen flares which are distinct in their duration. Three of selected flares are characterized as SDE (duration 10 - 20 min) while the other three as LDE (durations 1 - 2 hours). In the Table 1 we presented the following characteristics for individual flares: key, date, start, maximum and end times, the GOES class, location on the solar disc and class according to flare duration.
 |
The W-S algorithm (Withbroe, 1975, Sylwester et al., 1980) represents an
iterative maximum likelihood procedure in which the next approximation of the
DEM distribution,
![]() , is calculated from preceding one
, is calculated from preceding one
![]() using the following formula:
using the following formula:
|
|
(2) |
where: wi(T) is the weight function, ci is the correction factor taken as ci = Foi/Fci and Foi is the flux observed in line/band i (i = 0, 1, 2 ... k). Predicted flux Fci is calculated (in jth iteration) by the formula:
|
|
(3) |
In the calculations we have used
![]() =const as zero approximation.
=const as zero approximation.
The emission functions used in present study have been calculate d using CHIANTI packages (Dere et al., 1997, Landi et al., 2005) and are illustrated in Figure 1. (These emission functions correspond to selected spectral bands shown in Figure 2 and contain both line and continuum contribution.)
In Figure 2 we present the average spectra in the four RESIK channels with lines for determination of DEM indicated. In the set of selected bands used for the DEM analysis the fluxes consist of line and continuum emissions. We have chosen 19 bands (wavelength regions) for the DEM calculations, which characteristics (wavelength ranges and description of main line) are presented in Table 2.
 |
Not always all 19 bands have been used for DEM determinations. Those lines which have not been observed or have been poorly noticeable have not been used for calculations. The number of lines used for analysis varies from flare to flare between 14 and 19.
From the analysis of differential emission measure distributions calculated based on RESIK data for SDE and LDE the following conclusions have been made:
1. For both groups of flares the shapes of DEM represent two component distributions. One component contains the relatively cold plasma with temperatures between 5 MK and 10 MK and the other component contains the hotter plasma with T between 15 MK and 25 MK.
2. The average temperature of the cold component is rather stable during the flare evolution while characteristics of the hotter plasma depend on the flare phase. During the flare decay the hot component cools down and is bulk shifted towards the lower temperature range.
3. The relative amount of hot and cooler plasma is different for various flares; for strong flares the amount of hot plasma is comparable with the amount in the cooler one.
4. There is no apparent difference in the shapes of DEM for SDE and LDE. The only remarkable difference is that for SDE the temeperatures of both components are usually slightly lower in comparison with LDE.
This contribution was supported by Polish Ministry of Scientific Research and Information Technology grant No. 1 P03D 017 29 entitled: 'Investigations of physical conditions and composition of coronal plasma from X-ray spectra obtained by RESIK, Diogeness and the other instruments'.