European Solar Physics Meeting
The Dynamic Sun: Challenges for Theory and Observations,
11-16 September 2005 (ESA SP-596, December 2005)
1Astronomical Institute of Wrocław University, Kopernika 11, 51-622 Wrocław, Poland
2Space Research Center, Polish Academy of Sciences, Kopernika 11, 51-622 Wrocław, Poland
A simple interpretation of this phenomenon assumes that a slower convergence of magnetic field lines in a loop's leg with a weaker magnetic field allows more electrons to reach the chromosphere. In this paper we study in detail effects of the asymmetry of the localization of the primary energy source. In such a case the footpoint located closer to the energy source can be brighter in hard X-ray independently on the strength of the underlying magnetic field. We present hear also an example of a flare in which electron acceleration site is clearly located asymmetrically, near one of the footpoints, at the place where two magnetic loops interact.
Hard X-ray emission of the solar flares come usually from two or more compact sources, interpreted as regions of precipitation of non-thermal electrons propagating along the legs of the flaring magnetic loops (Sakao 1994, Kundu et al. 1995, Li et al. 1997, Aschwanden et al. 1999). These sources often show asymmetry of the emitted hard X-ray fluxes and the brighter source is usually located in a region of the weaker photospheric magnetic field.
A simple interpretation of this phenomenon assumes that a slower convergence of
magnetic field lines in a loop's leg with a weaker magnetic field allows more
electrons to reach the chromosphere. Unfortunately, numerous flares do not fit
the above scenario. One of five flares analyzed by Sakao (1994) has a brighter
footpoint located in the region of the stronger photospheric magnetic field.
Asai et al. (2002) also reported an example of a flare for which the brighter
footpoint was found in a stronger magnetic field. Goff et al. (2004) studied the
magnetic field strengths and hard X-ray brightness of 32 flares. They found that
the brighter HXR footpoints coincide with the regions of stronger magnetic
fields in 11 events. Authors named these flares as N-type (for non-Sakao type),
in contrary to S-type phenomena (for Sakao type, where a brighter footpoint is
located in the region of the weaker photospheric magnetic field). According to
them the most likely explanation of N-type events may be an asymmetry in the
location of the acceleration site. If the acceleration site is located closer to
the brighter footpoint it may reduce the effects of convergence over the shorter
distance, allowing more precipitation in this region than if the acceleration
site was located at the loop apex. The non-thermal electrons also cause
![]() radiation because of rapid deposition of their energy in the dense chromospheric
plasma. Therefore, Ha kernels and HXR sources show a high correlation in their location and light
curves (Asai et al. 2002)
radiation because of rapid deposition of their energy in the dense chromospheric
plasma. Therefore, Ha kernels and HXR sources show a high correlation in their location and light
curves (Asai et al. 2002)
In this paper we analyse in detail a N-type flare studied already by Goff et al. (2004). We show that the electron acceleration site was located asymmetrically near one of the footpoints at the place of an interaction of two magnetic loops.
On 31 August 2001 at N15E37 occurred a M1.6 GOES class solar flare (see Figure 1). It started at 10:35 UT, reached the maximum at 10:42 UT and ended at 11:10 UT. In this work we used data taken with SXT grazing-incidence imaging telescope (Tsuneta et al., 1991), HXT Fourier synthesis telescope (Kosugi et al., 1991) in four energy ranges L (14-23 keV), M1 (23-33 keV), M2 (33-53 keV) and H (53-93 keV), GOES broadband X-ray fluxes measured in 1-8 Å and 0.5-4 Å wavelength bands as well as Ha data taken with Large Coronagraph (LC) equipped with Multi-Channel Subtractive Double Pass (MSDP) spectrograph of the Biaków Observatory.
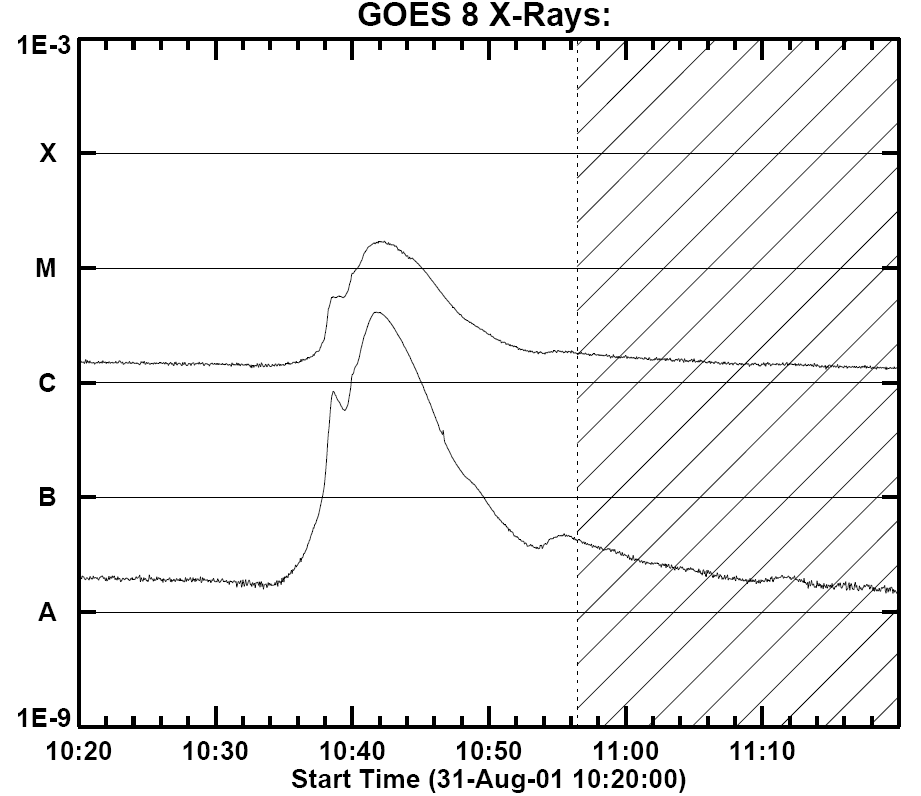
Figure 1: X-ray flux curves recorded by the GOES satellite between 10:20 UT and 11:20 UT on 31 August 2001. The upper and lower lines indicate the full disk soft X-ray flux through 1–-8 Å and 0.5–-4 Å respectively. The striped regions show the Yohkoh satellite nights.
The LC has a 53 cm diameter main objective, its effective focal length is
1450 cm, and its spatial resolution, normally limited by seeing conditions, is
about 1 arcsec or better. The MSDP spectrograph has a rectangular entrance
window, which covers an equivalent area of 325 ×41 arcsec2 on the Sun
(Mein et al., 1991; Rompolt et al., 1994). The spectrograph has a nine-channel
"prism-box", enabling restoration of the
![]() line profiles in the range ±1.2 Å from the line centre with a spectral resolution of 0.4 Å. As a result of
the numerical reduction of the collected spectra-images, for each flare we
obtained a series of "compound" images. Each compound image consists of thirteen
two-dimensional, quasi-monochromatic images at thirteen wavelengths in the range
±1.2 Å from the Ha line centre. One can also use the compound images for crude restoration of the
line profiles in the range ±1.2 Å from the line centre with a spectral resolution of 0.4 Å. As a result of
the numerical reduction of the collected spectra-images, for each flare we
obtained a series of "compound" images. Each compound image consists of thirteen
two-dimensional, quasi-monochromatic images at thirteen wavelengths in the range
±1.2 Å from the Ha line centre. One can also use the compound images for crude restoration of the
![]() line profile for each pixel in the field of view.
line profile for each pixel in the field of view.
In Figure 2 we present two HXT images of the investigated flare obtained in M1 channel in two different moments: just after the start of the flare (left panel) and during the late phase of the event (right panel). The images are overlaid on SXT/Be119 data, respectively. At the images taken between 10:37:57 UT and 10:38:07 UT there were resolved three separate hard X-ray sources (marked F1, F2a and F2b in Figure 2, left panel). After 10:38:07 UT two sources were seen only (marked F1 and F2 in Figure 2, right panel). For the same event Goff and co-workers identified two hard X-ray sources only and classified this flare as a non-Sakao event. Goff used one image of the flare only, taken during the maximum of the event. In our work we used numerous images which allows us to follow temporal evolution of the event. This is the reason of the difference of the obtained results.
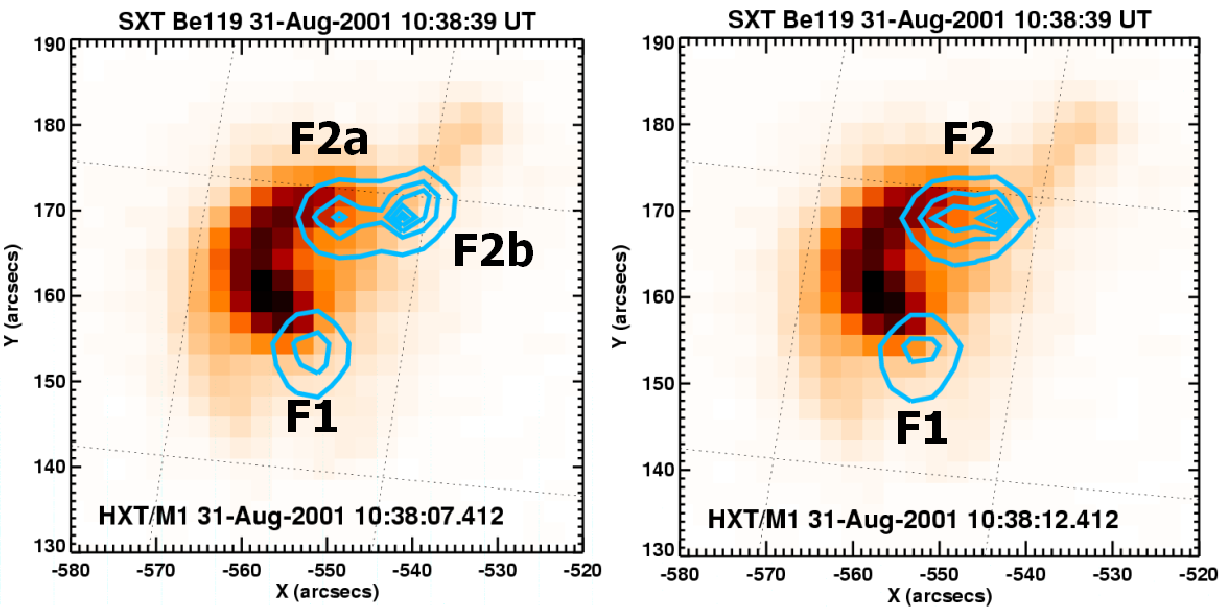
Figure 2: Left panel: Soft X-ray SXT/Be119 image of the active region NOAA 9601 taken on 31 August 2001 at 10:38:39 UT over-plotted with iso-contours of the hard X-ray emission observed at 10:38:07 UT. The bright flaring loop and three footpoints F1, F2a and F2b are clearly visible and resolved. Right panel: the same soft X-ray image over-plotted with iso-contours of the hard X-ray emission observed at 10:38:12 UT. The hard X-ray sources F1 and F2 are seen only.
The visible sources of the hard X-ray emission can be recognized as footpoints of the magnetic loops. Thus the three observed hard X-ray sources indicates a presence of at least two magnetic loops. The footpoints F1 and F2a were connected by a loop visible in SXR (see Figure 2 - left panel), while the source marked F2b was probably a footpoint of the another, not visible loop. The existence of the second loop was confirmed by the appearance of an emission extended along the loop, which was best visible in SXT/AlMg images taken between 10:38:19 UT and 10:39:09 UT (see Figure 4 - left panel). The expanding emission started exactly from the source F2b (see Figure 2 - left panel).
The hard X-ray footpoints F2a and F2b were located over the elongated Ha brightening, while the source F1 was seen close to the bright Ha kernel (see Figure 3). The shifts between HXR footpoints and relevant
![]() sources could be caused by projection effect. The estimated error of
co-alignment of the both images was of the order of one HXT pixel (5 seconds of
arc).
sources could be caused by projection effect. The estimated error of
co-alignment of the both images was of the order of one HXT pixel (5 seconds of
arc).
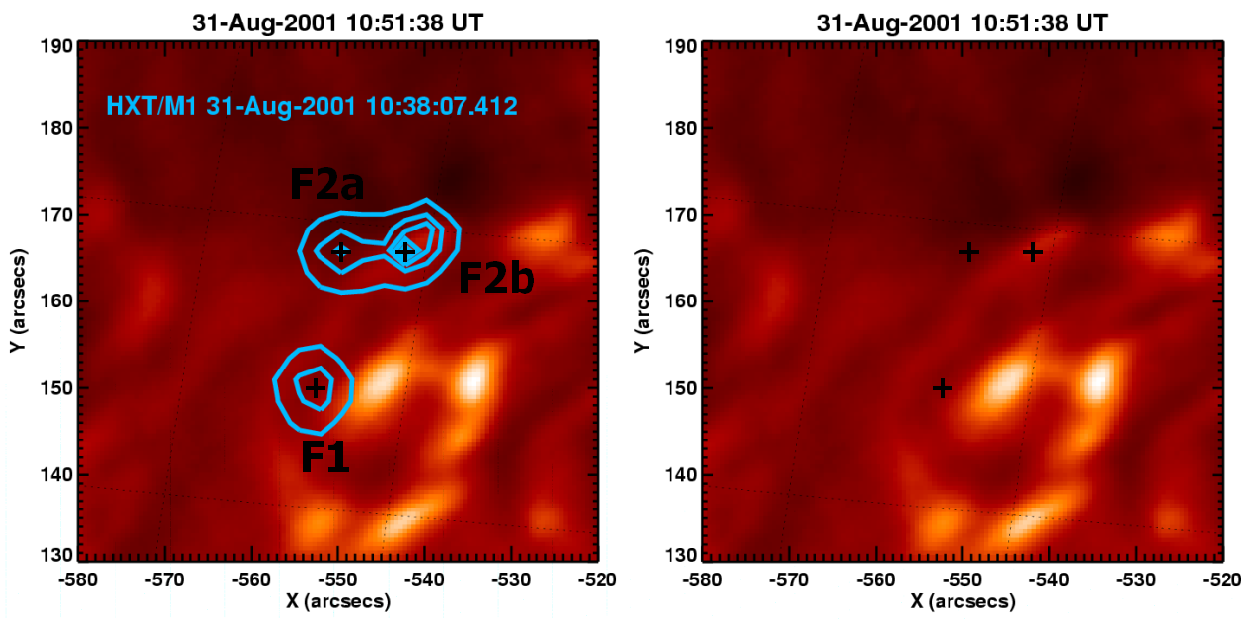
Figure 3: Ha line centre image of the solar disk flare on 2001 August 31 taken at
10:51:38 UT, observed with the LC/MSDP system at the Bia ków Observatory. The Ha elongated brightening is located just below the F2a/F2b hard X-ray footpoints
of the flaring loops while the
![]() bright flare kernel is seen close to the hard X-ray F1 footpoint of the same
magnetic loop. The footpoints of the hard X-ray loops are marked with
iso-contours and black crosses.
bright flare kernel is seen close to the hard X-ray F1 footpoint of the same
magnetic loop. The footpoints of the hard X-ray loops are marked with
iso-contours and black crosses.
At lower energies (channel L) emission comes from the whole loop. Going to the higher energies (M1 and M2), the emission of the footpoints dominates; moreover footpoint F2 is brighter than footpoint F1 even though it is located over region of stronger magnetic field (Goff et al., 2004).
The observed structure of the HXR footpoints as well as loops seen in SXR can be explained easily with a simple model of two interacting magnetic lops. The possible spatial configuration of the loops is presented in Figure 4 (right panel). The region of interaction of the loops was located perhaps just above the chromosphere, in the closest vicinity of the F2a and F2b footpoints (the configuration of the interacting loops was of the type of "Y", according to de Jager and Sakai (1992)). In such a model footpoint F2a can be brighter in hard X-ray than footpoint F1 independently on the strength of the underlying magnetic field due to the strong asymmetry of the location of the main energy source.
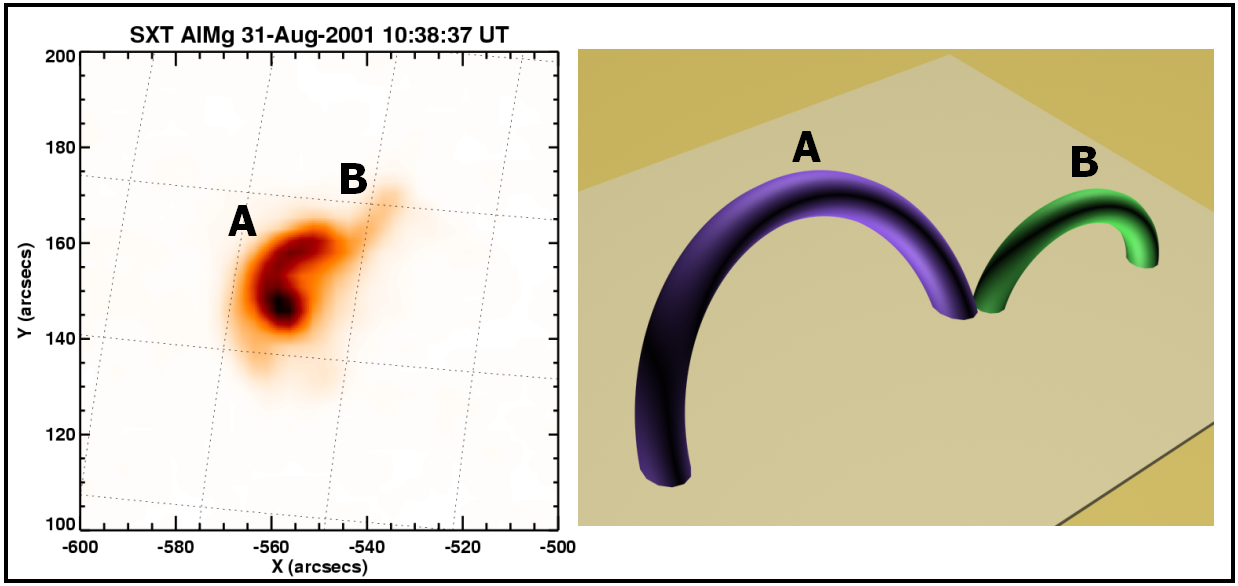
Figure 4: Left panel: Soft X-ray SXT/AlMg image of the active region NOAA 9601 taken on 31 August 2001 at 10:38:37 UT. The main flaring loop, marked A, is accompanied with an extended emission, which gradually filled the shorter loop marked B. Right panel: The simple model of the interacting magnetic loops. The interaction of the loops occurred in "Y" configuration of the magnetic fields, low above to chromosphere.
To estimate the ratio of emission at the footpoints F1 and F2a we use formulae
for intermediate thin-thick emission as given by Wheatland and Melrose (1995).
To do this we calculated density and temperature of this loop from SXT/Be119 and
SXT/AlMg images. We obtained ne = 2.5×1010 cm-3 with Te = 10.7 MK. From the SXT images we estimated the loop
length and corresponding column density Nl » ne ×L » 5.1×1019 cm-2. Assuming power law for photon and electron distribution and
calculating mean photon index gamma from ratio M2/M1 (![]() = 2.55), we obtained the ratio of the fluxes emitted by the footpoints F2a and
F1 as equal to IF2a/IF1 » 1.22 in M1 channel and IF2a/IF1 » 1.13 in M2 channel. This values correspond very well to the observed values
1.22 and 1.19 for the same channels.
= 2.55), we obtained the ratio of the fluxes emitted by the footpoints F2a and
F1 as equal to IF2a/IF1 » 1.22 in M1 channel and IF2a/IF1 » 1.13 in M2 channel. This values correspond very well to the observed values
1.22 and 1.19 for the same channels.
The hard X-ray sources show usually asymmetry of the emitted fluxes and the brighter source is often located in a region of the weaker photospheric magnetic field. A simple interpretation of this phenomenon assume that a slower convergence of magnetic field lines in a loop's leg with a weaker magnetic field allows more electrons to reach the chromosphere. In our case energy release source lies probably near one of the footpoints as an effect of two loops interaction and this footpoint is brighter independently on the strength of the underlying magnetic field. The simple numerical calculations of the emission in our model gives results very similar to the observed ones.
RF has been supported by grant No. 2P03 001 23 from the Polish Committee for Scientific Research (KBN). MS has been was supported by Polish Ministry of Scientific Research and Information Technology grant No. 1 P03D 017 29.