1 Toruń Centre for Astronomy, Nicolaus
Copernicus University, 87-100 Toruń, ul. Gagarina 11, Poland 2 Astronomical Institute of Wrocław
University, 51-622 Wrocław, ul. Kopernika 11, Poland 3 Space Research Centre, Polish Academy
of Sciences, 51-622 Wrocław, ul. Kopernika 11, Poland Abstract. We present here a brief description of thirteen events of
the narrowband solar millisecond radio spike emissions observed between February
2000 and December 2001. The total observing time was 1990.4 hours, collected
during the 357 observing days. The data were collected with the 15-m radio
telescope and fast radiospectrograph of Toruń Observatory, Poland. The dynamic
spectra of the spikes were recorded in the 1352-1490 MHz frequency band split
into 46 frequency channels with temporal resolution equals to 12500 measurements
per second per channel. The presented observations have probably the highest
time resolution ever published. Using X-ray, UV and ground based observations we
have analysed the main properties of the active phenomena correlated in time
with the observed spikes. We found that probably all spikes are emitted as a
result of some processes related to the solar flares. The spikes observed during
the solar flares were emitted from events of various morphologies, various
scenarios of evolution and various configurations of the interacting magnetic
fields. All other emissions of the spikes, not correlated in time with solar
flares, were observed during the slow increases of the X-ray flux leading to the
flares. On the basis of the GOES database we have estimated that merely
2% of the solar flares are associated with the radio spikes. Key words. Sun: corona – Sun: radio Sun: flares – Sun:
magnetic fields – Sun: hard X-rays
Solar radio events with individual emissions shorter than 100 ms were reported for the first time by Dröge and Riemann (1961), Elgarøy (1961) and de Groot (1962), who also introduced their common name, solar radio spikes. Despite more than forty years of investigation, millisecond radio spikes observed in the decimetre wavelength band (dm radio spikes in this paper), often emitted during the impulsive phase solar flares (Bastian et al., 1998), are one of the less understood solar phenomena (Dröge, 1967; Dröge, 1977; Bastian et al., 1998).
The emission process of the radio spikes and localization of their sources are still unclear. The emission of the spikes can be related to fine scale elementary processes of the magnetic field annihilation in the energy release region of the solar flares, occurring on very short time scales and on very small spatial scales (Benz, 1985; Messmer and Benz, 2000) or/and to the "secondary" fragmentation of the magnetic fields directly in the radio source (Aschwanden and G¨udel, 1992; Fleishman and Melnikov, 1999).
The spatial structure and temporal changes of the sources of the radio spikes are unattainable by contemporary instruments working in visual, UV and X-ray domains. Fortunately, numerous radio instruments now have much higher temporal resolution. For this reason a complex interrelated analysis of the radio observations of the solar spikes could provide much valuable information concerning small- and short-scale physical processes as well as the main properties of the regions involved (Aschwanden and Benz, 1997; Robinson, 1991; Benz et al., 2001).
In this paper we present a review of the thirteen events of the emission of numerous dm solar radio spikes, recorded by one of us (BPD) with the 15-m radio telescope and fast radiospectrograph of Toruń Observatory, Poland between March 15, 2000 and October 30, 2001 (Dąbrowski et al., 2002; Dąbrowski et al., 2003). The total observing time was 1990.4 hours, collected during the 357 observing days between February 2000 and December 2001. The observations were made in the 1352-1490 MHz frequency band split into 46 channels, with high time resolution (12 500 measurements per second and per channel) and moderate frequency resolution (3 MHz per channel). Using X-ray data collected by the Yohkoh Soft X-ray Telescope (SXT) (Tsuneta et al., 1991) and Hard X-ray Telescope (HXT) (Kosugi et al., 1991), GOES flux monitor and Interball/RF-15I photometer (Sylwester at al., 2000), UV images taken with the Transition Region and Coronal Explorer (TRACE) (Wolfson et al., 1997) as well as EIT telescope on board the SOHO satellite (Delaboudiniöre et al., 1995) and ground based observations made in Ha hydrogen line in Wrocaw Observatory, Poland, we have identified the most likely active solar phenomena related to some spikes and we have investigated the main morphological properties and evolution of these active phenomena.
The dm radio spikes are short living individual emissions of electromagnetic waves (usually of duration not longer than 100 ms), recorded in very narrow frequency bands above an arbitrary chosen limit of the order of 1 GHz (Dröge, 1977). They occur often during the DCIM (decimetre, complex, highly structured radio emission) events. As a rule they appear in multi-element groups, typically up to many thousands of individual events each (Benz, 1985; Bastian et al., 1998). Sometimes can one divide the groups of events into subgroups or "chains" of spikes (Güdel and Benz, 1988). The dm radio spikes can be observed with high time resolution due to their very high flux densities (of the order of 100 solar flux units, 1 sfu=10-19 erg s-1 cm-2 Hz-1) and very high brightness temperature, greater than 1013-1015 K (Bárta and Karlický, 2001; Benz, 2002a; Kuznetsov and Vlasov, 2003). This high brightness temperature indicates coherent mechanism of emission (Bastian et al., 1998).
The relative bandwidths of the radio spikes are of the order of a few percent and can vary significantly both from one event to another and within the same event (Fleishman and Melnikov, 1999; Benz, 1986). Also Csillaghy and Benz (1993) analysed two emissions of the spikes recorded in 1.08-1.6 GHz and 1.0-1.35 GHz bands and they found the average relative bandwidths of the spikes of 1.3% and 4.1%, respectively. Messmer and Benz (2000) found for radio spikes observed in the 0.87-1 GHz band a mean relative bandwidth equal to around 0.8% and the smallest relative bandwidth of the individual spike equal to 0.17% only.
The time profiles of the spike emission was studied first by Güdel and Benz (1990). In particular they found the Gaussian shape of the rise phase and the exponential decay phase, which was later interpreted as evidence of quasi-linear relaxation (Fleishman and Arzner, 2000). The mean characteristic times of the ascending and of the decaying parts of their profiles are comparable, even if the dispersion of the values is very broad (Mészárosová et al., 2003).
The dynamical radio-spectra of the spikes show their very fast drifts in frequency, with a wide scatter of the drift rates over positive and negative values (the negative drift is defined as a change of the observed frequency from higher to lower) but usually the negative drifts dominate. The drifts rates of the dm radio spikes lie between -1 and -4 GHz per second at 770 MHz (Güdel and Benz, 1990), while their absolute drift rates lie between 2.2 to 4.3 GHz per second in 2.7-3.8 GHz band (Wang et al., 2002). However, observed drifts of the emission frequency of the individual spikes or groups of spikes can be construed not only as a result of the motion of the exciting factor through the plasma but also as a local change of the physical parameters of the emitting plasma. Millisecond radio spikes can have an arbitrary polarisation degree, ranging from 0% to 100%. Usually the spikes originating near the solar limb are weakly polarized, those from the disk centre are highly polarized (Güdel and Zlobec, 1991).
The emission of radio spikes is often correlated in time with the hard X-ray (HXR) emission during the impulsive phase of the solar flares (Benz and Kane, 1986;Benz et al., 2001), however observed time delays of spike groups after the HXR peaks are of the order of a few seconds (Aschwanden and Güdel, 1992). The decimetre radio spikes have the highest association rate with flares (95%) of all coherent radio emissions. On the contrary, only 2% of all hard X-ray events are associated with dm radio spikes (Aschwanden and Güdel, 1992). Unfortunately, due to an insufficient temporal resolution of the presently available X-ray observations, it is not possible to check the temporal correlation of the individual radio spikes with short-term changes of the HXR flux.
The current data about the radio spikes are in favor of the idea of (at least) two different kinds of spike event: one class is composed of spike clusters originating in a post-flare phase and located far away from the main flare location (Benz et al., 2002b) and the other is composed of the clusters appeared in the main flare phase and well correlated with other nonthermal flare emission: HXR (Aschwanden and Güdel, 1992) and microwave gyrosynchrotron emission (Fleishman et al., 2003). The sources of the first class of events, studied by Benz et al., 2002b, are located far from strong magnetic field sites, while those from the second class (Fleishman et al., 2003) are related to the flares with the relatively strongest magnetic field.
Theoretical models of radio spike emission are based mainly on plasma emission and acceleration processes (Kuijpers et al., 1981; Tajima et al., 1990; Wentzel, 1991; Bárta and Karlický, 2001) or on electron-cyclotron maser emission (Holman et al., 1980; Melrose and Dulk, 1982; Sharma and Vlahos, 1984; Winglee et al., 1988; Aschwanden, 1990; Fleishman and Yastrebov, 1994; Fleishman and Melnikov, 1999). Spikes were interpreted also as radio emission of electrons accelerated in MHD cascading waves generated in plasma outflows from the magnetic reconnection region (Karlick´y et al., 1996). According to the most reliable estimations, the size of the sources of the individual radio spikes should be smaller than 200 km, taking into account a coherent mechanism of emission (Bastian et al., 1998).
The observations of the radio spikes used herein have been collected with the 15 m radio telescope of Toruń Centre for Astronomy, Nicolaus Copernicus University in Toruń, Poland. The telescope has a solid parabolic dish supported on an equatorial mount and is used with the prime focus optics. The half width of the beam at 1420 MHz is equal to 50 minutes of an arc. The receiver is uncooled; the flux density equivalent system temperature was around 2850 Jy.
During the observations of the dm spikes the 15 m telescope was connected to the fast radiospectrograph Pulsar Machine II (PSPM II) (Cadwell, 1997). PSPM II is routinely used for pulsar observations with the 32-meter radiotelescope of the Toruń Observatory. PSPM II has a 2 x 64 x 3 MHz (polarization × channels × filter width) filter-bank built for observations of the pulsars at frequencies above 1 GHz with very high temporal resolution and precise timing. For technical reasons the polarization of the emission of the dm spikes was not measured.
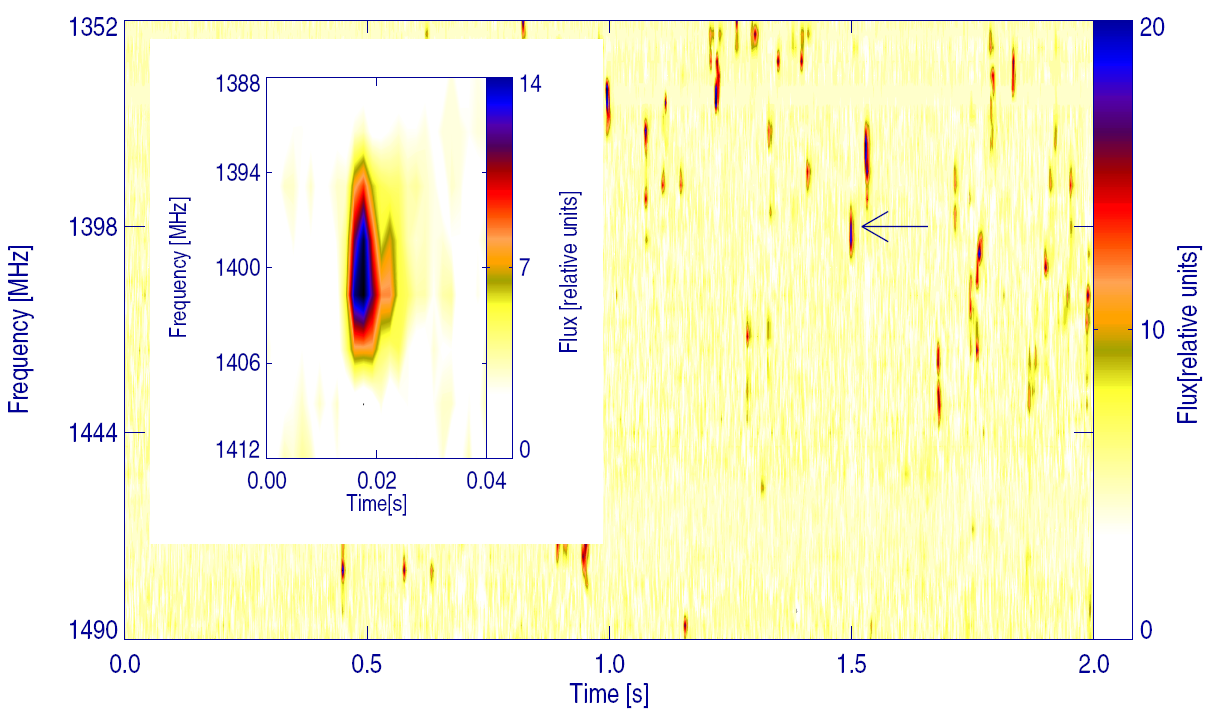
Dynamical radiospectrograms of the spikes were recorded in the 1352-1490 MHz frequency band split into 46 channels each 3 MHz wide. The time resolution of the collected data is equal to 80 microseconds, and all channels were scanned 12 500 times per second. The presented observations of the radio spikes in the dm band probably have the highest time resolution ever obtained (Jin et al., 1986; Stähli and Magun, 1986; Allaart et al., 1990; Gary et al., 1991). Up to June 2000 we have observed the Sun simultaneously in the 1352-1490 MHz band and at 327 MHz with the 10 MHz bandwidth in total power mode. We call this the 327 MHz band. After June 2000 we made observations in the 1352-1490 MHz band only.
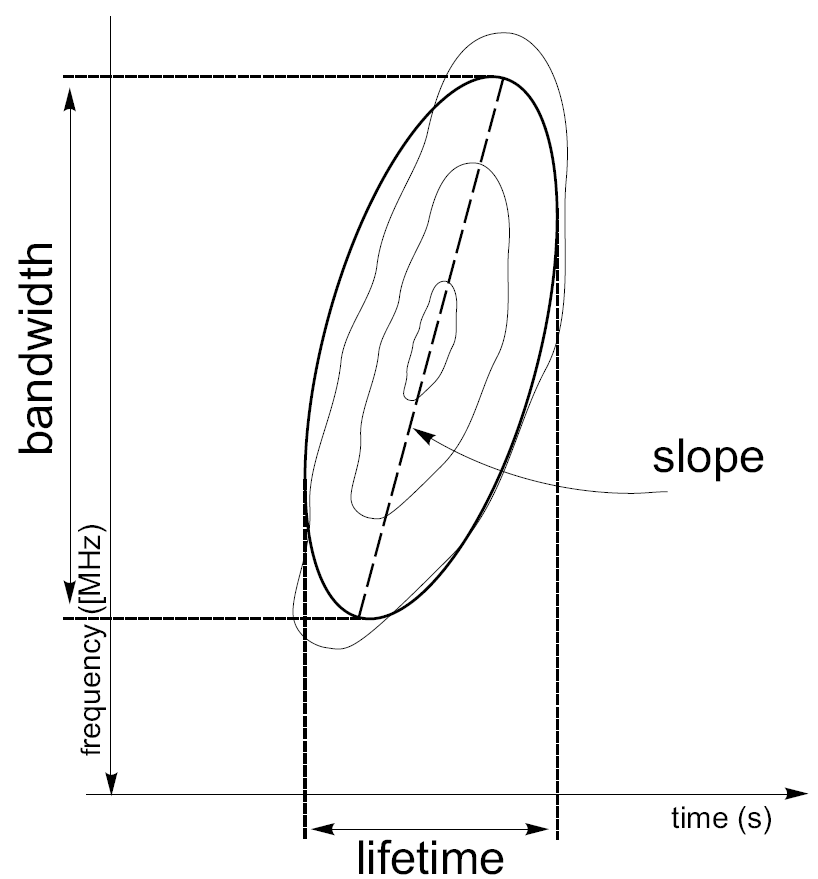
The radio data were processed in order to make the sensitivities of the individual channels homogeneous but were not calibrated in absolute flux units. For subsequent automatic numerical evaluation of the main properties of the individual spikes we have freely adopted a working definition of the spike as a short-lasting increase of the flux with the peak more than 3 times above the level of the local background. Each individual radio spike was fitted with a two-dimensional elliptical Gaussian (using a non-linear least square method) and the main descriptive parameters were measured at the intensity level equal to half of the maximum: duration, bandwidth and slope (i.e. a rate of the drift in frequencies) (see Fig.1). For reliable comparison of the radio data with other observations as well as for precise determination of the beginning, maximum and end of the radio event, we used the mean flux averaged over all channels. Evaluation of the main properties of the individual spikes was made using the data with intentionally limited temporal resolution (using an averaging filter of an arbitrarily chosen width from 0.8 up to 4 ms, depending on the overall properties of the evaluated event).
Thirteen events of narrowband solar millisecond radio spikes were observed between March 15, 2000 and October 30, 2001. Using X-ray data collected with instruments installed on board the Yohkoh, GOES and Interball satellites, UV images taken with the TRACE and SOHO/EIT telescopes and ground based observations made in the Ha hydrogen line we identified the most likely active solar phenomena related to observed spikes. Unfortunately, the GOES, Interball and radio data used by us do not have spatial resolution. Yohkoh, TRACE and SOHO data have quiet good space resolution but relatively low time resolution. For this reason the only usable criterion of the identification of the spikes' source was temporal correlation of some solar active phenomenon and the recording of the radio spikes. We are not able to prove undoubtedly the correctness of such a selection made in any particular case, while some co-temporal, but rather faint and undetected active processes on the Sun could also emit spikes.
We have paid special attention to precluding any artificial radio signals of a terrestrial origin. In 2000 the observations were carried out also at 327 MHz. All radio events observed in 2000 up to June 21st and presented in this paper were observed simultaneously in both, very different, bands. The majority of the events were observed at other radio observatories, using other frequency bands. Only two presented events were recorded solely in Toruń.
We have evaluated the main observational parameters of the 5328 individual dm radio spikes. The shortest observed spike lasted 0.0026 s only, the longest one 0.284 s. The distribution of durations is right-skewed with a skewness of 1.64, its median 0.029 s; the mean is equal to 0.036 s. 5165 spikes (97%) were shorter than 0.1 s, fulfilling the commonly accepted upper limit on spike duration.
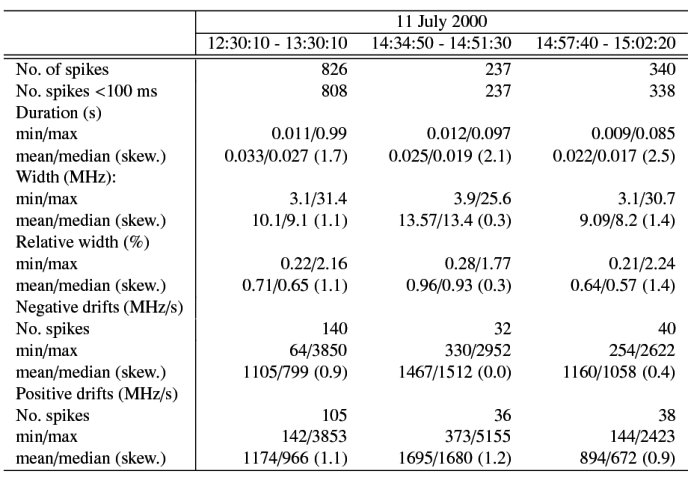
Other basic observational parameters of the spikes (drifts, widths and relative widths) shorter than 100 ms for each observed event are presented in Tables 1 and 2. The distributions of almost all presented parameters are right-skewed, only a few are nearly Gaussian or left-skewed. In the tables we present values of mean, median and skewness of the distribution of all parameters but we do not present the histograms.
The presented durations of the spikes are much longer than the mean duration of the spikes equal to 10 ms, estimated for the same frequency band by Güdel and Benz (1990), and also are longer than the 10 ms mean duration of the spikes observed by Mészárosová et al. (2003). The reason for the difference is not clear, but it cannot be attributed to the observational setup used, for example to the limited temporal resolution of the collected data.
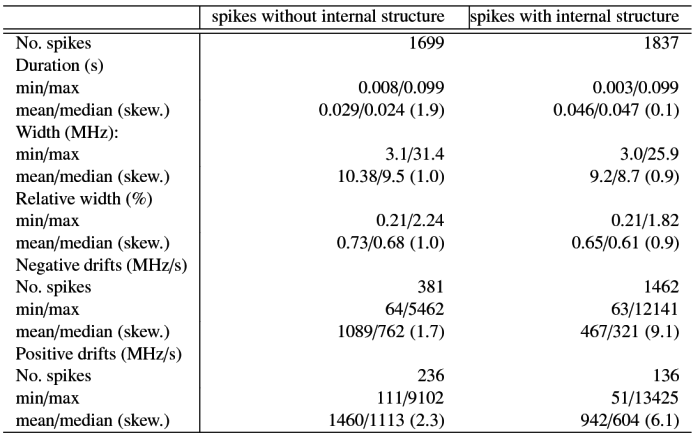
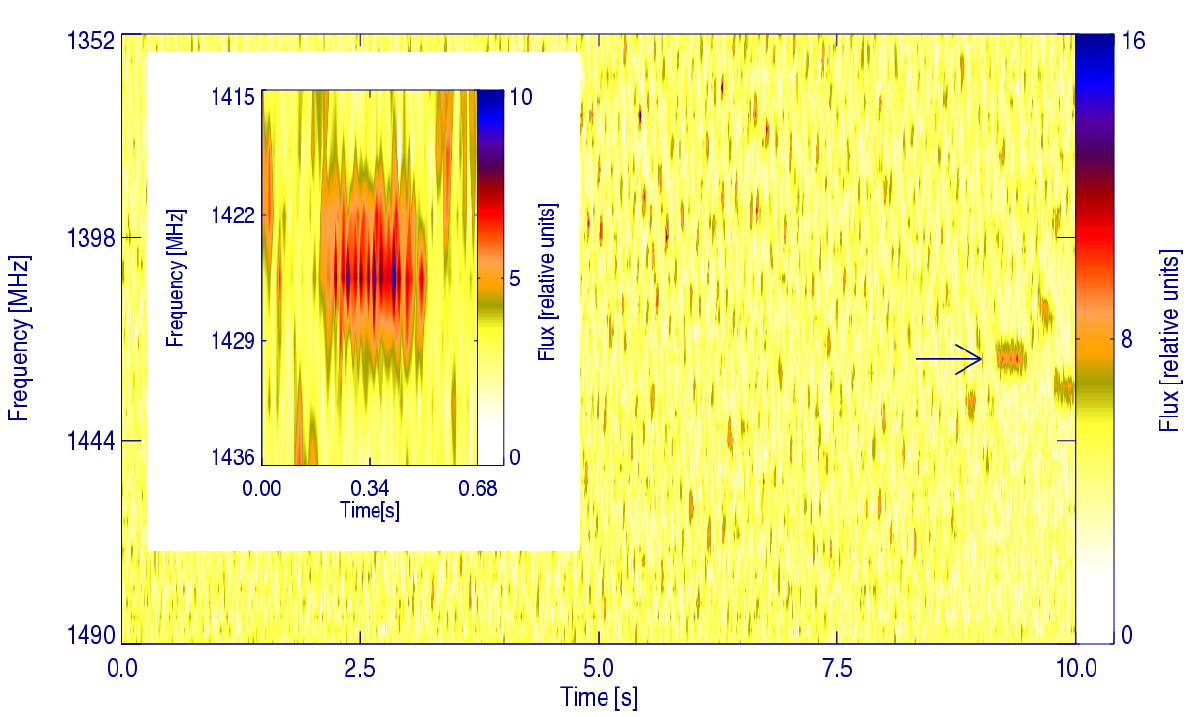
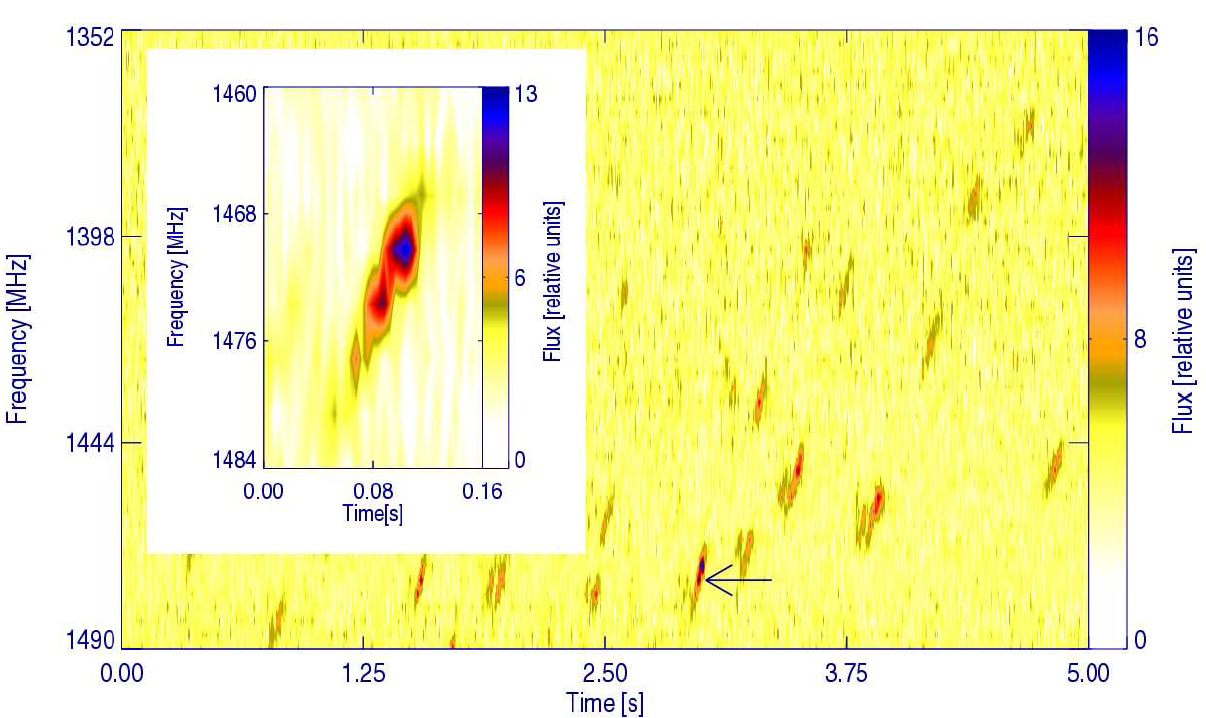
A part of the observed spikes, called by us "spikes without internal structure", have a simple form of a single increase of the radio flux, limited in time and frequency (see Fig.22 ). We have also recorded numerous short, spike-like dm radio emissions showing a well outlined subtle internal structure, consisting of a few local, internal maxima (see Fig.19 ). We will refer them arbitrary as "Spikes with internal structure". For single-frequency instruments or instruments with a limited temporal resolution both kinds of spikes look identical. If the spikes with internal structure are genuine individual spikes with real internal subtle structure or if they are in fact very short-lasting chains of tightly packed spikes with very fast drifts in frequencies should be addressed by future investigations. The main properties of the dm radio spikes with and without internal structure and shorter than 100 ms, observed by us between February 2000 and December 2001, are presented in Table 3.
We classified five radio events (observed on 21 May 2000, 11 July 2000 and 22 March 2001) as ones with spikes without the internal structure only. These events contained 1720 spikes. The distribution of the durations of the 1699 spikes shorter than 0.1 s is right-skewed with skewness equal to 1.86, its median is equal to 0.024 s and its mean is equal to 0.029 s. Four radio events (observed on 15 March 2000, 17 May 2000, 23 April 2001 and 30 October 2001) contained 1895 spikes with internal structure, with 1837 spikes shorter than 0.1 s. The distribution of their durations is close to Gaussian (skewness equal to 0.12) with the median equal to 0.047 s and the mean equal to 0.046 s. The time scale of the internal subtle structures is roughly one order of magnitude shorter. The relative widths in frequency of these emissions are similar to the parameters of the "classical" spikes without internal structure.
The drifts of the spikes with internal structure are distinctly slower than ones without structure. The distribution of the negative drifts of the 381 spikes without structure shorter than 0.1 s is right-skewed with skewness equal to 1.7, its mean is equal to 1089 MHz/s and its median is equal to 762 MHz/s. The distribution of the positive drifts of the 236 spikes without structure shorter than 0.1 s is right-skewed with skewness equal to 2.3, its mean is equal to 1460 MHz/s and its median is equal to 1113 MHz/s. The distribution of the negative drifts of the 1462 spikes with internal structure shorter than 0.1 s is right-skewed with skewness equal to 9.1, its mean is equal to 467 MHz/s and its median is equal to 321 MHz/s. The distribution of the positive drifts of the 136 spikes with structure and shorter than 0.1 s is right-skewed with skewness equal to 6.1, its mean is equal to 942 MHz/s and its median is equal to 604 MHz/s.
We have found that in a framework of the single radio event all emitted dm radio spikes are rather similar. Nevertheless, both types of spikes (with or without internal structure) can be emitted in the same event. Each spike has its own positive (i.e. from low to high) or negative (i.e. from high to low) drift in frequency of various speeds (from tens of MHz per second up to greater than the highest measurable with our instrument, equal to 37.5 GHz per second). Assuming a plasma emission mechanism as a source of the observed spikes, the positive drift in frequency can be interpreted as a motion of the exciter downward (or local increase of the plasma density), while the negative drift can be caused by upward motion (or local decrease of the plasma density).
Figure 1: Definition of the main morphological parameters of the individual dm radio spike evaluated using automatic non-linear fitting of the spike's dynamical radiospectrogram with a two-dimensional elliptical gaussian.
On the dynamic radiospectrograms of the investigated events we have noticed two kinds of well-outlined complex structures formed by numerous individual spikes: well-known chains of spikes and distinctly different structures, "columns". The chains of spikes, observed already e.g. by Güdel and Benz (1988), are formed by tight groups of spikes with their emission band drifting in frequency (i.e. chains with drift) (see Fig.17) or emitted in a constant band (chains without drift) (see Fig.11). The columns of the spikes are formed by numerous individual spikes, recorded over a very short time interval on various frequency of the whole observed band (see Fig.7). In the column, each individual spike can show positive (i.e. from low to high) or negative (i.e. from high to low) drift in frequency. The durations of the chains of the spikes observed by us vary from 100 ms up to 500 ms while the durations of the columns were not longer than 200 ms.
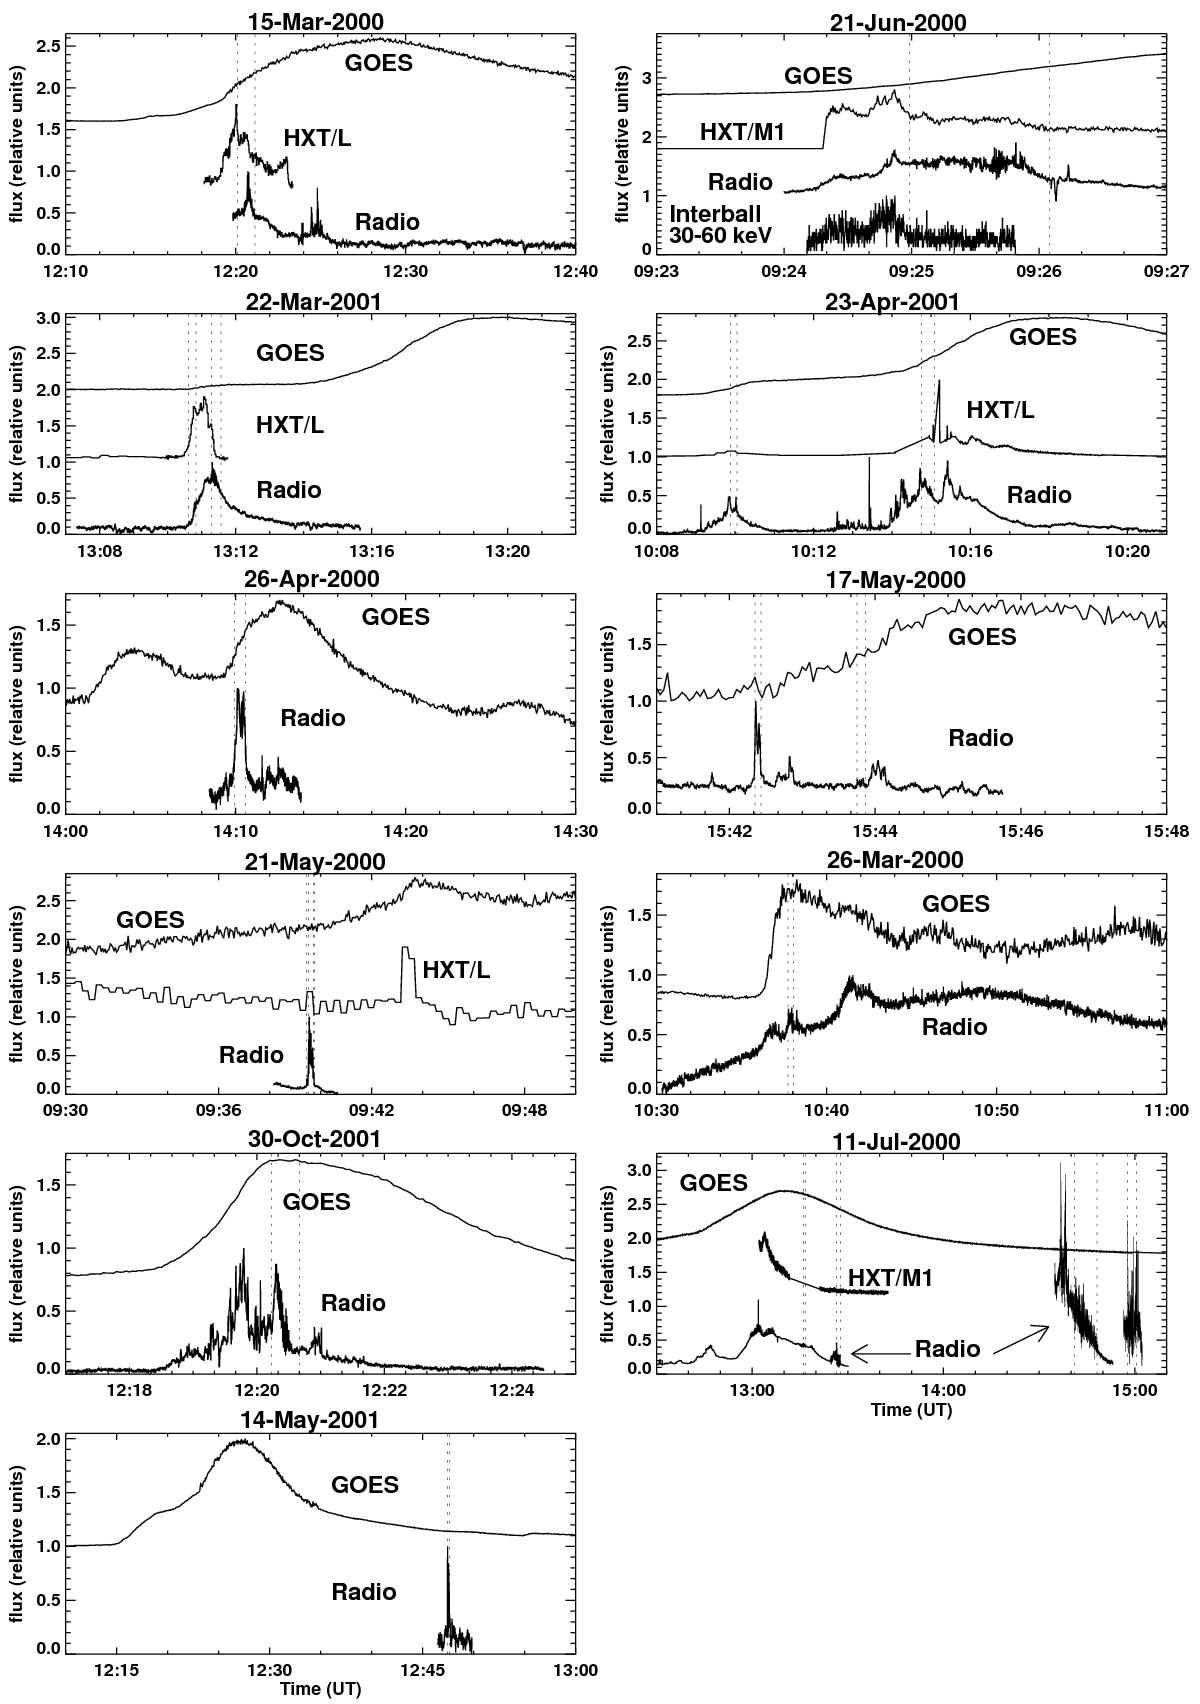
Figure 2: GOES (1-8 Å), HXT/L (14-23 keV), HTX/M1 (23-33 keV), Interball (30-60 keV) and radio (1352-1490 MHz) fluxes recorded during the investigated radio events with dm radio spikes. The time range of the dm radio spike emission is outlined by vertical dotted lines. The y-axis is scaled in relative units.
We have detected thirteen radio events with eighteen emissions of groups of dm radio spikes. Using the Yohkoh/HXT flux curves made in L and M1 channels, we have found that eleven groups of spikes were emitted during increases of the X-ray flux or during the impulsive phases of the solar flares, two groups were emitted during the peaks of the flares and five groups were observed during the gradual phases of the flares (according to the GOES flux curves for 1-8 Å band). The detailed descriptions of the relevant solar events are given below.
The dm radio spikes were recorded between 12:20:06 UT and 12:21:08 UT (see Fig.3) during the DCIM radio event (complex, highly structured emission between 300 and 3000 MHz), observed by us since 12:19:50 UT (it started before the beginning of our observations).
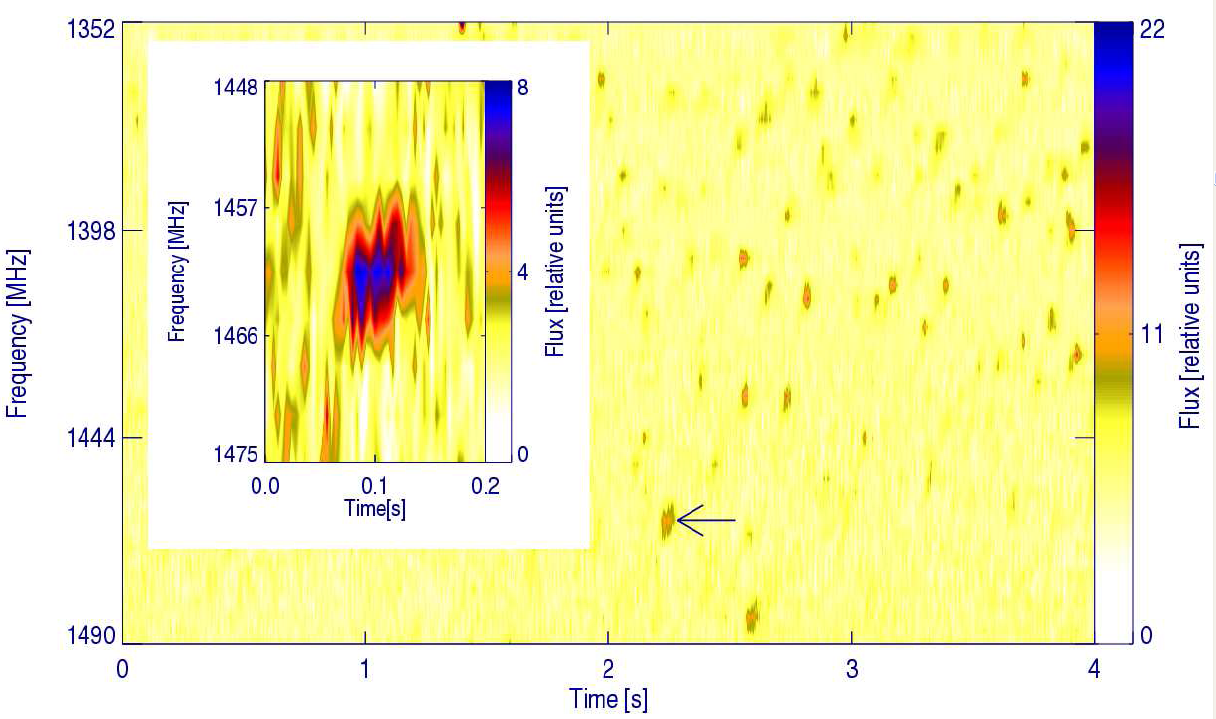
Figure 3: Dynamic radiospectrogram of the dm radio spikes recorded on 15 March 2000, beginning at 12:20:40 UT. Some spikes form clearly visible chains. Here and in the next radiospectrograms the flux is scaled in relative units, the arrow point the spike presented in detail.
The event peaked at 12:20:50 UT and ended at
12:26:20 UT. It was observed by us simultaneously in the 1352-1490 MHz and
327 MHz bands. We have recorded both types of spikes: with and without internal
structure. The spikes occurred during the impulsive phase of the C5 class solar
flare in the NOAA 8906 active region (S18W19) of the magnetic type . The flare started at 12:13 UT, reached a maximum at about 12:29 UT and ended
at 12:55 UT, according to the
GOES classification. A weakly marked plateau on the
GOES flux curve preceded the impulsive phase of the flare (see Fig.2).
The HXT telescope on board the
Yohkoh telescope recorded the emission of the flare in channel L
(14-23 keV), which peaked at 12:20 UT, six seconds before the beginning of the
emission of the spikes. Such a delay between the peak of the high energy hard
X-ray emission and the beginning of the emission of the radio spikes is a
typical phenomenon (Aschwanden and Güdel, 1992). The maximum of the total radio flux was observed about
50 seconds after the maximum of the HXR emission.
. The flare started at 12:13 UT, reached a maximum at about 12:29 UT and ended
at 12:55 UT, according to the
GOES classification. A weakly marked plateau on the
GOES flux curve preceded the impulsive phase of the flare (see Fig.2).
The HXT telescope on board the
Yohkoh telescope recorded the emission of the flare in channel L
(14-23 keV), which peaked at 12:20 UT, six seconds before the beginning of the
emission of the spikes. Such a delay between the peak of the high energy hard
X-ray emission and the beginning of the emission of the radio spikes is a
typical phenomenon (Aschwanden and Güdel, 1992). The maximum of the total radio flux was observed about
50 seconds after the maximum of the HXR emission.
The flare was caused very likely by the Y- or I-type interaction of the loops in an arcade of loops (Sakai and de Jager, 1996), well visible on the images taken with the SXT telescope (see Fig.4). The maximum of the temperature of the plasma T=8 MK was recorded at 12:25 UT, while the maximum of the emission measure EM=4×1048 cm-3 occurred four minutes later (both values were evaluated using GOES data).
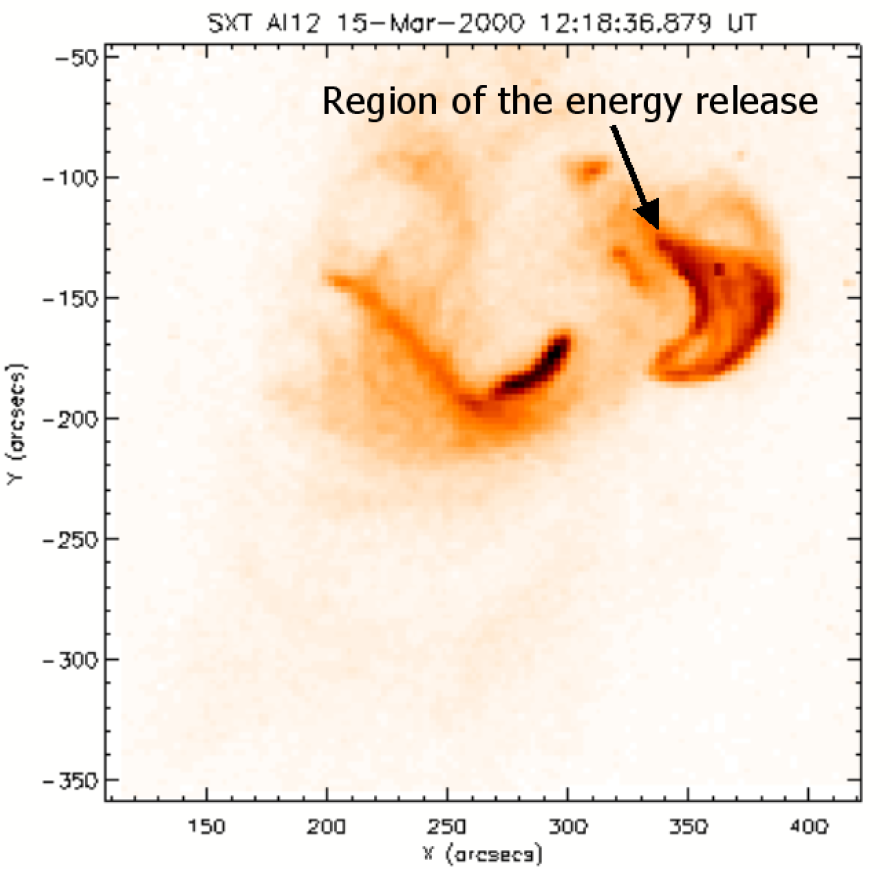
Figure 4: Image of the NOAA 8906 active region taken with SXT/Al12 on 15 March 2000 at 12:18:37 UT, one and a half minutes before the emission of the dm radio spikes.
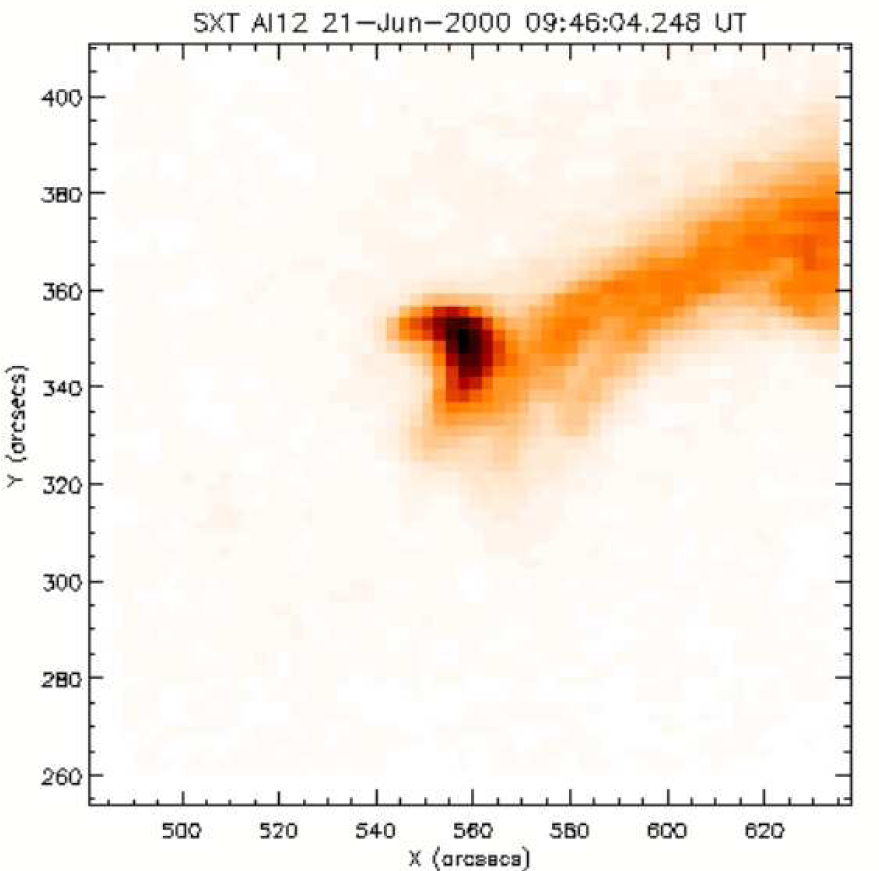
A solar radio burst was observed between 09:24:00 UT and 09:30:08 UT simultaneously in the 1352-1490 MHz and 327 MHz bands. During the long-lasting peak of the event numerous dm radio spikes were recorded between 09:24:59 UT and 09:26:05 UT (see Fig.5).
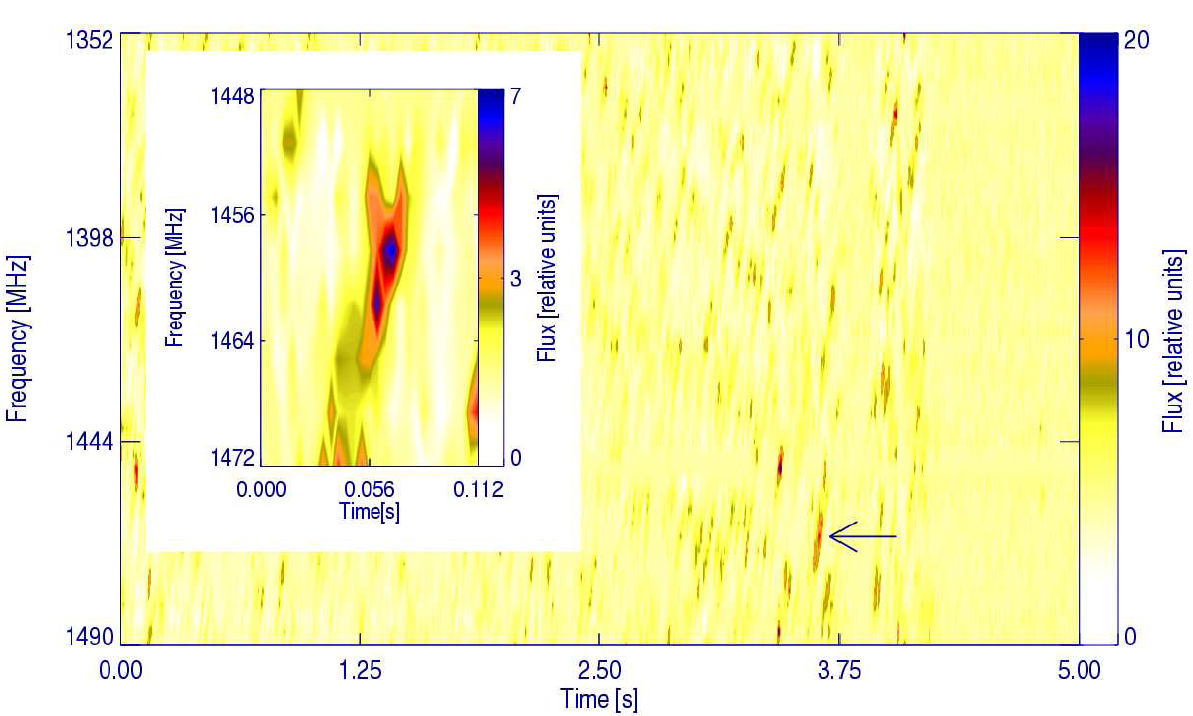
Figure 5: Dynamic radiospectrogram of the dm radio spikes recorded on 21 June 2000, beginning at 09:25:45 UT. One can notice both types of spikes: with and without internal structure; some of them are aggregated in columns of spikes.
We noticed both types of spikes: with and without
internal structure, some of them aggregated in the columns of the spikes. The
radio spikes were observed at the end of the impulsive phase of the M1.3 class
solar flare, which started at 09:22 UT, reached a maximum at about 09:29 UT, and
ended at 09:37 UT (see Fig.2). The flare occurred
in the NOAA 9042 active region (N24W34) of magnetic type (Rudawy
et al., 2002). It was observed also as a SF
(Rudawy
et al., 2002). It was observed also as a SF
![]() class flare between 09:24 UT and 09:41 UT. In the maximum of the flare the
plasma temperature was equal to T=15.5 MK at 09:27 UT and the emission measure
was EM=1.5×1049 cm-3 at 09:33 UT (both values are evaluated using GOES data).
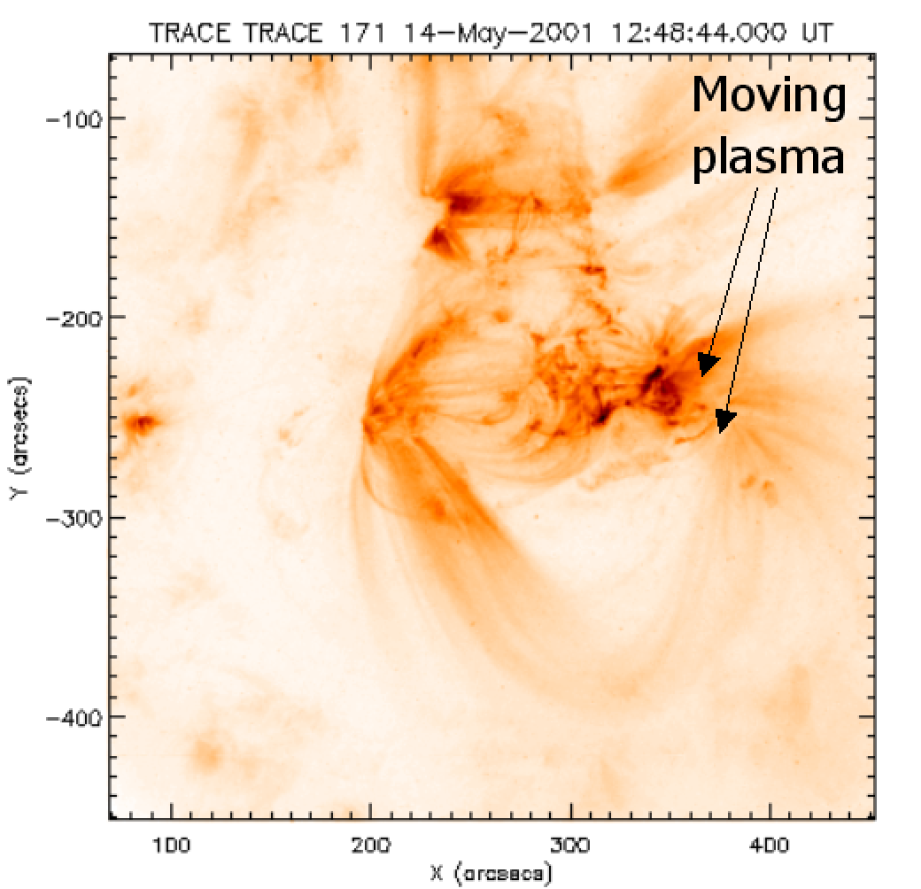
Immediately after the impulsive phase a long-lasting flow of the plasma started
along a system of stretched magnetic loops (see Fig.6). Temporal evolution of
the system of loops also indicates a co-temporal eruption of an active region
filament.
class flare between 09:24 UT and 09:41 UT. In the maximum of the flare the
plasma temperature was equal to T=15.5 MK at 09:27 UT and the emission measure
was EM=1.5×1049 cm-3 at 09:33 UT (both values are evaluated using GOES data).
Immediately after the impulsive phase a long-lasting flow of the plasma started
along a system of stretched magnetic loops (see Fig.6). Temporal evolution of
the system of loops also indicates a co-temporal eruption of an active region
filament.
The radio DCIM event was observed between 13:10:28 UT and 13:13:45 UT. The first group of dm radio spikes was recorded between 13:10:37 UT and 13:10:50 UT and the second one between 13:11:17 UT and 13:11:34 UT (see Fig.7).
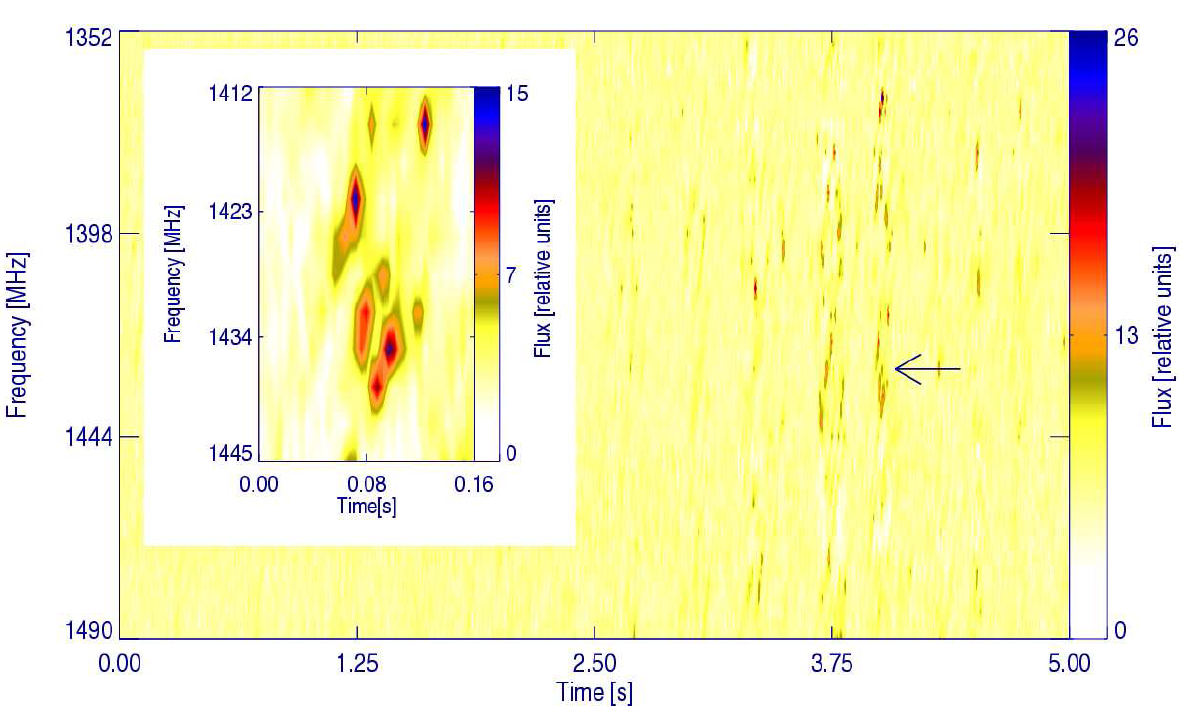
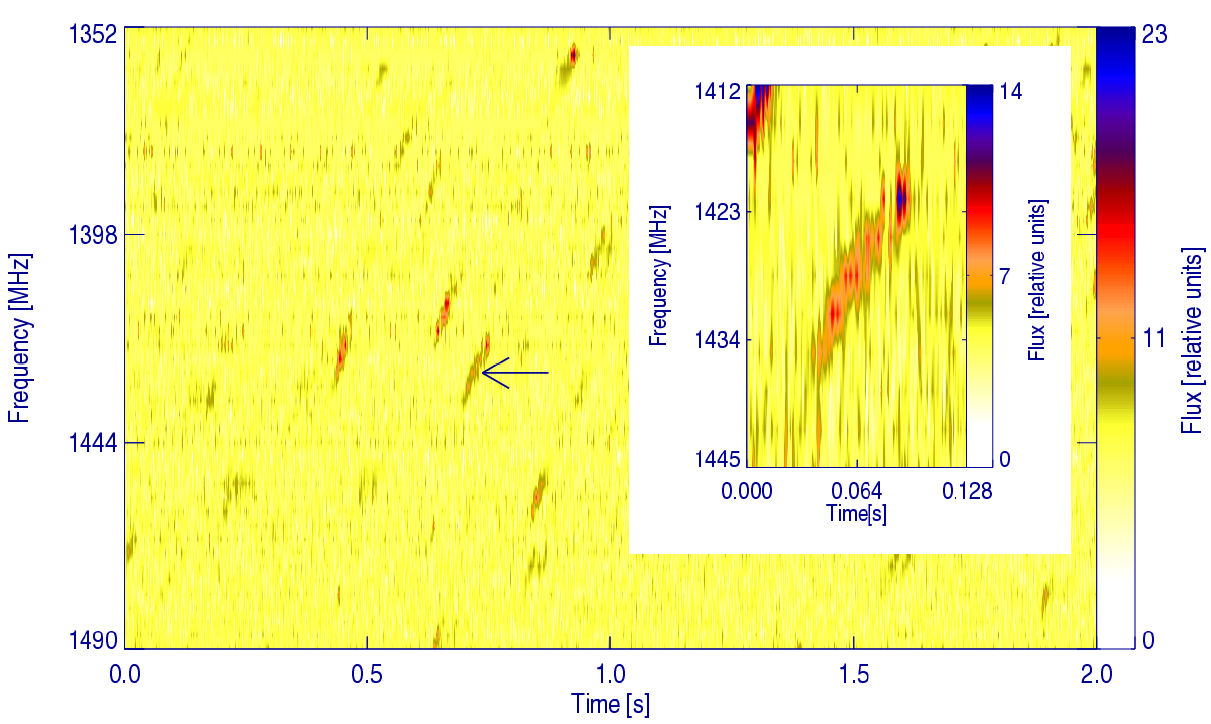
Figure 7: Dynamic radiospectrogram of the dm radio spikes recorded on 22 March 2001, beginning at 13:11:15 UT. On the spectra one can recognise columns of spikes. The individual spikes have no internal structure.
On the dynamic radiospectrogram the spikes forms columns, the individual spikes have no
internal structure. Both groups of spikes occurred at the beginning and at the
end of the impulsive phase of the M1.0 solar flare, respectively (see Fig.2).
The M1.0 solar flare started at 13:12 UT, peaked at 13:19 UT and end at
13:34 UT. It was observed in the NOAA 9390 active region (N14E60) of magnetic
type  . The start of the impulsive phase of the flare was marked by the temporal
increase of the hard X-ray flux recorded with the HXT/L telescope. The GOES
X-ray light curve of the flare shows a plateau following the impulsive phase.
The maximum of the temperature of the plasma T=16.1 MK was observed at 13:17 UT,
while the maximum of the emission measure EM=1.1×1049 cm-3 was recorded at 13:28 UT (both values are evaluated using GOES
data). During the maximum of the flare, the TRACE telescope recorded
bright loops and bright emission kernels (in the 171 Å band) but we have not
found any bulk mass motion or severe rebuilding of the magnetic configuration
(see Fig.8).
. The start of the impulsive phase of the flare was marked by the temporal
increase of the hard X-ray flux recorded with the HXT/L telescope. The GOES
X-ray light curve of the flare shows a plateau following the impulsive phase.
The maximum of the temperature of the plasma T=16.1 MK was observed at 13:17 UT,
while the maximum of the emission measure EM=1.1×1049 cm-3 was recorded at 13:28 UT (both values are evaluated using GOES
data). During the maximum of the flare, the TRACE telescope recorded
bright loops and bright emission kernels (in the 171 Å band) but we have not
found any bulk mass motion or severe rebuilding of the magnetic configuration
(see Fig.8).
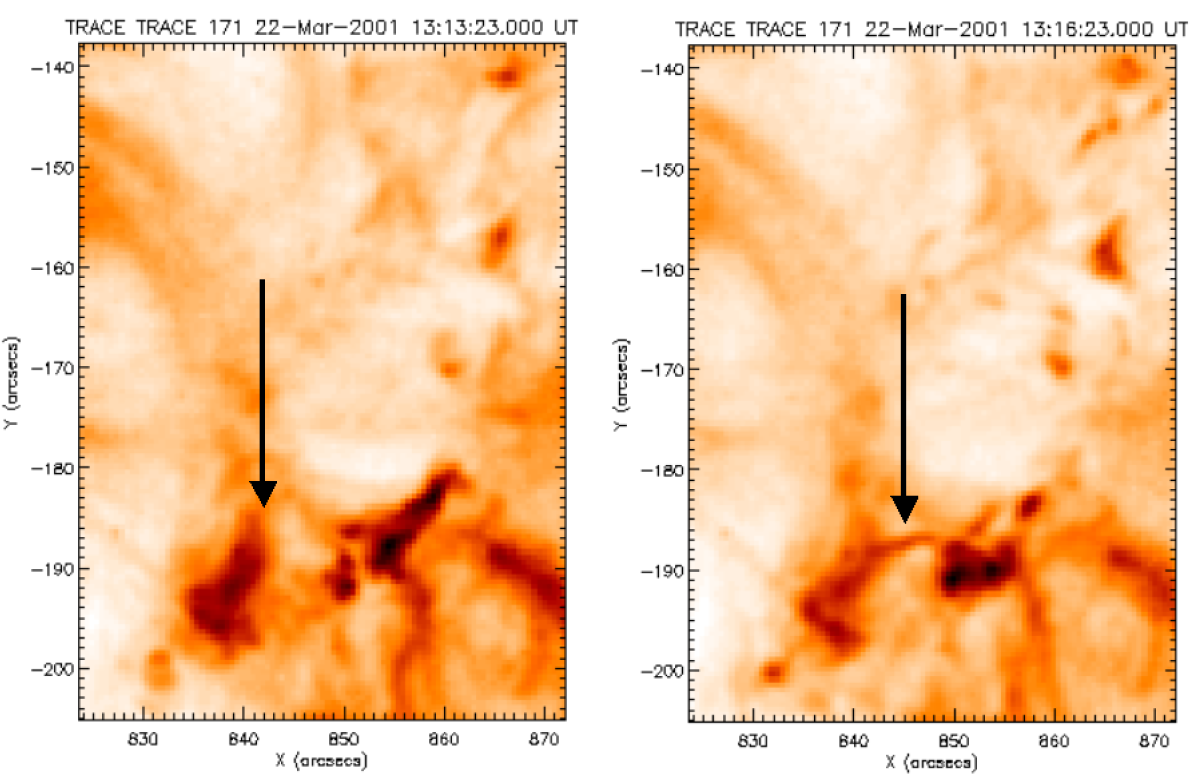
Figure 8: Image of the NOAA 9390 active region taken with TRACE (171 Å) telescope on 22 March 2001 at 13:13:23 UT (left panel) and at 13:16:23 UT (right panel). The arrows points to the loop gradually filled by the hot plasma.
The radio DCIM event started at 10:08:30 UT and ended at 10:21:50 UT. The first group of dm radio spikes was recorded between 10:09:53 UT and 10:10:03 UT, the second one between 10:14:45 UT and 10:15:05 UT (see Fig.9).
We have recorded
both types of spikes: with and without internal structure. The first group of
spikes, well correlated in time with a short emission of hard X-rays, occurred
at the beginning of the minor increase of the X-ray flux, followed by the
plateau on the X-ray light curve of the C9.1 solar flare (see Fig.2).
The flare occurred in the NOAA 9433 active region (N17E26) of magnetic type
 ; it started at 10:06 UT, peaked at 10:18 UT and ended at 10:23 UT.
The second group of spikes was recorded at the beginning of the main impulsive
phase of the flare which was signalled also by the second increase of the hard
X-ray flux. The same flare was observed as an SF
; it started at 10:06 UT, peaked at 10:18 UT and ended at 10:23 UT.
The second group of spikes was recorded at the beginning of the main impulsive
phase of the flare which was signalled also by the second increase of the hard
X-ray flux. The same flare was observed as an SF
![]() class flare between 10:10 UT and 10:29 UT. The maximum of the temperature of
the plasma T=14.6 MK was recorded at 10:17 UT, while the maximum of the emission
measure EM=1.1×1049
cm-3 at 10:21 UT (both values are evaluated using GOES
data). Both groups of spikes occurred simultaneously with the flow of matter
along arcades of the loops (see Fig.10).
class flare between 10:10 UT and 10:29 UT. The maximum of the temperature of
the plasma T=14.6 MK was recorded at 10:17 UT, while the maximum of the emission
measure EM=1.1×1049
cm-3 at 10:21 UT (both values are evaluated using GOES
data). Both groups of spikes occurred simultaneously with the flow of matter
along arcades of the loops (see Fig.10).
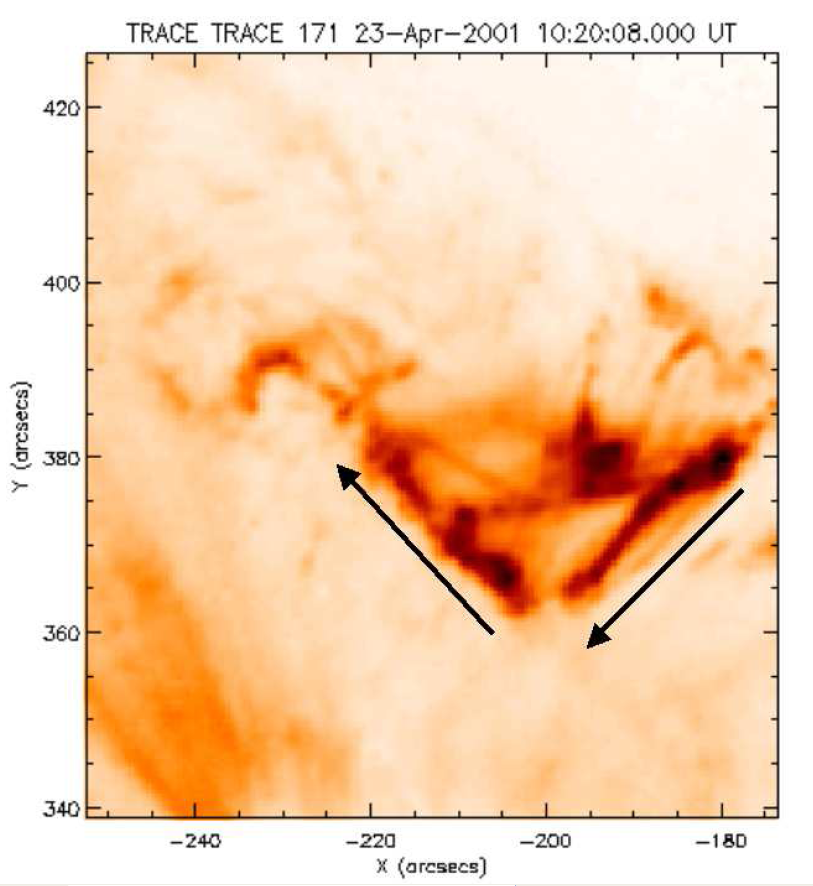
Figure 10: Image of the NOAA 9433 active region taken with TRACE (171 Å) on 23 April 2001 at 10:20:08 UT. The arrows show the directions of the plasma motion.
The dm radio spikes were recorded between 14:09:55 UT and 14:10:35 UT (see
Fig.11), during the radio event observed from 14:09:34 UT, which peaked at
14:10:08 UT and ended at 14:11:08 UT. The event was observed by us
simultaneously in the 1352-1490 MHz band and in the 327 MHz band, where we
recorded a noise storm. While the fluxes of the individual spikes were very low
and the spikes were very short in time, we are not able to make reliable
quantitative measurements of their main properties, except the mean duration of
0.05 s, and a bandwidth about 7 MHz. Some spikes formed the separate chains of
the spikes. The spikes were observed during a small increase of the X-ray flux
(B7 GOES class), observed in X-rays between 14:09 UT and 14:26 UT, mainly
with the hard channel (0.5-4 Å), but also in the soft channel (1-8 Å) of the
GOES satellite (see Fig.2). This increase of
the X-ray flux was caused by an I-type interaction of two loops, well recorded
by the SXT telescope in the NOAA 8970 active region (S15E10) of the magnetic
type ![]() (see Fig.12). The beginning of the emission of the radio spikes apparently
occurred during the energy release in the system of interacting loops. The
maximum of the temperature of the plasma T=9 MK occurred at 14:11 UT, while the
maximum of the emission measure EM=4×1047
cm-3 was observed two minutes later (the values are evaluated using SXT
data).
(see Fig.12). The beginning of the emission of the radio spikes apparently
occurred during the energy release in the system of interacting loops. The
maximum of the temperature of the plasma T=9 MK occurred at 14:11 UT, while the
maximum of the emission measure EM=4×1047
cm-3 was observed two minutes later (the values are evaluated using SXT
data).
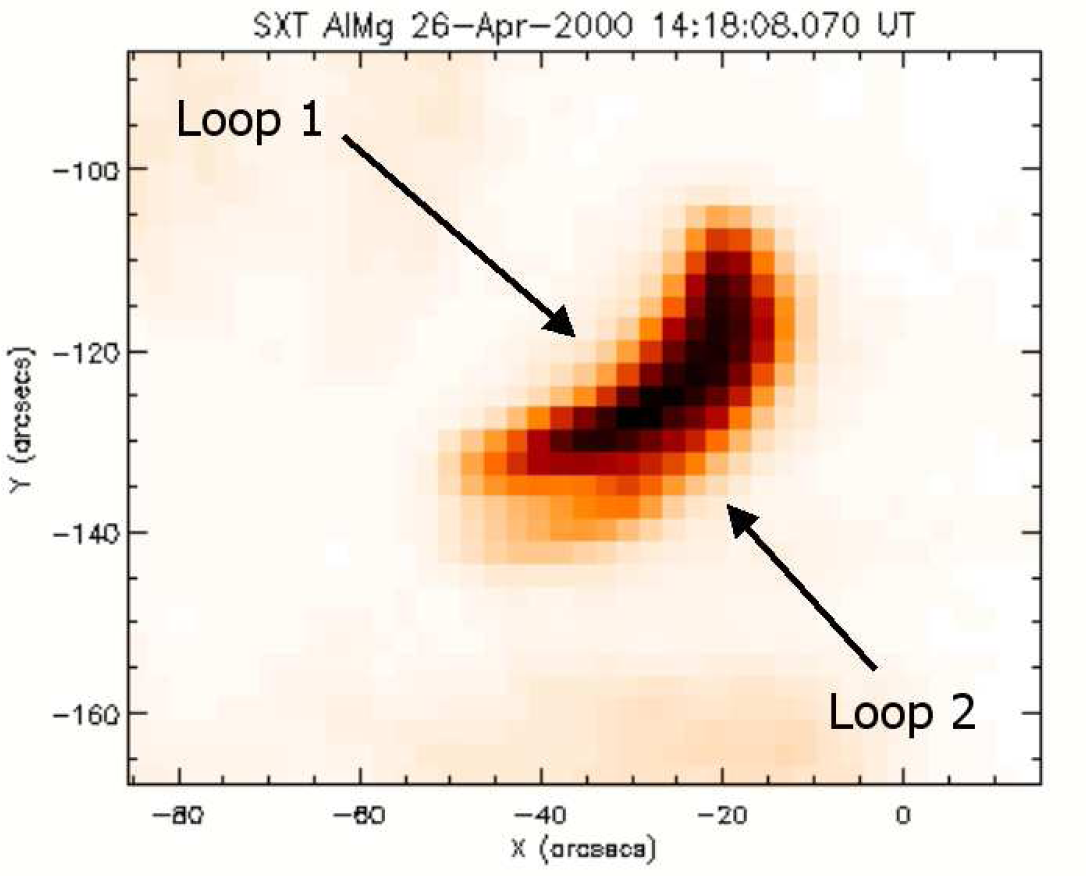
Figure 12: Image of the NOAA 8970 active region taken with SXT/AlMg telescope on 26 April 2000 at 14:18:08 UT.
The dm radio spikes occurred in two groups, separated in time by nearly 79
seconds (see Fig.13). The first group of spikes was recorded between 15:42:21 UT
and 15:42:26 UT, the second one was recorded between 15:43:45 UT and
15:43:52 UT. The whole radio event, which started at 15:41:40 UT, consists of a
few local maxima with the highest one exactly co-temporal with the first group
of dm radio spikes mentioned before. It was observed by us simultaneously in the
1352-1490 MHz band and in the 327 MHz band, where we recorded the noise storm.
The spikes were well distinguishable from the recorded radio background. We have
recorded both kinds of the spikes: with and without internal structure. The
radio spikes were observed during the small
GOES X-ray event (C2.2 GOES class) (the first group of spikes
occurred at the beginning of the X-ray flux rise) in the NOAA 8999 active region
(N20E20) of magnetic type![]() (see Fig.2). The X-ray event was associated with an SF class
(see Fig.2). The X-ray event was associated with an SF class
![]() flare reported between 15:44 UT and 15:56 UT. The images of the active region
taken with the TRACE
telescope in the 195 Å band shows two separate regions of interaction of the
short loops and an ejection of the plasma from the northern part of the active
region, which was co-temporal with the emission of the dm radio spikes (see
Fig.14).
flare reported between 15:44 UT and 15:56 UT. The images of the active region
taken with the TRACE
telescope in the 195 Å band shows two separate regions of interaction of the
short loops and an ejection of the plasma from the northern part of the active
region, which was co-temporal with the emission of the dm radio spikes (see
Fig.14).
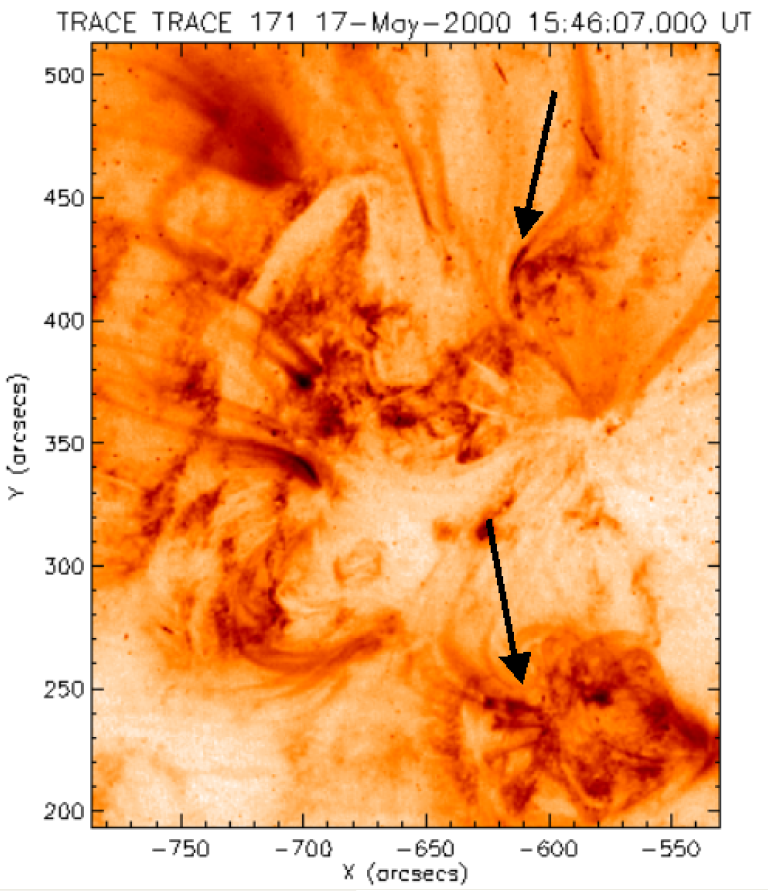
Figure 14: Image of the NOAA 8999 active region taken with the TRACE (171 Å) telescope on 17 May 2000 at 15:46:07 UT. The arrows points to the regions with clearly visible motions of matter along the magnetic loops.
The whole radio event started at 09:39:14 UT, reached maximum at 09:39:33 UT and
ended at 09:40:10 UT. It was observed by us simultaneously in the 1352-1490 MHz
and 327 MHz bands. During this event we recorded two groups of dm radio spikes:
the first one started at 09:39:26 UT and ended at 09:39:31 UT, the second one
started at 09:39:44 UT and ended 09:39:45 UT (see Fig.15). The spikes have no the
internal structure. Between the observations of both groups of spikes we also
recorded a radio emission with the dynamic radiospectrograms similar to the
"glued" spikes. The radio spikes were observed during the more than 1.5 hour
very slow increase of the X-ray signal (the GOES signal was at the C6
level during the emission of the dm radio spikes), which peaked at about
10:25 UT at the C8.2 level as an SF class solar flare in the NOAA 8996 active
region (S18W47) of magnetic type![]() (see Fig.2). We have not found any other
manifestations of solar activity which can be combined with the spikes.
(see Fig.2). We have not found any other
manifestations of solar activity which can be combined with the spikes.
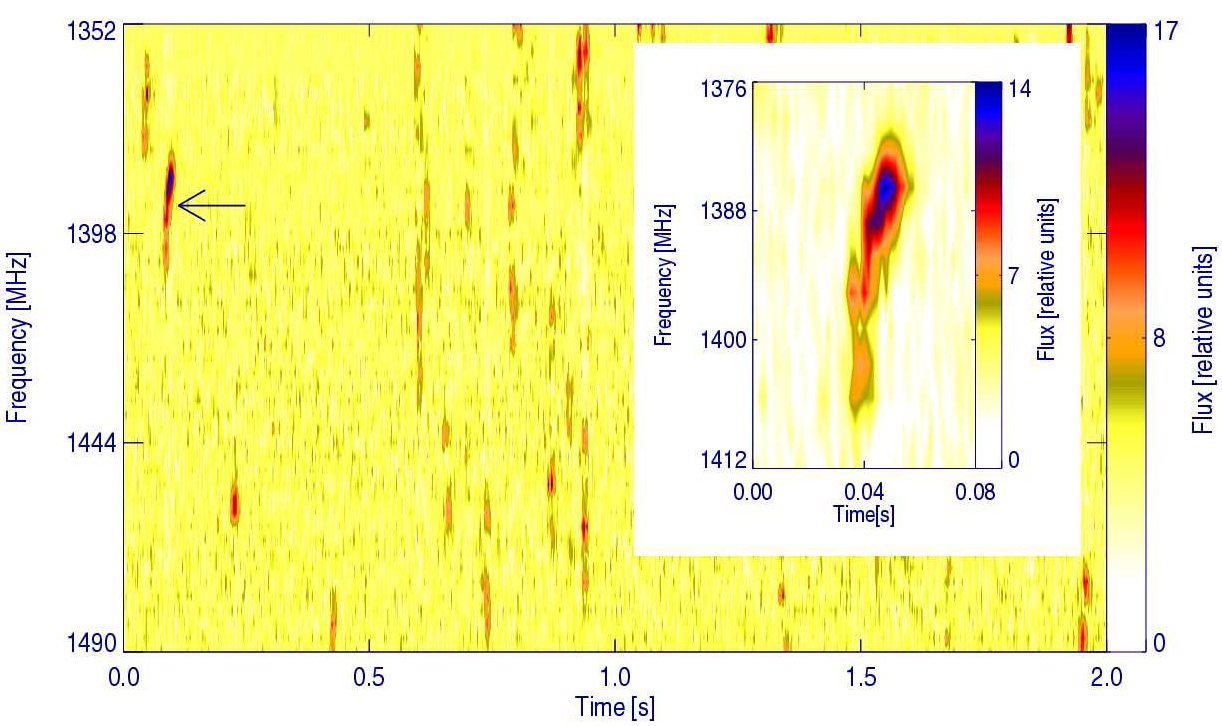
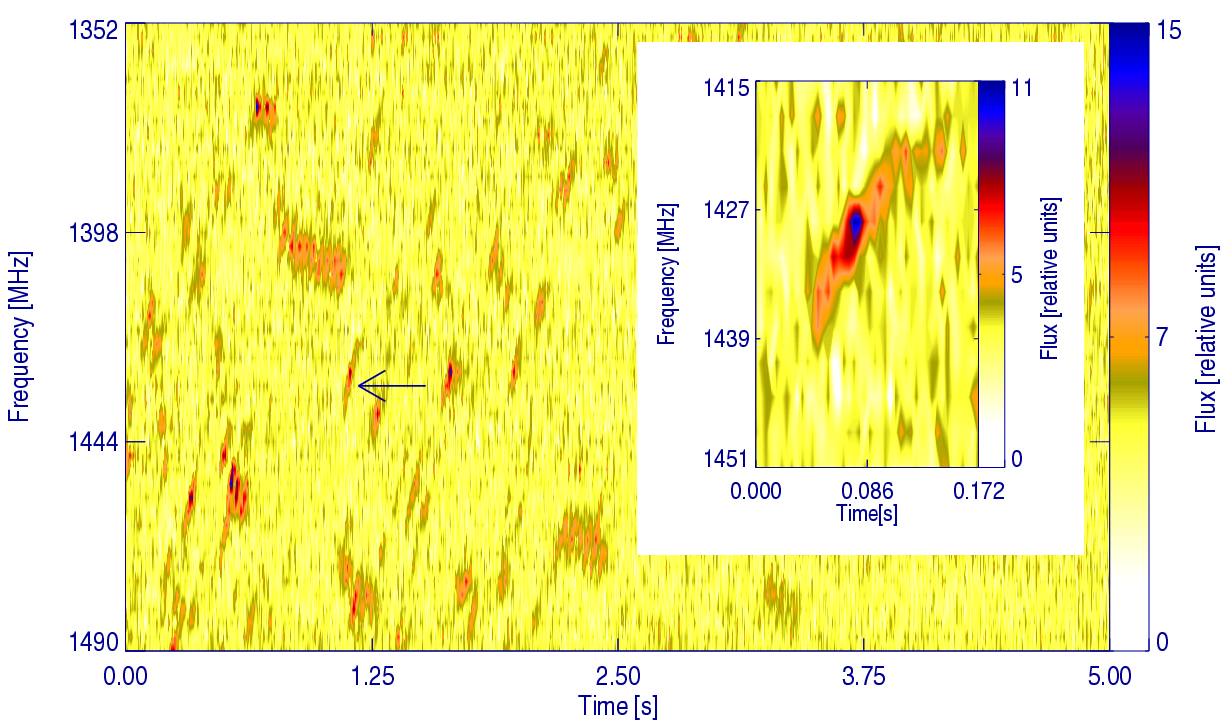
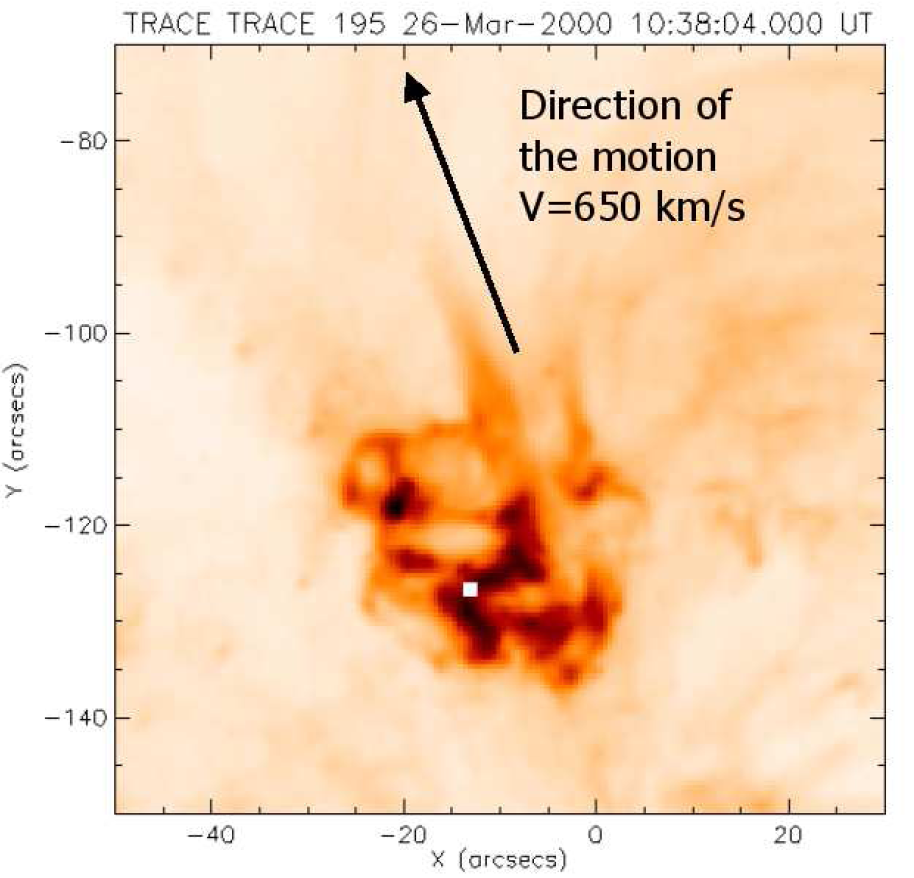
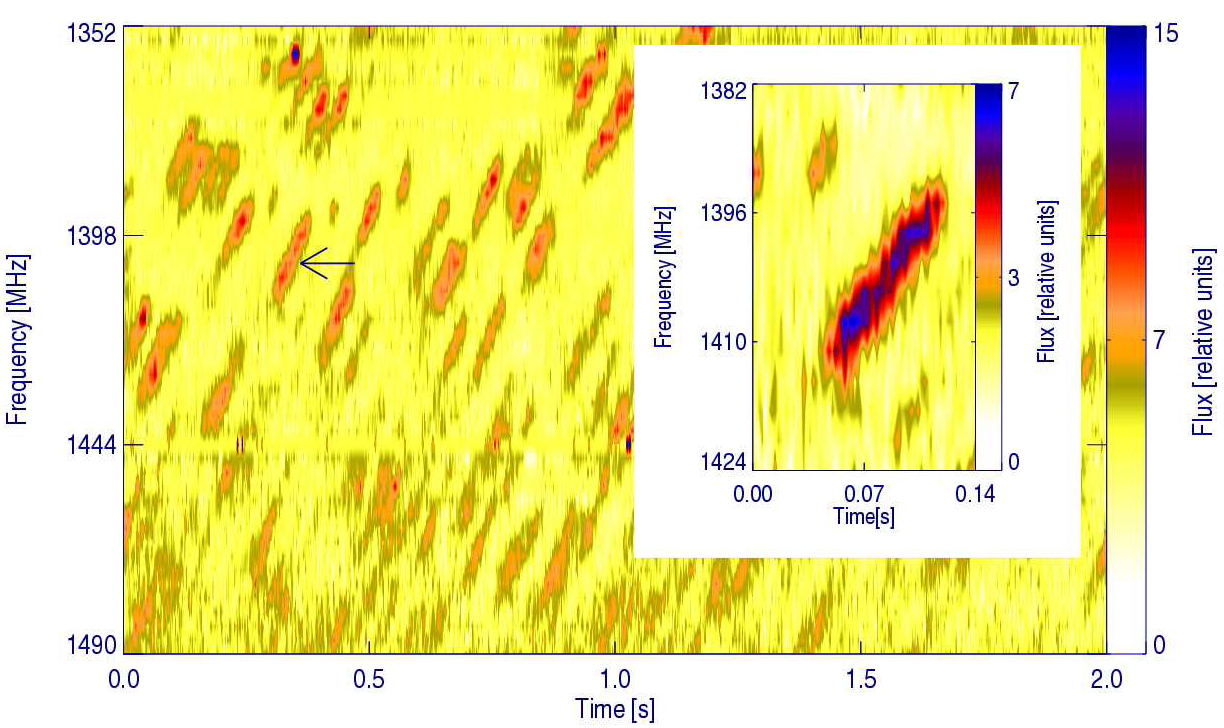
Figure 16: Dynamic radiospectrogram of the dm radio spikes recorded on 26 March 2000, beginning at 10:38:00 UT. Some spikes show clearly visible internal subtle structure.
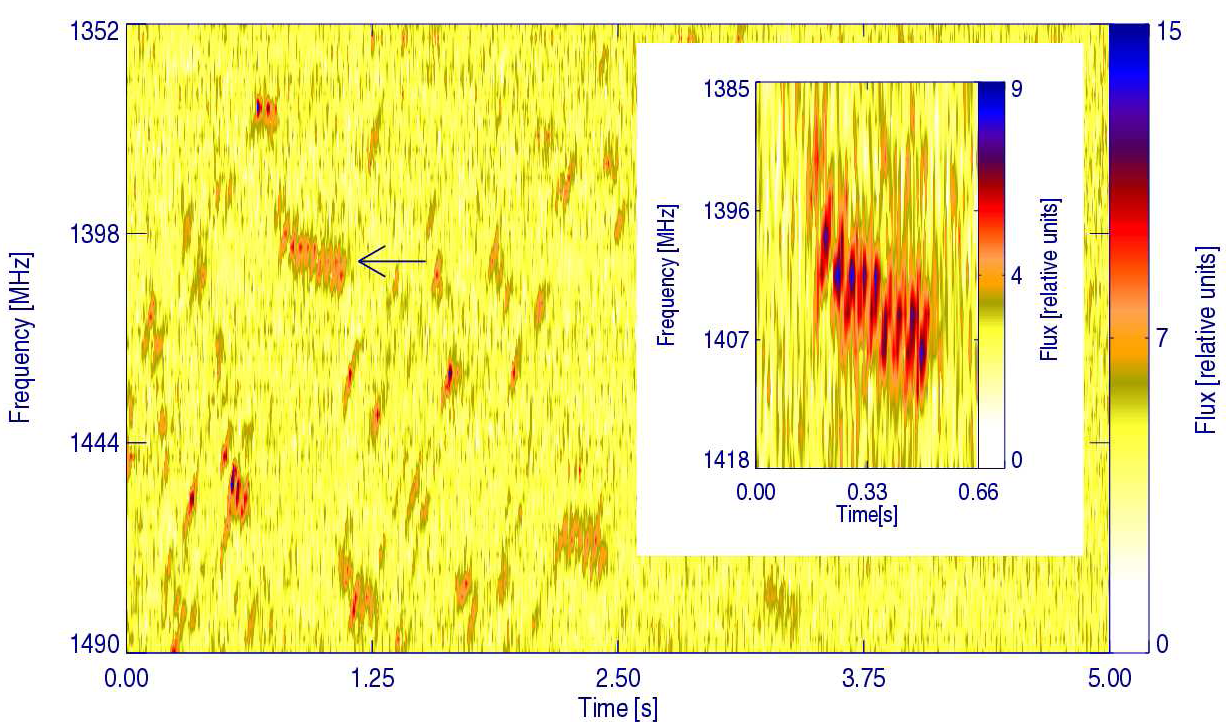
Figure 17: Dynamic radiospectrogram of the dm radio spikes recorded on 26 March 2000, beginning at 10:38:00 UT. Some spikes form clearly visible chains with drift in frequency.
The radio spikes were observed from 10:37:44 UT to 10:38:04 UT, during the DCIM
radio event observed by us from 10:30:20 UT to 10:50:00 UT (see Fig.16 and
Fig.17) simultaneously in 1352-1490 MHz and 327 MHz bands. The recorded radio
flux consists of two components: quiet rise and fall emission overlaid with
three short-lasting peaks. The emission of the spikes occurred at the same time
as the second, but not the highest, peak of the radio flux (see Fig.2).
Numerous recorded spikes have internal structure but other have not. Some spikes
were aggregated in chains. The spikes occurred during the maximum of the C2
class solar flare, which started at 10:35 UT, reached the maximum at 10:38 UT,
and ended at 10:44 UT (according to the GOES
classification). The flare was observed in the NOAA 8941 active region (S18E09)
of magnetic type![]() . The maximum of the temperature of the plasma T=7 MK occurred at 10:36 UT,
while the maximum of the emission measure EM=2×1047 cm-3 was at 10:44 UT (both values are evaluated using GOES data).
Between 10:36:51 UT and 10:38:04 UT TRACE (195 Å) recorded a spray
ejected from the central part of the active region. The average velocity of the
spray was 650 kms-1 (see Fig.18). Radio spikes were released at the same time as the spray
was observed.
. The maximum of the temperature of the plasma T=7 MK occurred at 10:36 UT,
while the maximum of the emission measure EM=2×1047 cm-3 was at 10:44 UT (both values are evaluated using GOES data).
Between 10:36:51 UT and 10:38:04 UT TRACE (195 Å) recorded a spray
ejected from the central part of the active region. The average velocity of the
spray was 650 kms-1 (see Fig.18). Radio spikes were released at the same time as the spray
was observed.
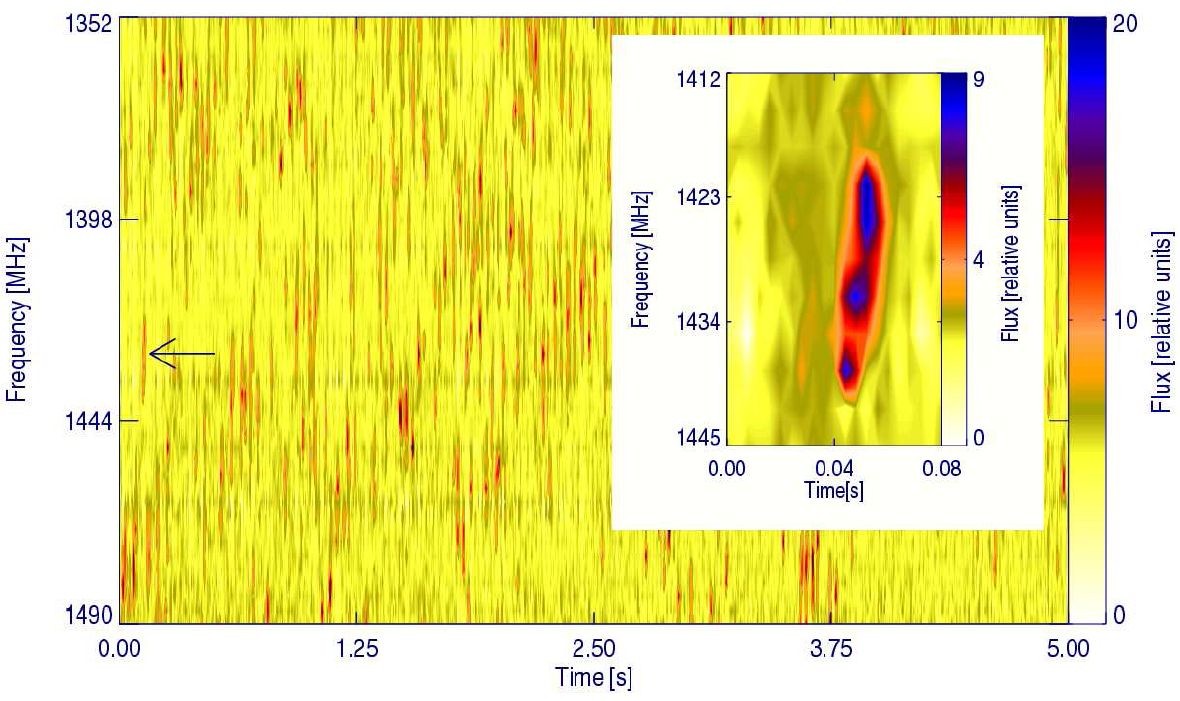
The radio DCIM event started at 12:18:14 UT and ended at 12:22:36 UT. The dm
radio spikes were recorded between 12:20:14 UT and 12:20:40 UT, during the peak
of the C7.4 solar flare (start at 12:16 UT, maximum at 12:20 UT, end at
12:23 UT) in the NOAA 9682 active region (N12E10) of magnetic type
![]() ,
noted also as a 1N class
,
noted also as a 1N class
![]() flare between 12:18 UT and 12:32 UT (see Fig.19 , Fig.2).
The maximum of the temperature of the plasma T=12.3 MK occurred at 12:20 UT,
while the maximum of the emission measure EM=8×1048 cm-3 was reached at 12:21 UT (both values are evaluated using GOES
data). The observed radio spikes have internal structure and form chains. They
occurred during the bulk motion of the plasma along the long loops, observed
with the TRACE telescope in the 171 Å band (see Fig.20).
flare between 12:18 UT and 12:32 UT (see Fig.19 , Fig.2).
The maximum of the temperature of the plasma T=12.3 MK occurred at 12:20 UT,
while the maximum of the emission measure EM=8×1048 cm-3 was reached at 12:21 UT (both values are evaluated using GOES
data). The observed radio spikes have internal structure and form chains. They
occurred during the bulk motion of the plasma along the long loops, observed
with the TRACE telescope in the 171 Å band (see Fig.20).
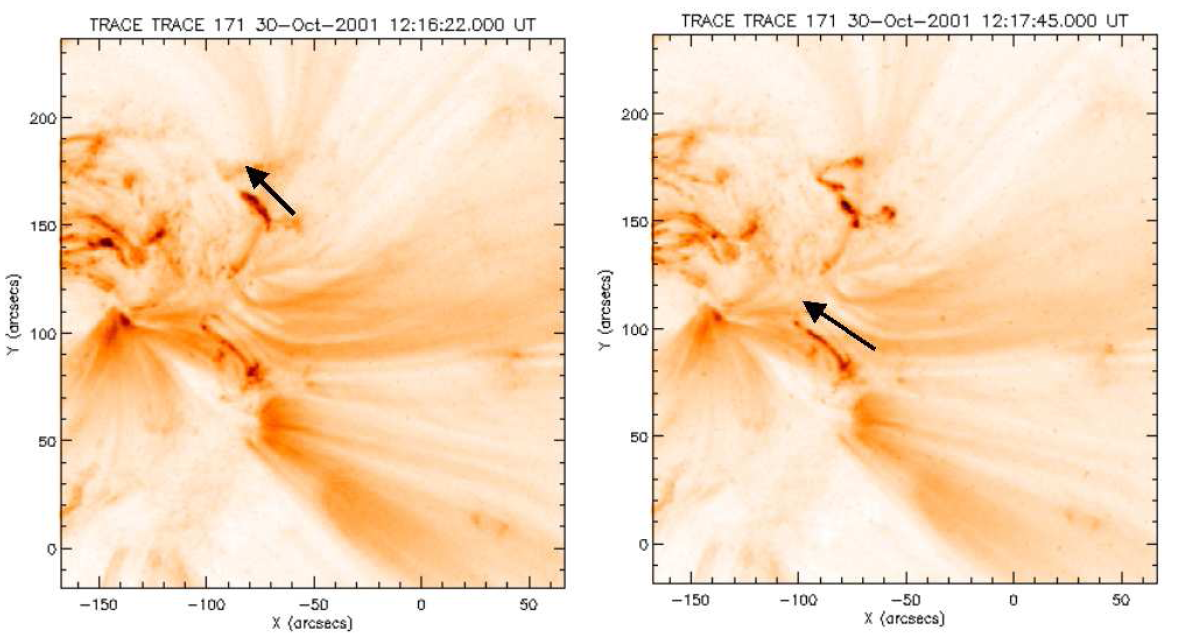
Figure 20: Images of the NOAA 9682 active region taken with TRACE (171 Å) on 30 October 2001 at 12:16:22 UT (left panel) and 12:17:45 UT (right panel). The arrows show the direction of the plasma motion.
On 11 July 2000 we recorded four groups of radio spikes emitted during three separate radio events (see Fig.21 , Fig.22 , Fig.23, Fig.24 , respectively). The first event consisted of two separate groups of spikes, recorded by us during the DCIM-type radio event observed between 12:30:10 UT and 13:30:10 UT. The first group was recorded between about 13:16:03 UT and 13:16:44 UT, the second one between about 13:26:30 UT and 13:27:37 UT. The second group was observed also by Karlický and co-workers, who reported dm radio spikes between 13:25:40 UT and 13:27:40 UT in the frequency band 1.0-1.8 GHz (Karlický et al., 2001). The third group of spikes was recorded from 14:41:10 UT to 14:48:10 UT, during the next DCIM radio event observed by us between 14:34:50 UT and 14:51:30 UT. It started before the start of our observations. The last group of spikes, observed from 14:57:49 UT to 15:00:37 UT, occurred during the last radio event, observed from 14:57:40 UT to 15:02:20 UT.
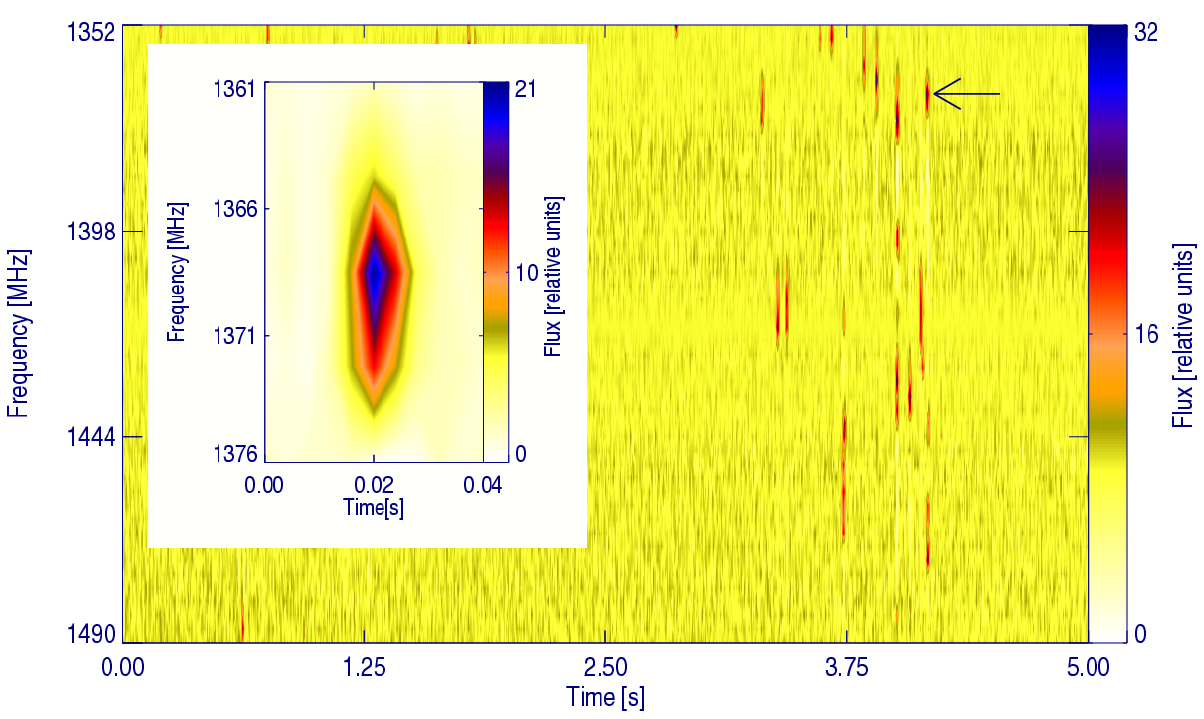
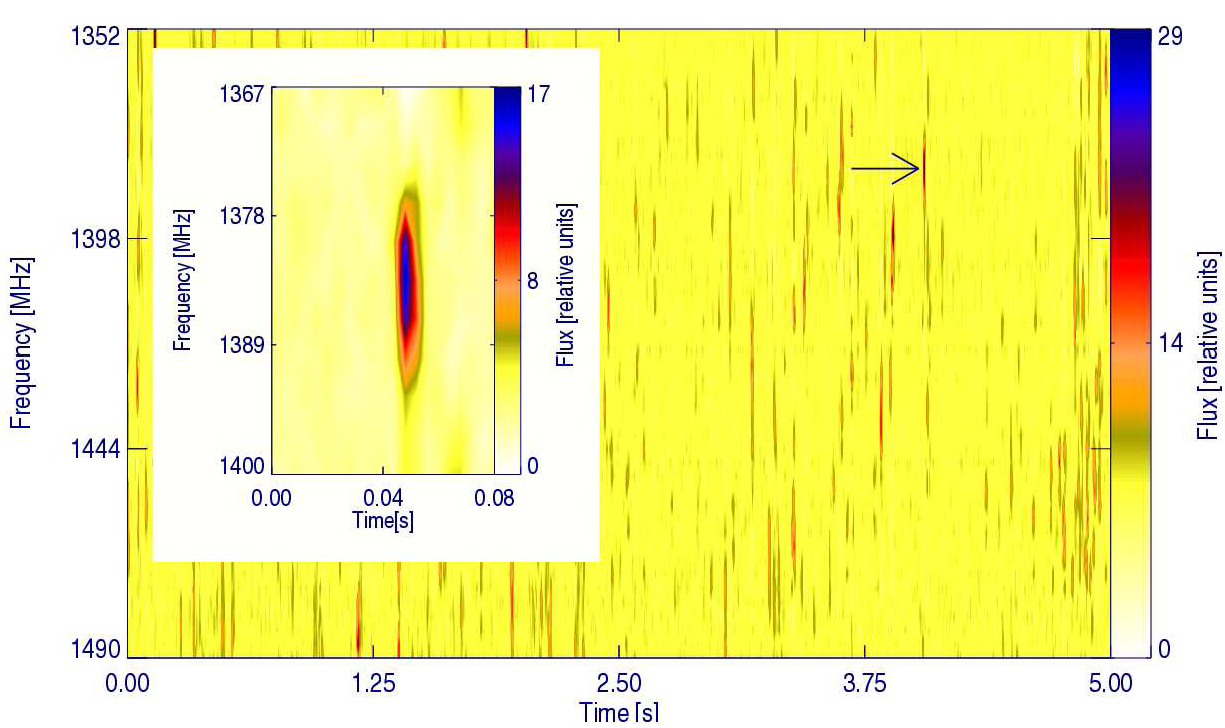
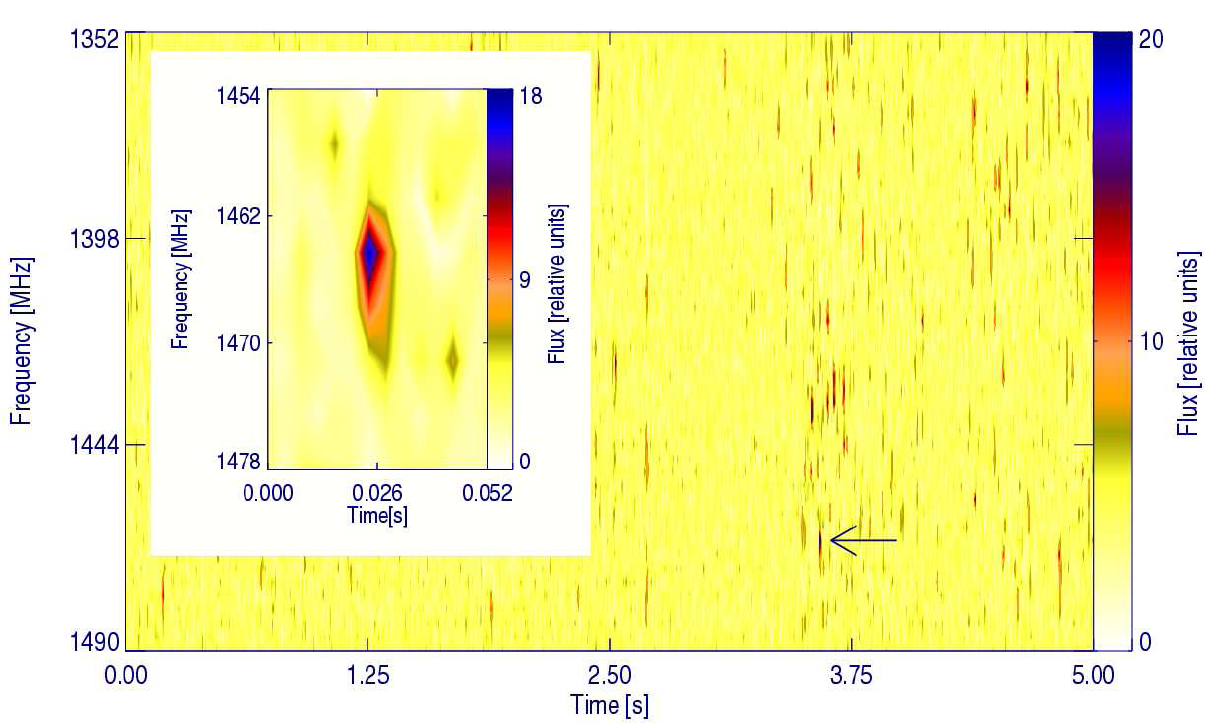
All recorded spikes have no internal structure. The main properties of the
spikes are presented in Table 2. The emission of the all groups of the spikes
occurred during the X1.0 class solar flare, which started at 12:12 UT and
reached the maximum at 13:10 UT in the NOAA 9077 active region (N18E27) of
magnetic type
![]() (see Fig.2). The first two groups of spikes
occurred after the maximum of this flare, the other during its gradual phase.
The images of the active region taken with the SXT/Be119 telescope after
13:06 UT show a Y-type interaction of the magnetic loops (see Fig.25).
(see Fig.2). The first two groups of spikes
occurred after the maximum of this flare, the other during its gradual phase.
The images of the active region taken with the SXT/Be119 telescope after
13:06 UT show a Y-type interaction of the magnetic loops (see Fig.25).
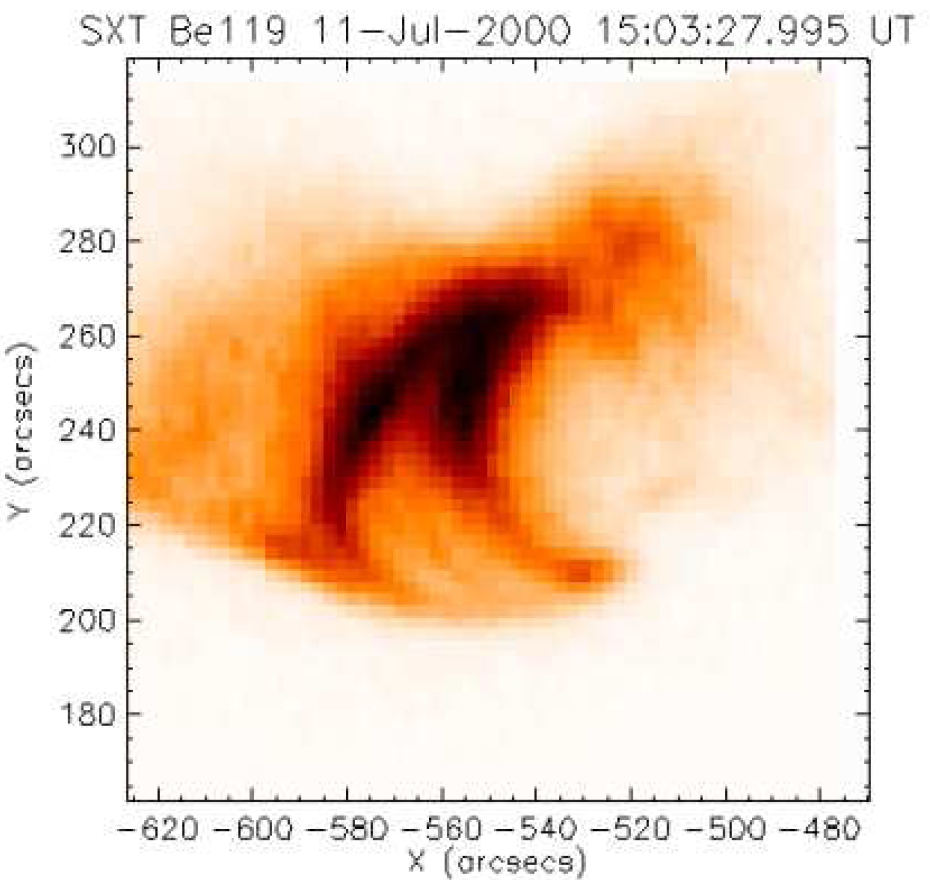
These
loops probably form the main region of energy release of the flare. The maximum
of the temperature of the plasma T=19.2 MK occurred at 12:16 UT, while the
maximum of the emission measure EM=1.1×1050
cm-3 at 13:17 UT (both values are evaluated using GOES
data). Very likely the first, third and fourth groups of spikes were emitted
from this active region. An identification of the source of the second group of
spikes is problematic, while this group of spikes (recorded between about
13:26:30 UT and 13:27:37 UT) is well correlated in time with an SF
class
![]() flare, observed between 13:25 UT and 13:29 UT in the NOAA 9069 active region
(S17W39) of magnetic type
flare, observed between 13:25 UT and 13:29 UT in the NOAA 9069 active region
(S17W39) of magnetic type![]() .
.
The radio event started at 12:47:25 UT, reached a maximum at 12:47:27 UT and
ended at 12:47:45 UT. The radio spikes were recorded between 12:47:25 UT and
12:47:39 UT (see Fig.26), during the gradual phase of the C2.3 class solar flare
(start at 12:13 UT, maximum at 12:27 UT) in the NOAA 9455 active region (S15W15)
of magnetic type![]() (see Fig.2). We have recorded both types of
spikes: with and without internal structure. The maximum of the temperature of
the plasma T=10 MK occurred at 12:22 UT, while the maximum of the emission
measure EM=3.6×1048 cm-3 at 12:29 UT (both values are evaluated using GOES data). UV
images of the active region taken with the TRACE telescope in the 171 Å
band show numerous interactions between two systems of magnetic loops of
different length as well as some ejections of the plasma along the long loops
heading outside the region of interactions. The ejections were co-temporal with
the emission of the dm radio spikes (see Fig.27).
(see Fig.2). We have recorded both types of
spikes: with and without internal structure. The maximum of the temperature of
the plasma T=10 MK occurred at 12:22 UT, while the maximum of the emission
measure EM=3.6×1048 cm-3 at 12:29 UT (both values are evaluated using GOES data). UV
images of the active region taken with the TRACE telescope in the 171 Å
band show numerous interactions between two systems of magnetic loops of
different length as well as some ejections of the plasma along the long loops
heading outside the region of interactions. The ejections were co-temporal with
the emission of the dm radio spikes (see Fig.27).
In this paper we have described thirteen event, in which we recognized eighteen
groups of dm radio spike emission, composed of various numbers of individual
spikes of various characteristics. The data were collected during 1990.4 hours
of observations in 357 observing days between February 2000 and December 2001.
Using X-ray data taken with Yohkoh, GOES and Interball
satellites, UV data taken with TRACE and SOHO
satellites and ground based observations made in the
Eleven groups of spikes were emitted during the increasing phase of the solar
flares, two groups were emitted during the peak of the flares and five groups
were observed during the gradual phase of the flares (according to the GOES
flux curves for the 1-8 Å band). Using the Yohkoh/HXT flux curves made in
L and M1 channels, we found that six of eleven groups of spikes observed during
the increasing phases undoubtedly occurred during the impulsive phase of the
relevant flare. Five groups of dm radio spike emission were correlated in time
with slow increases of the X-ray flux, leading to the solar flare. Using the
GOES
database, we found that no more than 2% of the solar flares were associated with
radio spikes. However, probably all spikes are emitted as a result of some
process connected with solar flares.
The analysis of the available observing materials shows that the emission of the
dm radio spikes can be initiated in various configurations of the interacting
magnetic fields and can be connected with various interactions between plasma
and magnetic fields: interactions of the magnetic loops of Y and I
configurations, bulk motions (ejections) of the plasma along long magnetic loops
as well as rebuilding of the arcade of loops.
On the dynamic radiospectrograms of the investigated events we have found two
kinds of well outlined structures formed by groups of individual spikes: chains
of spikes and the different structures referred to as "columns". The columns of
spikes are formed by numerous individual spikes, emitted in a very short time
range on various frequency in a whole observed band. In a frame of the column
each individual spike can show its own positive (i.e. from low to high) or
negative (i.e. from high to low) drift in frequency. The clear differences of
the temporal evolution between chains and columns of spikes can be attributed to
the differences in the structure of the radio sources.
We have evaluated the main observational parameters of the 5328 individual dm
radio spikes. The shortest observed spike lasted 0.0026 s only, the longest one
0.284 s. The distribution of the spike durations is right-skewed with skewness
equal to 1.64, its median is equal to 0.029 s, the mean is 0.036 s. 5165 spikes
(97%) were shorter than 0.1 s, fulfilling the commonly accepted upper limit on
spike duration. The presented durations of the spikes are much longer than mean
duration of the spikes, equal to 10 ms, estimated for the same frequency band by
Güdel and Benz (1990), and also are longer than the 10 ms mean duration of the
spikes observed by Mészárosová et al. (2003). The differences cannot be
attributed to the limited temporal resolution of the collected data.
Thanks to the very high temporal resolution of the radiospectrograph used, we
have found numerous individual dm radio emissions with visible subtle structure
of the time-frequency distribution of the emission intensity; their dynamic
spectrograms are strongly heterogeneous and fragmented. We have found that in a
frame of the single radio event all emitted dm radio spikes are rather similar.
Nevertheless, both types of spikes (with or without internal structure) can be
emitted in the same event. Each spike has its own positive (i.e. from low to
high) or negative (i.e. from high to low) drift in frequency of various speed
(from tens of MHz per second up to greater than the highest measurable with our
instrument, equal to 37.5 GHz per second). If these emissions are genuine,
individual spikes with real internal subtle structure or if they are in fact
very short lasting chains of tightly packed spikes with fast drifts in frequency
should be addressed by future investigations.
The distribution of the durations of the 1699 spikes without internal structure
shorter than 0.1 s is right-skewed with skewness equal to 1.86, its median is
equal to 0.024 s and its mean is equal to 0.029 s. The distribution of durations
of the 1837 spikes with internal structure shorter than 0.1 s is close to
Gaussian (skewness equal to 0.12) with the median equal to 0.047 s and the mean
equal to 0.046 s. The relative widths in frequency of these emissions are
similar to the parameters of the "classical" spikes without internal structure.
Taking into account all 13 events, seven events have a majority of spikes with
negative drifts, five events have almost the same numbers of spikes with
positive and negative drifts. 2769 spikes (52%) have negative drifts, 760 (14%)
have positive drifts, the remaining spikes (1799) have immeasurable drifts. The
drifts of the spikes with internal structure are distinctly slower than ones
without structure.
The more extended results of the statistical investigation of the whole
population of spikes as well as the properties of the individual spikes will be
published in a separate paper (in preparation).
We are grateful to Dr G.D. Fleishman for many helpful remarks and comments
during the writing of the paper. PR and MS were supported by the Polish State
Committee for Scientific Research (KBN) grant number PBZ KBN 054/P03/2001, RF
was supported by the KBN grant number 2 PO3D 001 23.
![]() hydrogen line we have identified the most likely active solar phenomena related
to each radio event with spikes as well as investigating the main morphological
properties and evolution of the spikes.
hydrogen line we have identified the most likely active solar phenomena related
to each radio event with spikes as well as investigating the main morphological
properties and evolution of the spikes.