Solar Physics
|
J. Sylwester, I. Gaicki, Z. Kordylewski, M. Kowaliński, S. Nowak, S. Płocieniak, M. Siarkowski, B. Sylwester, W. Trzebiński, J. Bąkała
Space Research Centre, Polish Academy of Sciences, 51-622, Kopernika 11, Wrocław, Poland.
J. L. Culhane, M. Whyndham, R. D. Bentley, P. R. Guttridge
Mullard Space Science Laboratory, University College London,Holmbury St. Mary, Dorking, Surrey RH5 6NT, U.K.
K. J. H. Phillips
National Research Council Senior Research Associate, Code 682, NASA Goddard Space Flight Center, Greenbelt, MD 20771, U.S.A.
J. Lang
Space Science and Technology Dept., Rutherford Appleton Laboratory,Chilton, Didcot, Oxon. OX11 0QX, U.K.
C. M. Brown, G. A. Doschek
E. O. Hulburt Center for Space Research, Code 7670,Naval Research Laboratory, Washington, DC 20375-5352, U.S.A.
V. D. Kuznetsov, V. N. Oraevsky, A. I. Stepanov, D. V. Lisin
Institute of Terrestrial Magnetism and Radiowave Propagation (IZMIRAN),Troitsk, Moscow Region, Russia
Flares and active regions are observed in the corona as highly enhanced regions of soft X-ray emission, and are commonly believed to be powered by the release of energy stored in magnetic fields. Understanding the physical mechanisms behind this energy transformation represents one of the most challenging problems of astrophysics. In the past 40 years it has become clear that progress can best be made with the aid of observations in all parts of the electromagnetic spectrum. Spectrometers operating in the soft X-ray region provide valuable information about the temperature, ionization state, and any nonthermal and directed velocities of the emitting plasma. Among these are the scanning, flat crystal spectrometers on the early NASA Orbiting Solar Observatories, the U.S. Navy P78-1 satellite, NASA's Solar Maximum Mission or SMM (the X-ray Polychromator/Flat Crystal Spectrometer), and the Japanese Hinotori spacecraft. Because of the length of time needed to scan particular portions of the X-ray spectrum, critical phases of flares were often missed with these spectrometers. Curved crystal spectrometers like the SMM Bent Crystal Spectrometer and the Bragg Crystal Spectrometer (BCS) on the Japanese Yohkoh spacecraft (Culhane et al., 1991) have an important advantage in this respect since they are designed to take complete spectra, generally over limited wavelength bands, over time intervals of only a few seconds. With strong emission lines like the resonance lines of highly ionized Ca and Fe, formed at high temperatures, spectral changes and thus information about physical conditions during the rapid development of particularly flares can be followed (Antonucci, 1989).
The REntgenovsky Spektrometrs Izognutymi Kristalami (RESIK) bent crystal X-ray spectrometer on the Russian CORONAS-F solar spacecraft has been operating since spacecraft launch on 2001 July 31. Its wavelength coverage, 3.3 Å - 6.1 Å, has been very little explored by previous solar spacecraft. Spectra from solar flares seen by RESIK include strong emission lines of highly ionized Si, S, and Ar atoms, together with lines from the low-abundance, odd-Z elements K and Cl. Some of these lines are also seen in the spectra of bright, non-flaring active regions, and several lines have been observed for the first time in solar X-ray spectra. Brief descriptions of RESIK and initial observations are given by Sylwester et al., (2002), Sylwester et al., (2003), and Phillips et al., (2003). In this paper, we describe the CORONAS-F spacecraft (Section 2) and give more details about RESIK including its scientific objectives (Section 3), its concept, design and calibration (Section 4), and initial results (Section 5).
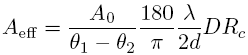
Figure 1: Left: The Cyclone SL-14 rocket on the launch pad at the Plesetsk Cosmodrome, northern Russia, on the morning of the launch, 2001 July 31. Centre: The Cyclone rocket shortly after launch. Right: The instrument payload of CORONAS-F: the spacecraft is ~ 1.5 m in diameter and weighs ~ 2.5 tonnes. See Figure 3 for location of the RESIK instrument.
The CORONAS-F spacecraft (Figure 1) is the second of two Russian space
observatories devoted to solar and magnetospheric physics, designed to be operational
during the 23rd solar cycle. Its primary objectives are the study of solar
global oscillations, variations in the solar ultraviolet radiation, flare and active
region X-ray, gamma-ray, and particle emission. Its launch, on 2001 July 31, followed
the launch of the Coronas-I spacecraft in 1994 March which was intended to observe
the Sun at solar minimum (Lebedev et al., 1995). Among the thirteen instruments on
board CORONAS-F are the two soft X-ray high-resolution spectrometers
Diogeness and RESIK, built by teams led by the Space Research Centre, Polish
Academy of Sciences, Wrocaw, Poland. The Diogeness spectrometer uses scanning
flat crystals to cover the wavelength ranges 2.83 Å - 3.36 Å, 4.98 Å - 5.30 Å,
and 6.15 Å - 6.74 Å. The eleven Russian instruments, mostly built by groups at
IZMIRAN (Troitsk), the Lebedev Physical Institute (FIAN) and other Russian
Institutes include the RES-C spectropolarimeter, which obtains images of the Sun
in X-ray emission lines due to He-like Fe (Fe XXV) and H-like Mg (Mg
XII) as well as two XUV bands (around 200 Å and 300 Å);
the Soft X-ray Telescope (SRT), which observes the Sun in narrow XUV bands
centred on 171 Å (Fe IX, Fe
X), 195 Å (Fe XII), 304 Å (He II) among others; the Solar Spectropolarimeter (SPR), observing
polarization in 20 - 100 keV X-rays. These three instruments make up the so-called
SPIRIT group. The remaining instruments are an X-ray Flare Spectrometer (IRIS), observing
2 - 200 keV flare X-rays, a hard X-ray and gamma-ray spectrometer (HELICON), observing
in the energy range 10 keV - 10 MeV; a Solar Ultraviolet Spectrophotometer (VUSS),
observing the hydrogen
![]() line at 1216 Å; Solar Cosmic Rays Complex (SKL) which comprises a cosmic ray
monitor (MKL); and other monitoring instruments operating in the ultraviolet,
X-rays and gamma-rays. The payload carries also instruments sensing the
immediate particle environment. Further details about the instruments and data
acquisition are given by Oraevsky and Sobelman (2002) and may be found on the
web site
http://coronas.izmiran.rssi.ru/F/.
line at 1216 Å; Solar Cosmic Rays Complex (SKL) which comprises a cosmic ray
monitor (MKL); and other monitoring instruments operating in the ultraviolet,
X-rays and gamma-rays. The payload carries also instruments sensing the
immediate particle environment. Further details about the instruments and data
acquisition are given by Oraevsky and Sobelman (2002) and may be found on the
web site
http://coronas.izmiran.rssi.ru/F/.
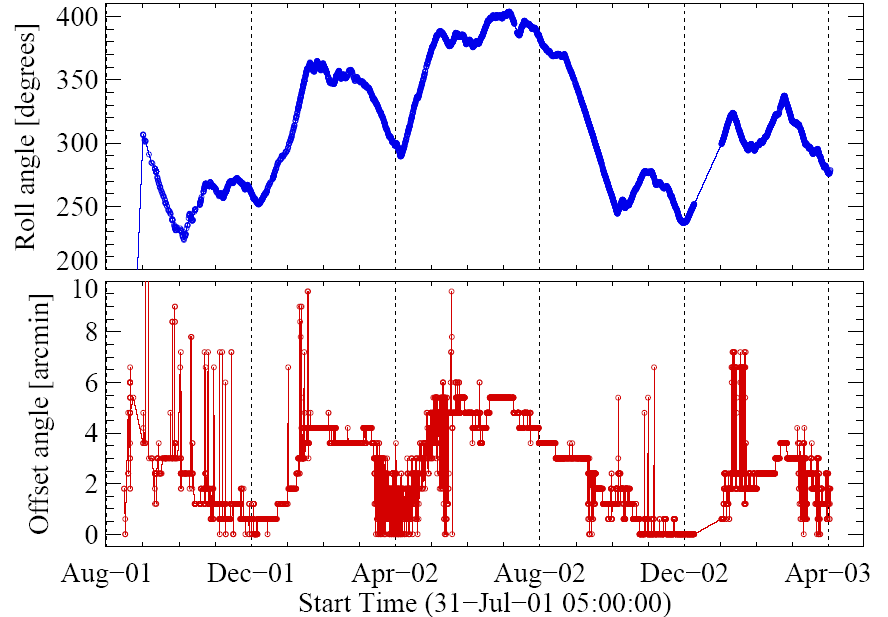
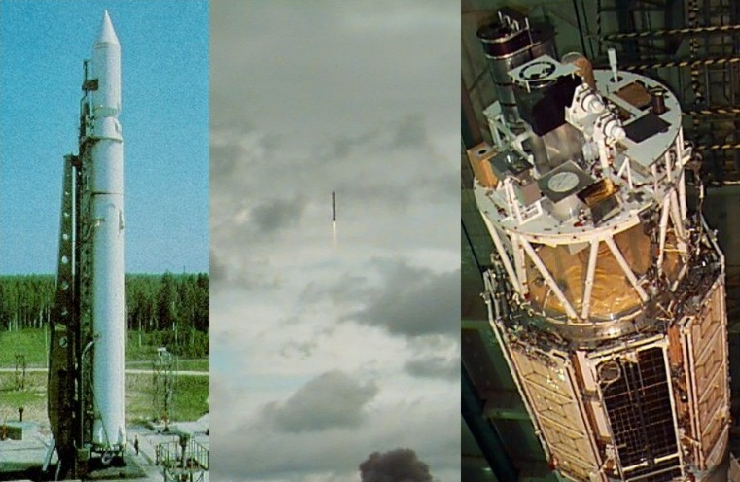
Figure 2: Top Panel: Variations in the CORONAS-F spacecraft roll angle for the period 2001 August 1 to 2003 April 30. The rate of variations of the roll angle, which is a measure of the dispersion direction of the RESIK instrument, is never more than 1° per day. Bottom Panel: Offset of the spacecraft z-axis measured from Sun centre for the same period of time. (Courtesy of SPIRIT Team, FIAN, Moscow.)
The CORONAS-F spacecraft is in a near-circular orbit around the Earth with an altitude ranging from 501 km and 549 km, and an orbital plane inclined at 82.5° to the equator; its orbital period is 94.9 minutes. The near-polar orbit allows periods of uninterrupted observation of the Sun for up to about 20 days: the longest satellite night lasts 35 minutes. Passages through the Earth's radiation belts require the X-ray instruments to be turned off; these include passages through the South Atlantic Anomaly (SAA) as well as the auroral oval (AO) regions near the magnetic poles.
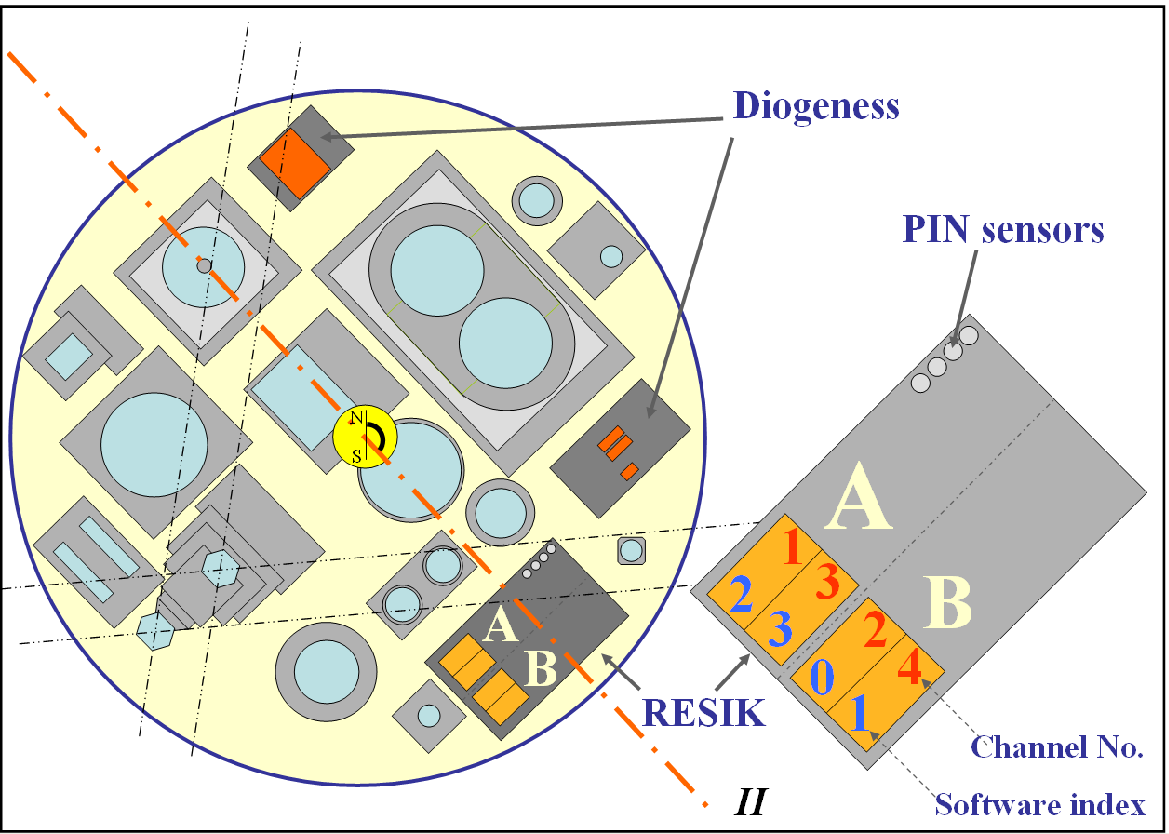
Figure 3: Left: Scheme of instruments' placement within the CORONAS-F payload as seen from the Sun. The main axis ( II) is indicated together with roll angle readout convention. Darker shades indicate components of RESIK and Diogeness. Right: is an enlargement of the RESIK instrument, showing the disposition of spectrometers A and B and channel numbers (1 - 4), as used in the tables and figures here, and corresponding software indices (0 - 3) used in the instrument testing and preparation. Placement of the four radiation environment PIN sensors is also indicated.
The spacecraft is controlled from the Flight Control Centre, Cosmic Information Technology Centre, IZMIRAN. Commands and uploads are sent daily from the tracking station at Neustrelitz, Germany. Updates can be received as little as 10 minutes before ground station contact. The operational lifetime of the satellite is expected to extend till 2007 when the spacecraft will enter the Earth's atmosphere. The satellite is stabilized such that its z-axis points to within 10 arcminutes of Sun centre with a roll stability of 3 arcsec s-1. The roll angle may, however, assume any direction. Information about the roll angle for any given time, which is of importance for the RESIK instrument, is made available to the instrument groups by the SPIRIT team at the Lebedev Physical Institute. Figure 2 shows the time variations of the roll angle and offset of the spacecraft z-axis from Sun centre in the first 21 months of spacecraft operations.
The dispersion planes of both Polish spectrometers are coaligned and perpendicular to the main spacecraft axis (line II, indicated in Figure 3). The position of this axis is indicated by arrow on each page of the RESIK catalogue (see Figure 6, upper right corner).
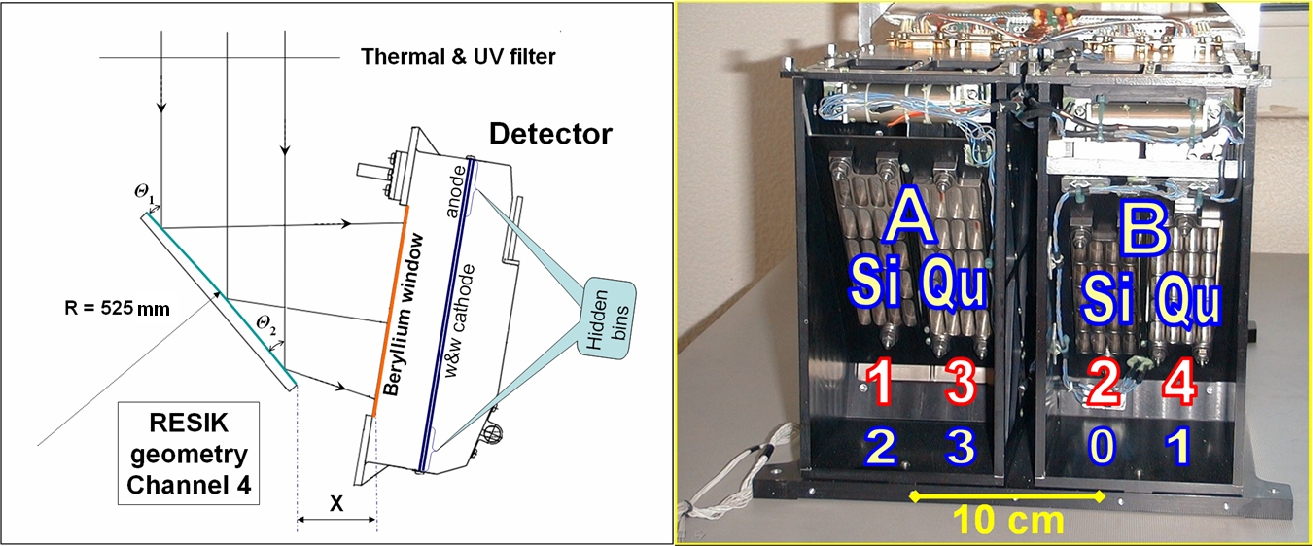
Figure 4: Left: Scheme of one of the four similar
spectrometer sections making up the RESIK payload as seen from the
side. The crystals are bent to cylindrical profiles (radius R is
indicated), such that there is a slight change of incidence angle
over the crystal surface
![]() . The distance
X indicated is the basic reference distance between the
crystal edge and the edge of the detector Be window. Right:
Annotated photograph showing the back side of the crystal supports
with the disposition of spectrometers A and B, crystal material
and channel numbers (1 - 4), assigned in order of wavelength and
used in the tables and figures here. The corresponding software
indices (numbers, 0 - 3) used for the engineering purposes are
shown for the reference.
. The distance
X indicated is the basic reference distance between the
crystal edge and the edge of the detector Be window. Right:
Annotated photograph showing the back side of the crystal supports
with the disposition of spectrometers A and B, crystal material
and channel numbers (1 - 4), assigned in order of wavelength and
used in the tables and figures here. The corresponding software
indices (numbers, 0 - 3) used for the engineering purposes are
shown for the reference.
The two primary scientific objectives of the RESIK instrument are to determine:
The importance of the first objective has become evident in the
past ten years with the discovery that the abundances of elements
in coronal active regions and flares are different from those in
the photosphere depending on the value of the first ionization
potential (FIP) of the element (Meyer, 1985; Feldman and
Laming, 2000). Measurements from X-ray and extreme ultraviolet
emission lines indicate that elements with FIPs
![]() 10 eV
are more abundant in the corona than in the photosphere by factors
of 3 or 4. Those with FIPs > 10 eV have coronal abundances
approximately equal to photospheric values (Feldman and
Laming, 2000), though some observations suggest that they are less
than photospheric by a factor of 2 (Fludra and Schmelz, 1999). It
is possible that element abundances vary with time during flares
(Sylwester, Lemen and Mewe, 1984) and also that the X-ray-emitting
coronal plasmas of very short-lived, impulsive flares have
photospheric abundances (Feldman and Laming, 2000).
10 eV
are more abundant in the corona than in the photosphere by factors
of 3 or 4. Those with FIPs > 10 eV have coronal abundances
approximately equal to photospheric values (Feldman and
Laming, 2000), though some observations suggest that they are less
than photospheric by a factor of 2 (Fludra and Schmelz, 1999). It
is possible that element abundances vary with time during flares
(Sylwester, Lemen and Mewe, 1984) and also that the X-ray-emitting
coronal plasmas of very short-lived, impulsive flares have
photospheric abundances (Feldman and Laming, 2000).
The wavelength coverage of RESIK, 3.3 Å - 6.1 Å, is ideal for studying the abundances of a wide variety of elements with both low and high values of FIP. Tables II and III and Figure 13 show principal features identified as lines in spectra from a flare on 2003 January 21 (GOES class M1.9). (Channel numbers used here are those assigned in order of wavelength, though for software purposes an alternative scheme is used: see Figure 3). Emission lines of Ar (FIP = 15.8 eV), S (FIP = 10.4 eV), and Si (FIP = 8.2 eV) are identifiable, some of which are very strong. Weaker line emission due to K, having the lowest FIP (4.3 eV) of any cosmically abundant element, and Cl (FIP = 13.0 eV) is also visible. Two of the channels (1 and 2) of RESIK observe continuum emission without appreciable instrumental contamination (due to fluorescence, see Section 4.7), so enabling absolute element abundances, i.e. with respect to hydrogen, to be determined. The instrument sensitivity is considered to be quite accurate, with the absolute accuracy better than ~ 15% (for discussion see Section 4.5). Therefore it appears that fairly precise abundance determinations are possible.
The wavelength range of RESIK contains several lines whose
relative intensities are temperature-sensitive, so fulfilling the
second objective. These include lines in the He-like Si (Si
XII) sequence 1s2 - 1snp (n=3, 4, 5) and the intensities of
any of these lines or their sum relative to the intensity of the
1s-3p
![]() line of H-like Si depend on the ionisation
state of the plasma. All these lines are seen in channel 4 of
RESIK. In addition, lines of He-like S (S XV), 1s2-1snp
(n=3, 4, 5) are present in channel 3 spectra, the intensities of
which are significantly different in their temperature dependence.
A prominent feature of even small flares is the triplet of lines
due to 1s2-1s2l (l=s, p) of He-like Ar (Ar XVII) which, for a plasma in equilibrium, are also sensitive to Te
through the so-called G ratio (Pradhan, 1985). Another
temperature-dependent line ratio is that of dielectronic
satellites to the Si XIII 1s2 1S0 - 1s3p 1P1 line at 5.68 Å. RESIK observations
indicate that the Si
XII dielectronic satellite line (at 5.82 Å, mostly due to
1s2 2p 2P3/2-1s2p(3P)3p 2D5/2) is strong relative to
the 5.681 Å line during non-flaring periods, but weak otherwise, showing its
temperature dependence (Sylwester et al., 2003). These satellites appear to have
been little used for application to solar flare spectra. Atomic
data for their intensities (Chen, 1986; Dubau, 2004) have been
used in a preliminary analysis of the temperaure dependence of
these lines (Phillips et al., 2004).
line of H-like Si depend on the ionisation
state of the plasma. All these lines are seen in channel 4 of
RESIK. In addition, lines of He-like S (S XV), 1s2-1snp
(n=3, 4, 5) are present in channel 3 spectra, the intensities of
which are significantly different in their temperature dependence.
A prominent feature of even small flares is the triplet of lines
due to 1s2-1s2l (l=s, p) of He-like Ar (Ar XVII) which, for a plasma in equilibrium, are also sensitive to Te
through the so-called G ratio (Pradhan, 1985). Another
temperature-dependent line ratio is that of dielectronic
satellites to the Si XIII 1s2 1S0 - 1s3p 1P1 line at 5.68 Å. RESIK observations
indicate that the Si
XII dielectronic satellite line (at 5.82 Å, mostly due to
1s2 2p 2P3/2-1s2p(3P)3p 2D5/2) is strong relative to
the 5.681 Å line during non-flaring periods, but weak otherwise, showing its
temperature dependence (Sylwester et al., 2003). These satellites appear to have
been little used for application to solar flare spectra. Atomic
data for their intensities (Chen, 1986; Dubau, 2004) have been
used in a preliminary analysis of the temperaure dependence of
these lines (Phillips et al., 2004).
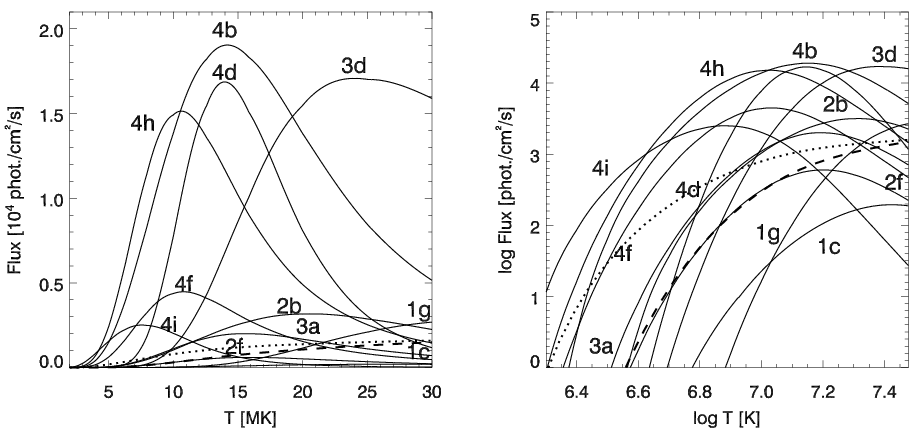
Figure 5: Calculated (Young et al., 2003: CHIANTI) emission functions for the stronger lines observed by RESIK on linear (left) and logarithmic (right) scales. For potassium lines, interpolated values are given as derived from Kępa and Sylwester, (2004). Coronal composition has been adopted and the emission measure EM=1048 cm-3 assumed. In case of the continuum flux calculations (dashed line, at 3.5 Å; dotted line at 6.0 Å), the width of the continuum narrow band D(l) has been assumed to be twice the line width given as wavelength resolution in Table I.
In Figure 5, the emission functions characterizing the temperature dependence of photon flux at the spacecraft are plotted for the stronger lines seen by RESIK. The temperatures of maximum line emission are given in Tables II and III.
RESIK has a number of subsidiary scientific objectives. For example, ionization fractions from solar X-ray line intensities may be empirically determined, so verifying ionization equilibrium calculations which involve a large amount of atomic data whose accuracy cannot be readily checked by other means. RESIK observations of line emission during long-duration flares or non-flaring active regions should be useful in this respect. It may also be possible to use RESIK to search for non-equilibrium conditions through line ratios.
The RESIK instrument consists of two spectrometers (A and
B) including front end electronics located in the open
vacuum of space, and an electronics box including the instrument
microprocessor located in a pressurized section of the spacecraft.
Thermal filters (one for each spectrometer) prevent direct solar
heat from entering the instrument. Diffraction occurs according to
the Bragg law,![]() , where n is
the diffraction order (1, 2, or 3),
, where n is
the diffraction order (1, 2, or 3),
![]() the wavelength of
incident radiation, d the crystal lattice spacing, and
the wavelength of
incident radiation, d the crystal lattice spacing, and
![]() the angle of incidence. Silicon and Quartz, the crystal materials,
with low atomic numbers, were chosen to reduce fluorescence of the
crystals by solar X-rays (fluorescence yield is approximately
proportional to Z4) as much as possible. Fluorescence emission
from the crystals forms a background to the spectra which for
channels 1 and 2 is mostly insignificant. In channels 3 and 4 the
fluorescence contribution can be accurately estimated
(Section 4.7). This allows line-to-continuum intensity ratios (and
therefore absolute element abundances) to be derived. In this
respect, RESIK has an important advantage over the Yohkoh
BCS which uses germanium (Z=32) crystal with large fluorescence
yield. The crystals were prepared, mounted, and characterized at
the U.S. National Institute of Standards and Technology (NIST).
X-rays diffracted from the crystals are detected by
one-dimensional position-sensitive sealed proportional counters
like those used for the Yohkoh BCS. A single detector is
used for each spectrometer, i.e. there is one detector for two
spectral channels. Each channel forms half of one detector, which
is electrically separated from the other channel by a cathode
screen of grounded wires and has a pair of anode wires connected
to a pre-amplifier. A high-voltage unit (HVU) supplies the
necessary voltage (1.5 kV) to the anode wires. Position encoding
is implemented using a lookup table, the position being given by
the ratio of one of the cathode signals to the total signal. The
data are binned into 256 bins for each detector and are passed to
an accumulator which stores data on one buffer and simultaneously
writes the data to telemetry. An 55Fe source on a movable arm
(the only movable part of the instrument) allows on-board
calibration of the detectors. These calibrations, performed many
times since spacecraft launch, allowed us to confirm that detector
gain did not appreciably change over the period of operations.
the angle of incidence. Silicon and Quartz, the crystal materials,
with low atomic numbers, were chosen to reduce fluorescence of the
crystals by solar X-rays (fluorescence yield is approximately
proportional to Z4) as much as possible. Fluorescence emission
from the crystals forms a background to the spectra which for
channels 1 and 2 is mostly insignificant. In channels 3 and 4 the
fluorescence contribution can be accurately estimated
(Section 4.7). This allows line-to-continuum intensity ratios (and
therefore absolute element abundances) to be derived. In this
respect, RESIK has an important advantage over the Yohkoh
BCS which uses germanium (Z=32) crystal with large fluorescence
yield. The crystals were prepared, mounted, and characterized at
the U.S. National Institute of Standards and Technology (NIST).
X-rays diffracted from the crystals are detected by
one-dimensional position-sensitive sealed proportional counters
like those used for the Yohkoh BCS. A single detector is
used for each spectrometer, i.e. there is one detector for two
spectral channels. Each channel forms half of one detector, which
is electrically separated from the other channel by a cathode
screen of grounded wires and has a pair of anode wires connected
to a pre-amplifier. A high-voltage unit (HVU) supplies the
necessary voltage (1.5 kV) to the anode wires. Position encoding
is implemented using a lookup table, the position being given by
the ratio of one of the cathode signals to the total signal. The
data are binned into 256 bins for each detector and are passed to
an accumulator which stores data on one buffer and simultaneously
writes the data to telemetry. An 55Fe source on a movable arm
(the only movable part of the instrument) allows on-board
calibration of the detectors. These calibrations, performed many
times since spacecraft launch, allowed us to confirm that detector
gain did not appreciably change over the period of operations.
The detectors, HV units, and electronics processing cards are spare units from the
construction of the Yohkoh BCS. However, the RESIK spectrometer has significant
improvements over the BCS in that the high-Z fluorescence background is eliminated and
also there is capability to observe solar X-rays in diffraction orders higher than n=1.
This is achieved by appropriate adjustment of detector high voltages and discriminator
settings (ADS) of the pulse-height analyzers. Periods of several days were chosen during
2002 and 2003 for RESIK observations in third-order (n=3) diffraction. These periods
are indicated by colour codes on the RESIK Catalogue web pages
http://www.cbk.pan.wroc.pl/resik_catalogue.htm. As a result, significant line emission
was recorded during a number of flares at wavelengths ![]() (cf. Figure 14).
(cf. Figure 14).
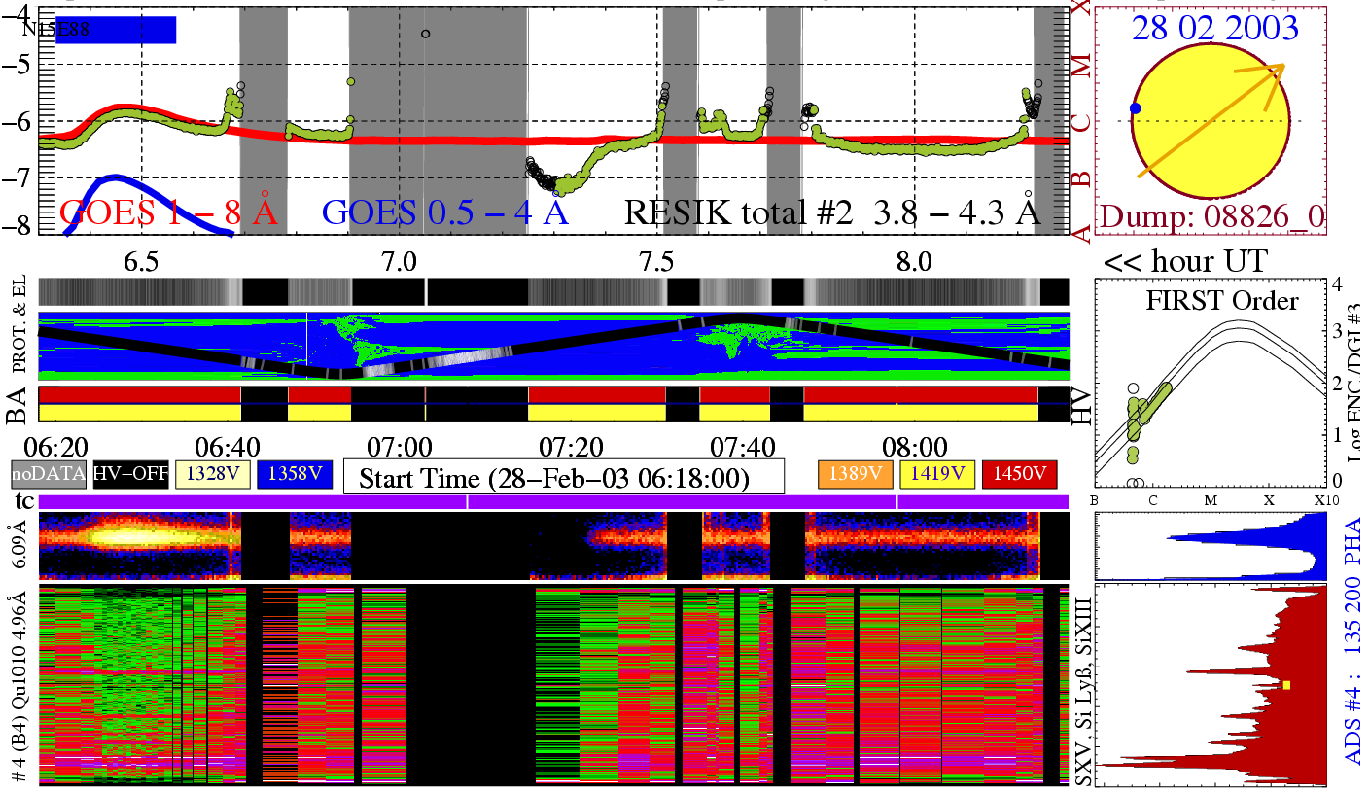
Figure 6: A portion of the RESIK Catalogue page available on line at the address http://www.cbk.pan.wroc.pl/resik_catalogue.htm. Many parameters are shown on the catalogue page including both the time resolved spectra and PHA records, orbital position, spacecraft environment (day - night), particle contamination, crystal temperatures etc. For details see description at the http://www.cbk.pan.wroc.pl/legend/legend_2003.htm.
In designing RESIK, instrument sensitivity was traded with wavelength coverage. A compromise was chosen in which the wavelength coverage was large enough to include many emission lines of interest for abundance and differential emission measure studies yet with RESIK having a sensitivity that greatly exceeds those of the scanning flat crystal spectrometers on SMM or the P78-1 spacecraft which covered the RESIK wavelength range. Instead of having a fixed data gathering interval (DGI) of e.g. a few seconds, resulting in only a few hundred counts over the 1024 spectral bins, the on-board software was designed so that the DGI was dynamically determined by the on-board computer according to the level of solar X-ray emission in order to maintain count statistics. Thus, for the rise to a large flare, the DGI decreased from 5 minutes to only 1 s at flare maximum. An example of such observations with changing DGI is illustrated in Figure 6.
In order to increase the instrument sensitivity still further, RESIK has no collimator, so resembles the Yohkoh BCS (but not the Bent Crystal Spectrometer on Solar Maximum Mission which had a 6 arcminute FWHM collimator). This means that flares occurring anywhere on the Sun give rise to line emission in the detectors. There is consequently ambiguity along the dispersion direction whenever two or more flares occur simultaneously; however, this has been found to be an infrequent occurrence. The optical axis of RESIK is co-aligned with the spacecraft axis to high accuracy, achieved in pre-launch alignment tests. Thus the nominal wavelength ranges of the four detectors are slightly extended if a flare is considerably off-axis. Thus, the Ar XVII 1s2 1S0 - 1s3p 1,3P1 lines at 3.36 Å, normally shorter than the lower wavelength limit of channel 1, are occasionally visible within that detector's range. Also, because of the variety of flare dispositions on the Sun, the S XV 1s2 1S0 - 1s3p 1P1 line at 4.30 Å is sometimes visible at channel's 2 long-wavelength end, other times at channel's 3 short-wavelength end (see Table II).
Because of the high sensitivity of RESIK, large flares (GOES class X1 or greater) are liable to produce very high count rates and the detector's position encoding electronics saturate, producing distorted spectral information. The cathode electronics, having the longest time constant ( ~ 35 ms), are most affected. The RESIK detectors do not have line "narrowing" effects present for the Yohkoh BCS, whereby at high count rates emission line profiles are higher and narrower than usual (Trow et al., 1994), but a small lowering of the PHA gain is observed for X-class flares.
Table I lists relevant parameters of the RESIK instrument. The channel numbering follows that of previous publications, though for pre-launch testing and software purposes a different scheme is used (see Figures 3, 4). Extreme wavelength ranges are for sources, observed off-axis by ~ 20 arcmin from disc centre. Values of dispersion, effective area, and wavelength resolution are given for mid-channel wavelengths.
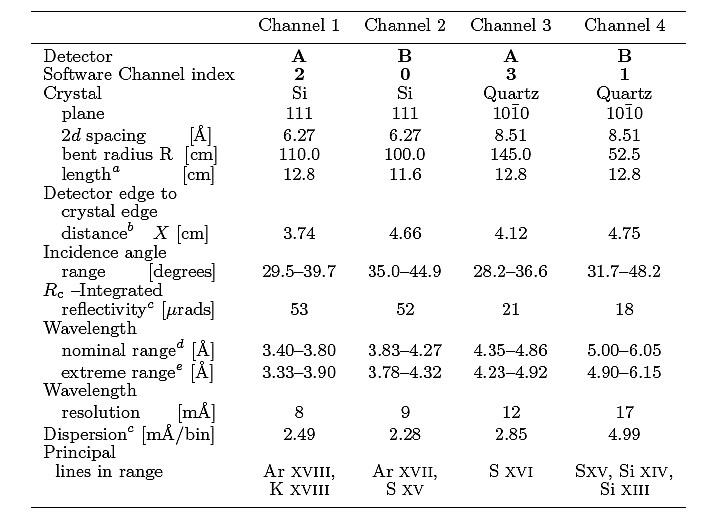
length illuminates the detector window for a source with given offset.
b Minimum distance between the detector and crystal, normal to the
direction to source (X in Figure 4).
c Reflectivity and dispersion values are given for the first order reflections
and mid-channel wavelengths (see Figure 8).
d Nominal wavelength ranges are those recorded at all times, independent
of the source offset.
e Extreme wavelength ranges are those seen for sources with largest offsets.
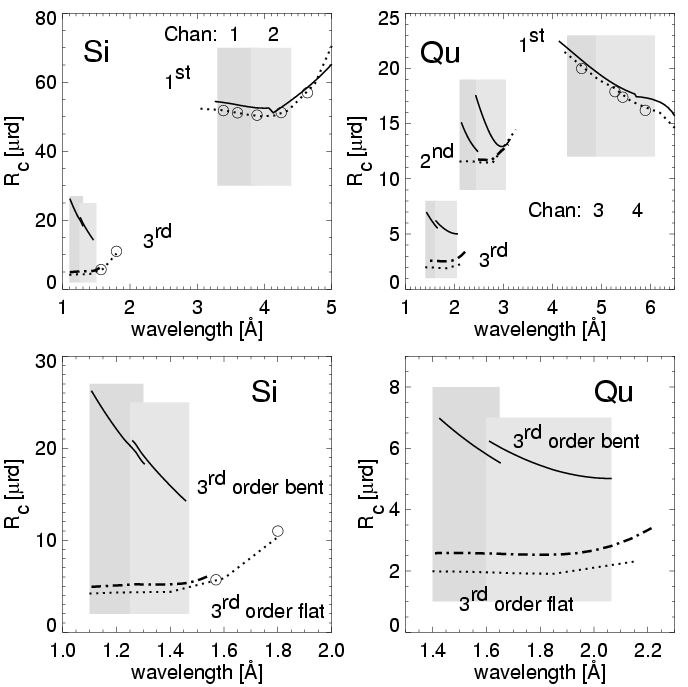
Figure 7: Calculated integrated reflectivities of RESIK crystals in first, second, and third reflection orders. Note that second order (222) reflections are forbidden for silicon crystals. Results from Brennan and Cowan (1992) code (open circles) are overplotted on the dotted line showing results obtained from Stepanov code (Lugovskaya and Stepanov, 1991). Continuous line represents the XOP calculations (Dejus and Rio, 1996) made for the crystal bent according to RESIK specifications, while dot - dashed lines represent the XOP results at the "flat crystal" limit. See the text for discussion.
Instrument sensitivity or equivalently the effective area is an important quantity for the determination of emission measures, interpretation of ratios of line between channels, DEM determinations, and cross-calibration studies with other instruments such as the Yohkoh BCS and RHESSI. For a bent crystal spectrometer, the effective area is given by Rapley et al., (1977).
|
|
(1) |
where A0 is the crystal geometrical area, D the
detector efficiency, Rc the crystal integrated reflectivity
(radians), and
![]() and
and
![]() the Bragg angles at each
end of each crystal. The detector efficiency was calculated using
the following construction details:
the Bragg angles at each
end of each crystal. The detector efficiency was calculated using
the following construction details:
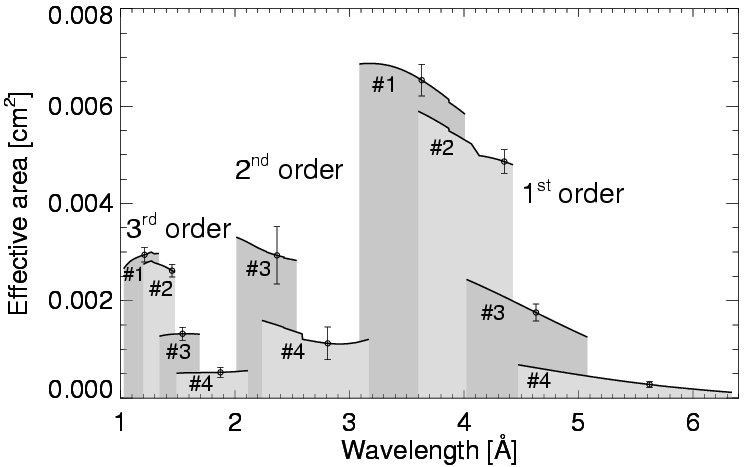
Figure 8: The calculated effective area of all RESIK channels, in all available orders of reflection, shown as a function of wavelength. The default observing mode (1st order) covers the range 3.25 Å to 6.15 Å. Same shades represents common detectors: lighter - detector A, darker - detector B.
The problem of obtaining accurate values for crystal reflectivities is the most difficult in the instrument calibration. End-to-end RESIK tests carried out at Rutherford Appleton Laboratory and Mullard Space Science Laboratory over a 3-month period in 2000 allowed measurements of the crystal reflectivities. In these tests, a vacuum chamber previously used for the calibration of the Yohkoh BCS was used, but with an improved double crystal X-ray monochromator. However, these calibration data still await analysis. Meanwhile, crystal reflectivity data available from other sources were investigated. We made use of theoretical codes from the World Wide Web, though laboratory measurements of Rc for silicon or quartz crystals do not seem to be available. Among the theoretical codes are the early reflectivity calculation of Brennan and Cowan (1992) for selected wavelengths and reflection orders. We also accessed two independent crystal codes written by Lugovskaya and Stepanov (1991) and Dejus and Rio (the XOP code, 1996). All three codes provide Rc for flat crystals as a function of wavelength over the RESIK range of interest. However, only the XOP code permits calculation of crystal reflectivities in the case of bent crystals, as used in RESIK.
In Figure 7, we compare the three sets of calculations for integrated crystal
reflectivities. It can be seen from the figure that the results from the three
independent crystal codes agree well. The differences are within few percent for
the first order reflection. The same applies to results for third-order
reflection. We found that the results agree well in the case of flat crystals.
Bending quartz crystals increases the total reflectivity substantially for
second-order reflections below 3 Å (by up to 50%) and changes dramatically the
Rc for both silicon and quartz in
third order (by a factor of ~ 5). This causes the second-order quartz reflectivity to be similar to the
first-order reflectivity, something that was not expected in the RESIK design
phase. This is likely to lead to contamination of RESIK third-order spectra.
Investigations into this are in progress. It can be seen from Figure 7 that the
crystal reflectivities are large enough in second and third orders to measure
substantial line emission at short wavelengths
![]() in large flares, enabling high-temperature lines to be observed,
notably the group at 1.85 Å consisting of Fe XXV plus satellite lines. By combining calculated detector efficiencies and
crystal reflectivities, the instrument effective areas have been calculated according to
Eq. (1), using the construction data from Table I. The results are presented in Figure 8.
in large flares, enabling high-temperature lines to be observed,
notably the group at 1.85 Å consisting of Fe XXV plus satellite lines. By combining calculated detector efficiencies and
crystal reflectivities, the instrument effective areas have been calculated according to
Eq. (1), using the construction data from Table I. The results are presented in Figure 8.
The main feature of the detector is its one-dimensional position-sensitive readout. The detector is optimised for detection of X-rays in the 2 - 7 keV energy range, and for use in a space environment. It features low mass, small volume, low power consumption, and long life. Preamplifiers and test circuitry are mounted in a package on the rear of the detector. No gas supply system is required, as the detector is sealed permanently. The gas filling is an equal xenon - argon mixture with 5 % CO2 as a quench agent. The pressure of the gas filling is 1.2 atmospheres at 20°C. This mixture of gases was chosen to provide the required quantum efficiency, signal characteristics and ageing properties. The detectors are powered from external high voltage supplies made at Rutherford Appleton Laboratory, to establish the anode wire fields.
When a photon enters one of the detectors, it emits shaped analogue pulses which are further processed to yield the event positions. The detector has two anode channels so it is used to observe spectra diffracted from the two crystals simultaneously. The detector is essentially a hollow stainless steel rectangular box (see Figure 4), with a thin beryllium foil (125 mm), semi-transparent to X-rays forming one of the larger faces. Thin metal wires are suspended along the centre of the box, and high voltage is applied to these wires (the anodes). Other electrodes (cathodes) are placed in the detector immediately behind the anodes. They enable the position to be read out and are held at ground potential. Each ionisation within the detector volume produces charges deposited on the anode. A charge sensitive preamplifier is connected to the anode and the number and approximate energy of incident photons can be determined from the measured signal amplitude. The position sensing capability of the detector is accomplished by the backgammon technique (so called because configuration of the readout cathodes' interleaved wedges, resembles a backgammon game board). When an avalanche occurs at the anode, charges are also induced on the wedges. The amount of charge on each of the two electrodes depends on the position of the event – and these induced signals are used to determine the position, in one dimension, of the event.
The detector is mounted in the spectrometer by means of attachment points on the upper (window) side (see Figure 4). In its flight configuration, an electronics package is integrated with the detector, and this package has an alloy enclosure and cable harnesses. The window frame has a recess into which the window is bonded, and an attachment point for the gas filling tube. The detector is fixed to the spectrometer by means of four “feet”, which are part of the window assembly. A vibration-damping mounting system is used, consisting of small O-rings and continuity straps. This isolates the detector from vibrations and the structure (at launch and at other times during assembly and integration) whilst preserving alignment and maintaining electrical continuity.
X-rays enter the detector through its window, which is a single piece of 125 mm beryllium foil brazed to the window frame. Although the window is securely attached to the window frame, the strength of the beryllium foil is insufficient to support the outward pressure, and therefore the window frame has a number of apertures cut into it, leaving bars arranged along the length of the detector. These bars have sufficient rigidity and are closely enough spaced to support the window. These bars reduce the active area of the detector by 20 %. Because they are parallel to the position sensing axis of the system, the presence of these bars has no other effect in the spectra. The anodes are connected together in pairs, by conductors (inside the detector, but outside of the internal end walls). The anodes are 15 mm diameter alloy wires (92 % Pt and 8 % W). The detector volume is divided into two cells by a set of cathode wires. These wires are equally spaced along a line which divides the cross-section of the detector into two equal parts. The effect of these cathodes on the electric field is the same as if a solid conductor were to divide the detector. The potential is zero at the cathodes, and so the field configuration is symmetrical. The counter thus functions as two separate detectors.
The position sensing function of the detector is provided by the wedge-and-wedge cathode plate. This is a fused silica (quartz) plate, 2 mm thick, with a thin gold layer deposited onto it. A continuous line is etched into the conducting layer, dividing it into two electrodes (the wedges). When the detector is operated, a charge distribution is induced onto this cathode whenever there is an avalanche on the nearby anode wires. The wedges act to divide the quantity of induced charge according to the position of the avalanche. The signals from the wedges are digitised to 8-bits, and are routed through the look-up table (LUT) to determine the position of each event to within a fraction of 1 mm (the spectrometer electronics unit carried out this function using the LUT stored in the EPROM memory).
This method of signal processing is advantageous in space-engineering terms, but has some drawbacks. These are mainly related to the degree of uniformity seen in the encoded data. At certain positions, it appears as if there are spikes and notches in what should otherwise be a flat or smoothly varying pattern of illumination (cf. Figure 12). This is most pronounced at the centre of the readout, and is clearly visible at approximately one quarter and three quarters of the distance along it, and also results in less pronounced nonuniformities elsewhere. These are seen in the RESIK data and were also a feature of Yohkoh BCS spectra (see The Yohkoh Analysis Guide, 1999) and the BCS on Solar Maximum Mission. These nonuniformities are due to the way in which analogue-to-digital converter (ADC) output data is processed by the instrument position-encoding look-up table (LUT). This is because the LUT implements a analogue-to-digital division operation at a fixed arithmetic precision. The Yohkoh BCS and RESIK LUT store the result of the following expression in the LUT address:
| (2) |
If the result is not exact, then the nearest integer value is used. The nature of the resulting redistribution function, from real position to encoded position is not smoothly varying, and the result is that spikes and notches are added to the spectrum. The effect was referred to as the "notch" effect in discussions of BCS spectra from Yohkoh and SMM, though it is more properly called a Fixed Pattern Structure (FPS) since the effect can influence any bin in the data and not only certain positions along the LUT map. It should be noted that the structure of FPS depends on the locations being sampled by the ADC data, i.e. on the given ADS and HV values, and is somewhat data dependent. Technically it is not a true fixed pattern, and cannot truly be removed by scaling by a constant flat field. However, for practical comparison of spectra, a convenient approximation has been developed in order to correct for such a scaling. This is possible since the appearance of the structure is relatively stable over a range of observations obtained with similar ADS and HV settings. Computation of FPS pattern has been followed successfully allowing to correct for this effect. This work was done by Phillips (1994) and recently by Sylwester et al., (2004a), respectively, for the Yohkoh BCS and RESIK instrumentation setups respectively. It should be noted that the mechanism of the effect is not a scaling law (like a sensitivity change) but a redistribution of counts from one location, inaccessible due to the finite table, to another. In general no counts are lost due to the encoding process. For purposes of spectra reduction, we incorporate experimentally determined FPS corrections, different for each ADS and HV settings, i.e. for each spectral observing mode.
The position sensing function of encoding system becomes electronically saturated when the count rates exceed few thousand counts s-1. The saturation enable the spectra to be seen only for flares below the M8 and X1 GOES importance class for detectors A and B respectively.
Each detector may be illuminated when required by an Fe55 calibration source. The stepper motor assembly which moves the calibration source can be seen in the upper part of the instrument box shown in Figure 4. On command, the calibration source is rotated so as to flood the detector window uniformly with the characteristic X-rays of the decay of this isotope (Mn Ka1 and Ka2 at 5.899 keV and 5.888 keV respectively). Data from such calibration activities has not indicated any appreciable change in the detector gain (a measure of the detector gas integrity) over the duration of the experiment.
A great deal of attention has been paid to the intensity calibration of the RESIK
spectrometer, and we believe the effective areas shown in Figure 8 are accurate to about
20 % or better in first diffraction order. It is possible to verify this by comparison
with X-ray data from other solar X-ray instruments. Unfortunately, there is less than
five months of overlap between the launch of CORONAS-F (2001 July 31) and the loss
of communication with the Yohkoh spacecraft (2001 December 14). However, during
this time several flares occurred which will enable comparison of data from the
Yohkoh Bragg Crystal Spectrometer, which includes spectra from the range of the Fe
xxv
![]() ,
Ca XIX lines
,
Ca XIX lines
![]() , and S xv lines
, and S xv lines
![]() . Analysis of simultaneous data sets is proceeding at present.
. Analysis of simultaneous data sets is proceeding at present.
It has been possible to compare data from the Reuven Ramaty High Energy Solar Spectroscopic Imager (RHESSI) with RESIK data. RHESSI, which was launched on 2002 February 5, observes the X-ray and gamma-ray spectra of solar flares from 3 keV to 17 MeV, with an energy resolution of 1 keV or slightly better in the X-ray region. Two atomic line features, viz. the group of Fe xxv lines and satellites at 1.9 Å (6.7 keV) and higher-excitation Fe xxv lines and Ni xxvii lines at 1.58 Å (7.9 keV), are observed as broad features on a continuum. The thermal continuum can be traced in flare spectra to very high energies ( ~ 30 keV) where, at the flare impulsive stage, a nonthermal bremsstrahlung continuum appears Lin et al., (2002). The continuum observed by RHESSI at its low-energy end, ~ 3 keV (4 Å) can be compared with that observed by RESIK in channels 1 and 2 where the fluorescence contribution to the background is considered to be very small.
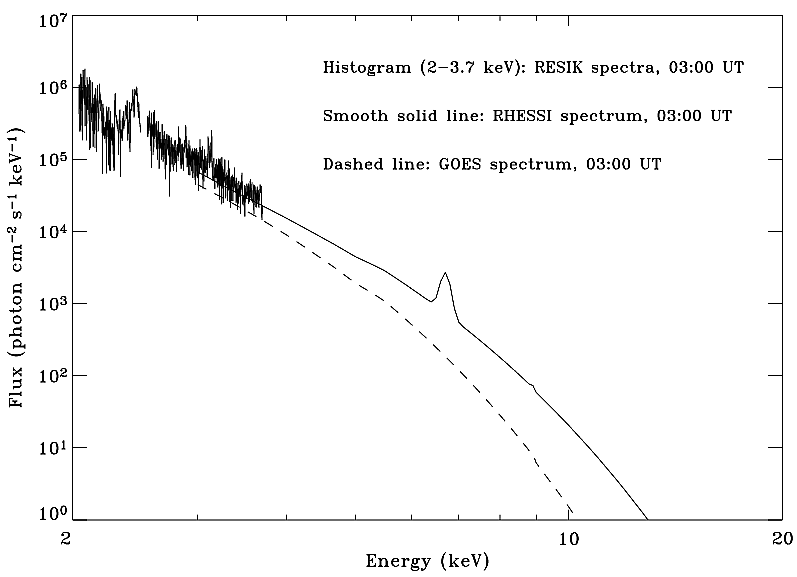
Figure 9: Comparison of RESIK, RHESSI and GOES spectra during the M2.1 flare on 2003 April 26. The spectra are plotted against energy (keV) and the spectral fluxes are in units of [photons cm-2s-1keV-1]. The RESIK spectra include all four channels and cover the range 2.04 - 3.68 keV (i.e. 3.37 - 6.09 Å). The RHESSI spectrum is from spectral fits to the data using the standard RHESSI spectral software package. The GOES spectrum is calculated based on the temperature and emission measure derived from the ratio of the two GOES channels inserted into a function describing only the thermal continuum (free - free and free - bound) emission.
The double-peaked flare on 2003 April 26, with maxima in the GOES X-ray emission at 03:05 UT and 03:08 UT, is an example when RESIK and RHESSI spectra can be compared. During this flare, the RESIK instrument was set to a third-order spectrum mode in the interval 03:03:40 UT to 03:11:40 UT. RESIK first-order spectra are available over the period from 02:27 UT till the end of the flare, at about 03:20 UT. Figure 9 shows on a photon energy scale RESIK first-order spectra (channels 1 - 4) at 03:00 UT and simultaneous RHESSI spectrum. The effective areas shown in Figure 8 were used to convert photon count rates to absolute fluxes. The RHESSI spectrum, derived from standard RHESSI analysis software, becomes increasingly uncertain at the lower-energy (3 - 4 keV) part of its spectral range, but even so there is Ł 15% difference between the continuum as observed by channels 1 and 2 of RESIK (photon energy range 2.9 - 3.7 keV) with that observed by RHESSI. There is a fluorescence contribution to RESIK channels 3 and 4 (2.0 - 2.9 keV) which appears to enhance the continuum in this range. Allowing for this, the RHESSI continuum slope very closely matches that of the RESIK continuum slope.
In the short interval when RESIK was in third order, the group of Fe lines at 1.9 Å were observed. Over the period 03:03:12 UT to 03:05:32 UT, the averaged Fe line flux, obtained using third-order diffraction effective areas from Figure 8, is ~ 82 000 photons cm-2 s-1. This compares with ~ 61 000 over the same period from the RHESSI software, in which the flare's spectrum is analyzed using a thermal continuum function and two gaussian line features to fit the 6.7 keV (Fe line) and 7.9 keV (Fe/Ni line feature). The agreement is satisfactory.
These and other comparisons of the spectra, being made at present, give confidence to our intensity calibration determination which appear to be accurate to 20% as stated.
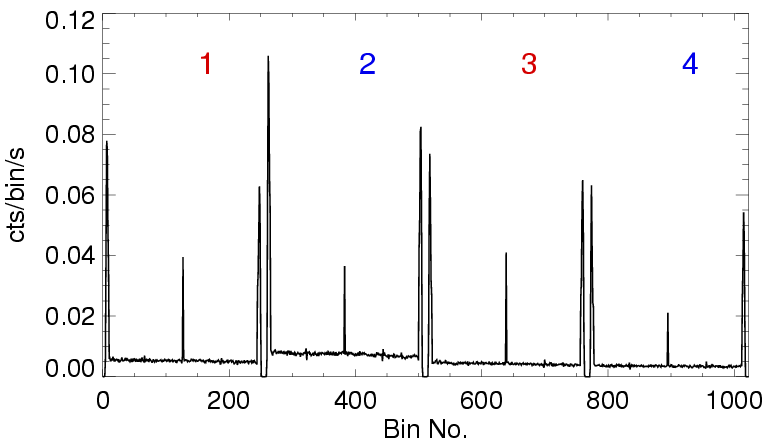
Figure 10: Observed rate of the low intensity orbital background collected over ~ 1.5 105 s early in 2003. The numbers denote respective RESIK channels.
The signal from the hidden bins is mostly due to background particles, and because of the detector position sensitivity, this particle rate is very low, less than 0.01 cts/bin/s. This low background means that RESIK sees true continuum levels for solar sources with emission measure as low as 1046 cm-3 (at T = 10 MK). It is possible, given the height of the hidden bins, to estimate (and subtract) the contribution to the measured spectra of the particle background component. This correction is incorporated within the spectra reduction software written in Interactive Data Language (IDL) and known as RESIN. Also during the S/C day, by monitoring the height of the hidden bin signal, it is possible to remove the background contamination. Investigation of relative heights of the signal measured in a pair of hidden bins in each channel allows us to identify the presence of the other sources of background contributors. Both auroral oval and non-solar X-ray direct illumination of the detectors causes an increase in the signal in one of the hidden bin areas (near bin 5). This asymmetry of the intensity in the hidden bin regions is tracked, and this can be used to select, during analysis, only those spectra where no unwanted contamination is present. In order to increase the lifetime of the detectors, the high voltage was switched off during passages of the spacecraft orbit through SAA and AO regions of Earth's magnetosphere. To enable triggering of the HV switch off, the read-outs from the four PIN radiation particle environment sensors were used (see Figure 3 for location of these sensors).
The sensitivity of these PIN detectors was found to correlate best (r ~ 0.97) with the high energy (E > 26 MeV) proton flux as measured concurrently by MKL, a part of the SKL instrument also aboard CORONAS-F. The correlation diagram showing this direct relationship is presented in Figure 11. The right panel in the figure illustrates the distribution of the high-energy background protons seen by the RESIK PIN detectors in May 2002. Clearly, the most contaminated are regions within the polar ovals, in addition to the well-known SAA. During the first three months of the mission's lifetime, the RESIK instrument was closely monitored with the amplitude discriminators set to the widest possible range, but as experience was gained we were able to design a special software routine, uploaded to the instrument's on-board computer which allowed the HV unit to be switched off at high particle density periods. The data from the PIN detectors are being analysed in order to find out by how much the energetic particle environment in SAA and AO regions depends on the solar activity (Kowalinski et al., 2004).
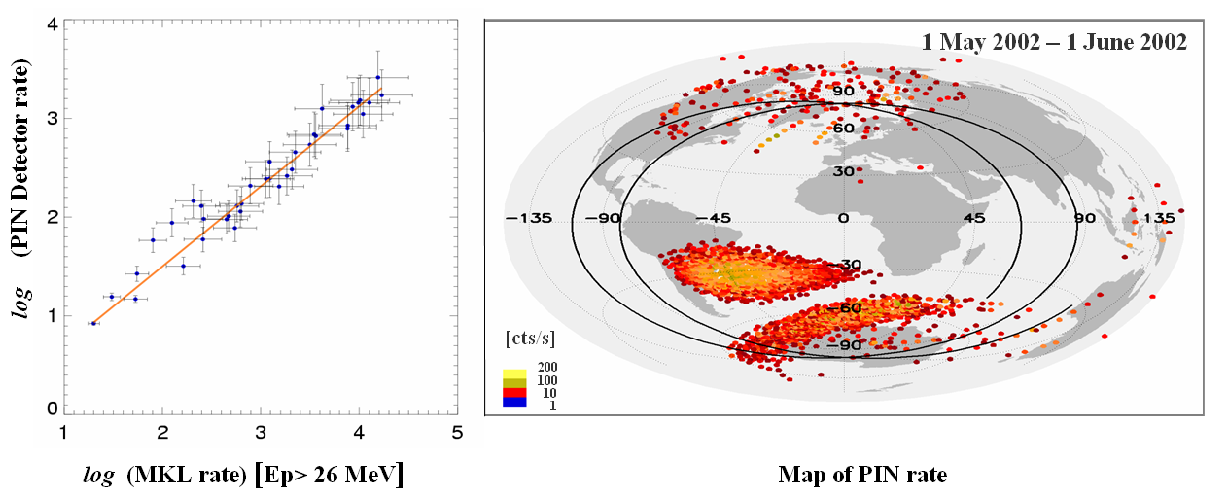
Figure 11: Left: Correlation diagram between PIN and MKL rates. Right: Distribution of rates as seen by RESIK PIN detectors in May 2002.
When the importance of fluorescence was first realized, a special sequence was devised in which the ADS and HV settings were adjusted so that the fluorescence signal in the pulse height analyzer was just separated from the solar signal. Over the period 2002 August 30 to September 5, the RESIK instrument was run in this fluorescence calibration mode, collecting more than 300 time intervals, total duration 34 hours, when the fluorescence and solar spectra were measured. During this time, solar activity on the GOES scale varied from B2 to over X1. The resulting summed fluorescence spectrum is shown in Figure 12. It was found that the shape of the fluorescence spectrum does not depend significantly on the level of solar activity. This has helped us to develop an algorithm to correct for the fluorescence.
Depending on the ADS and HV settings, only part of this fluorescence spectrum contaminates the measured spectrum. With known detectors' characteristics (i.e. the energy resolution and energy dependence of the fluorescence peak position in the ADS scale), the contaminating fraction can be precisely calculated. During each spectra gathering interval, independent information is also available on the integrated flux observed in the fluorescence peak at 1.75 keV. This information comes from the PHA 32-bit amplitude analyser, where Si fluorescence contributes to the dominating low-energy component peak. With the total fluorescence rate and the calculated fluorescence fraction leaking to the observed spectra known, the detailed fluorescence contamination profile can be calculated, and subsequently subtracted from the measured spectrum. The operation of the algorithm correcting for fluorescence was verified even when the real solar spectrum is only few percent of the total spectral signal. The fluorescence removal process will be described in more detail elsewhere (Sylwester et al., 2004b). The fluorescence removal algorithm is already built into the RESIN spectral reduction package (Kowalinski and Sylwester, 2004).
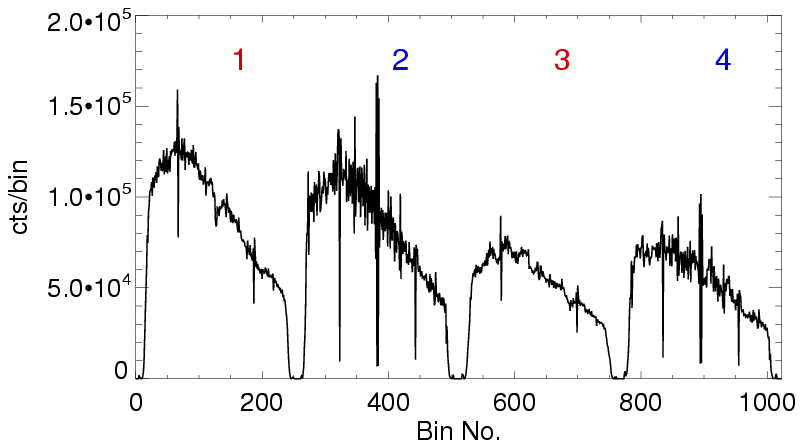
Figure 12: Observed profile of the fluorescence from the RESIK crystals. The spectrum shown was integrated over a 34-hour period between August and September 2002. The numbers at the top of the figure denote channel number. Note that the observed fluorescence signal is two times higher for channels (1 and 2) with silicon crystals than for channels (3 and 4) with quartz crystals.
The fluorescence contamination is the most serious for RESIK channels 3 and 4. For channels 1 and 2, the contribution is never more than few percent (with the exception of the period August - September 2002 when the fluorescence was being investigated). During the early part of the instrument operations, the instrument ADS and HV settings were adjusted several times so that the fluorescence in channels 3 and 4 was minimized. By late 2002, optimum settings were achieved, and it was found (for these settings) that the fluorescence contribution was not higher than ~ 20 %. Most of the analysis of RESIK data done so far is after this time.
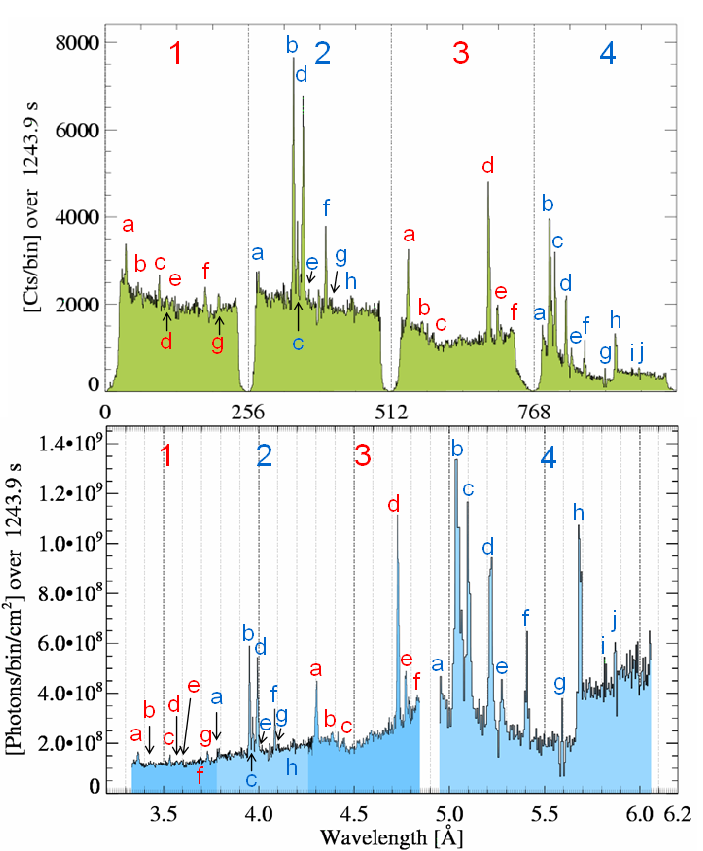
Figure 13: Example composite RESIK spectra as measured (upper panel) and after reduction (lower panel). During the reduction process, orbital background and fluorescence contamination have been removed. The spectra cover the wavelength range 3.35 Å - 6.15 Å and were collected during the 20-minute rise phase of the M1.9 east-limb flare on 2003 January 21. For each channel the key-letters above spectral features refer to those listed in Table II where spectral identifications are given.
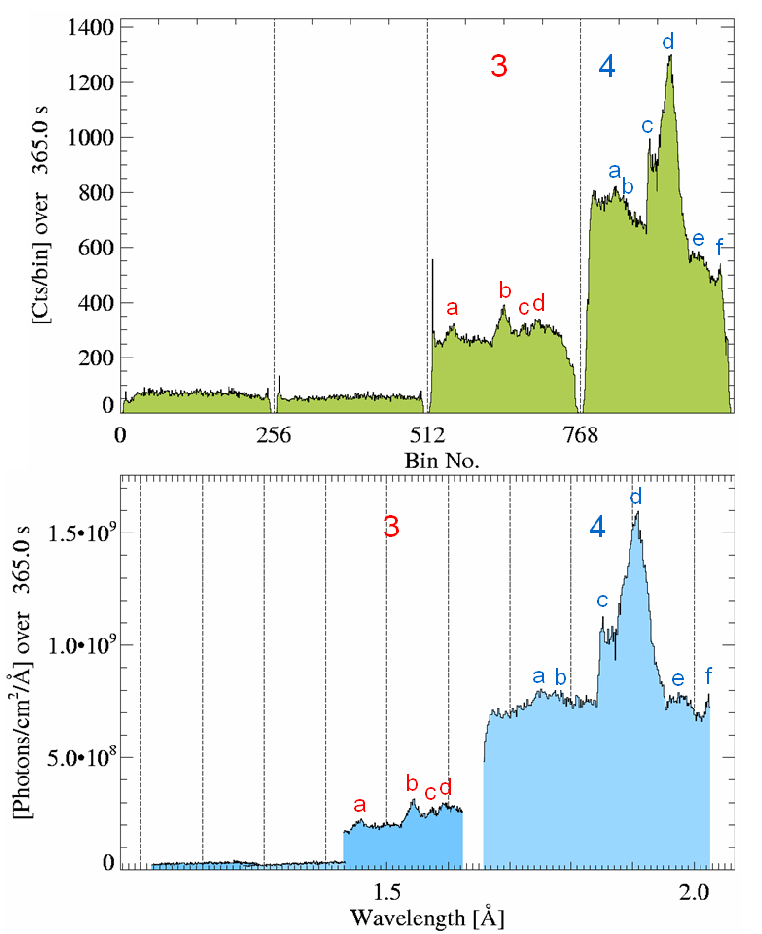
Figure 14: Example RESIK spectra measured in the mode where detectors were sensitive to photons diffracted from the crystals in second and third order. As a result, the reduction is more complicated. The spectra shown cover the wavelength range 1.35 Å - 2.05 Å and were collected during the maximum phase of the M2.1 flare on 2003 April 26. The key-letters above spectral features refer to those listed in Table III where possible spectral identifications are given.
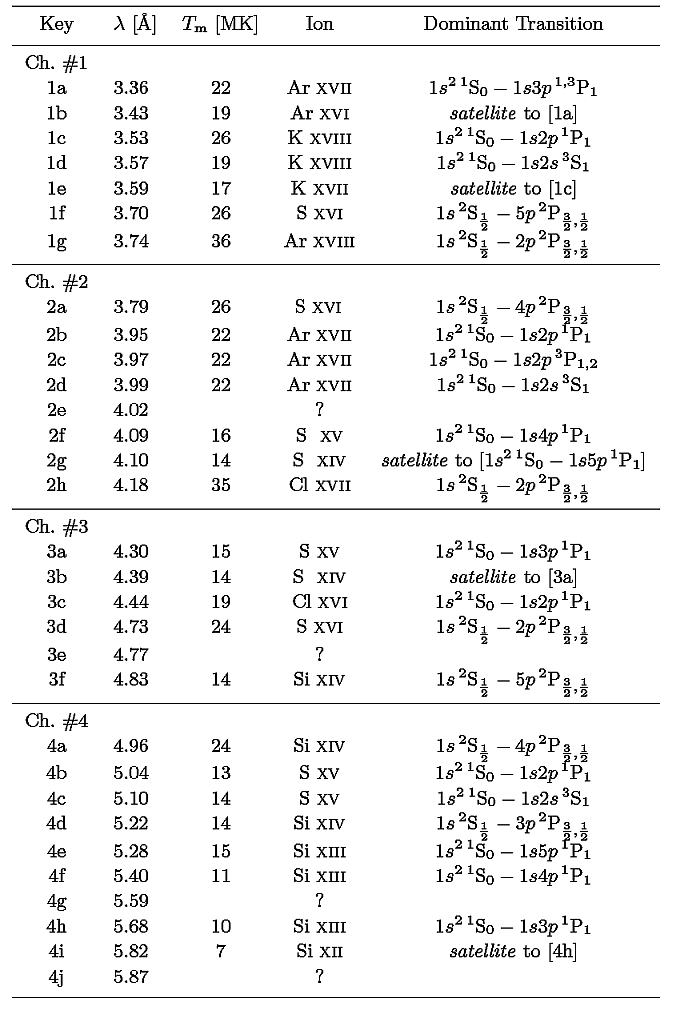
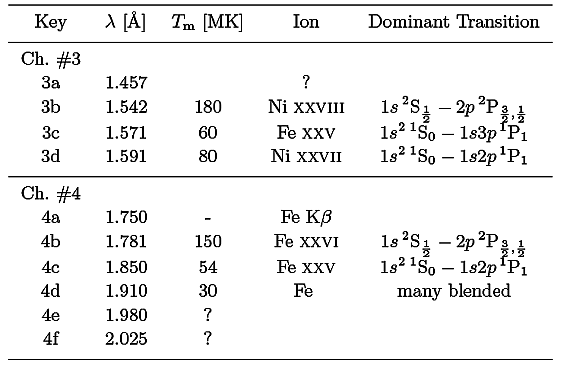
We illustrate the many thousands of RESIK spectra obtained since launch with an average one built up from ~ 100 individual spectra during the 20-minute rise of a typical flare, on 2003 January 21. This flare, with GOES intensity M1.9, occurred on the Sun's east limb (S07E90). Spectra from all four channels are given in Figure 13. For the spectrum shown in the figure, orbital background has been subtracted and the fluorescence and FPS effects have been corrected for. The flare's position on the Sun gave rise to a large offset resulting in relatively small wavelengths (such as the Ar XVII 3.367 Å line) being observed. Note that on this occasion the S xv 4.299 Å line appears at the short-wavelength end of detector 3. Features identified with labels in the figure are deemed real solar lines, not instrumental artifacts such as FPS corrections or irregularities in the background. Table II contains some 34 lines with their tentative identifications. For strong lines, the identifications are obvious. With theoretical wavelengths of these lines, wavelengths of other, less strong lines have been found from geometry optimization, described earlier. This is justified as a very good first approximation since the crystal surface appears close to cylindrical over the greater part of each channel. For occasions when RESIK was in third order, the lines listed in Table III were detected. Figure 14 shows third-order spectra for the flare of 2003 April 26. There is a possibility of contributions from second-order diffraction for channels (3 and 4) with quartz crystal; this is under investigation at present.
We have described the unique RESIK Bragg bent crystal spectrometer, part of the science package of the Russian CORONAS-F spacecraft. RESIK has collected over 500 000 spectra of flares, active regions and "quiet corona" over approximately two years of its operation since launch on 2001 July 31. At present its operation is suspended by problems with the power supply. Some of the details concerning the operation of the instrument may be found in the RESIK Weekly Newsletters (2002/2003).
RESIK has one of the better-understood calibrations of instrumental response among Bragg crystal X-ray spectrometers in solar physics. With its wavelength coverage it is very well suited to provide input for "experimental'' cross-calibration of the previous (BCS Yohkoh) and recent (RHESSI, SPIRIT) X-ray solar mission. Over the entire duration of the RESIK active period, GOES soft X-ray measurements of the global solar flux are available in two bands: 0.5 - 4 Å and 1 - 8 Å from GOES-8 (until April 2004) GOES-10 and GOES-12 (from March 2003). This offers the possibility of cross calibration between RESIK and the three GOES satellites. Such a comparison may lead to "observational" verification and/or improvement of GOES temperature scale assigned to particular measured flux ratio for all early observations, starting around 1970.
Scientific issues being presently addressed in the ongoing analysis of RESIK data include:
All the RESIK data have been placed in the public domain and are available on request. The catalogue of RESIK observations is available online at the web address: http://www.cbk.pan.wroc.pl/resik_catalogue.htm.
The construction of RESIK has been possible thanks to enthusiasm of many people including M. Oczyński and
| E. Stańczyk |
KJHP thanks the award of a US National Research Council Research Associateship at NASA Goddard Space Flight Center. Thanks are due to Dr. Brian R. Dennis for help with RHESSI spectral analysis. We acknowledge access to the CORONAS-F spacecraft attitude data (shown in Figure 2) which were obtained from Dr. Sergey Kuzin of the SPIRIT Team, FIAN, Moscow. In calibrating RESIK PIN sensors, we used SKL fluencies kindly provided by Dr. Alexander Podorolsky from MGU, Moscow. Anna Kępa is acknowledged for plots of line emission functions.
email
js@cbk.pan.wroc.pl