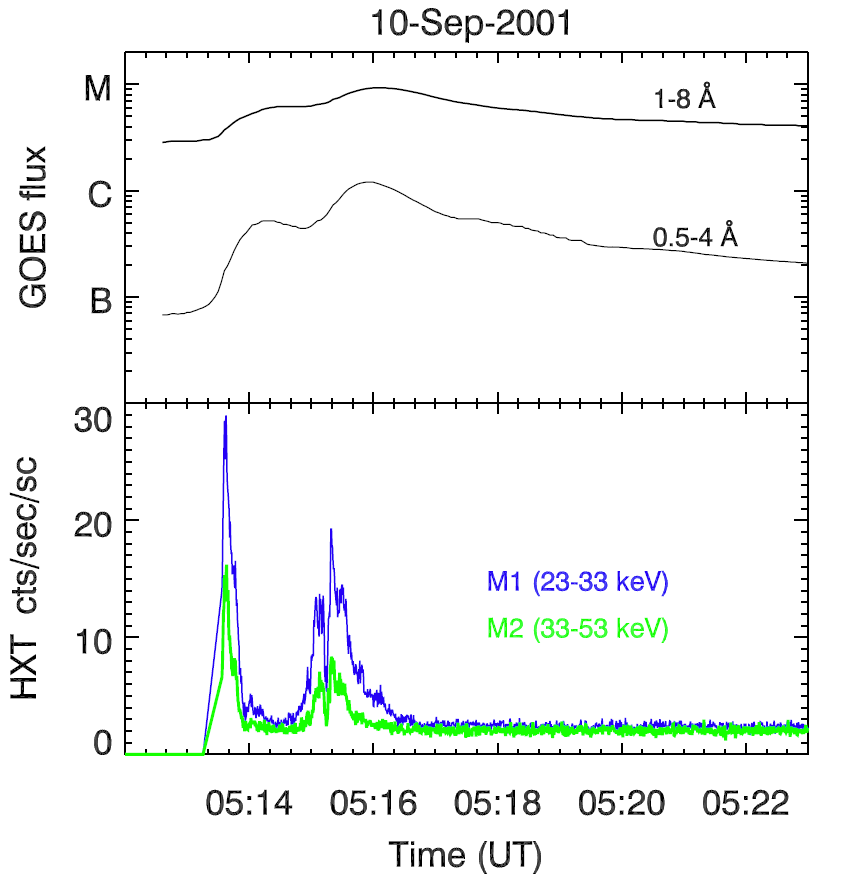
FIGURE 1. X-ray light curves for 10 September 2001 flare: top) GOES; bottom) HXT M1 and M2 channels .
a
Space Research Center, Polish Academy of Sciences, Kopernika 11, 51-622 Wrocław, PolandbAstronomical Institute of Wrocław University, Kopernika 11, 51-622 Wrocław, Poland
Abstract.
Hard X-ray emission during solar flares indicates usually presence of two or more sources, interpreted as regions of precipitation of non-thermal electrons propagating along the legs of the flaring magnetic loops. These sources often show asymmetry in hard X-ray fluxes. The brighter source is usually located in a weaker photospheric magnetic field region. For a simple interpretation a weaker convergence of magnetic field lines in a loop's leg with a weaker magnetic field allows more electrons to reach the chromosphere.
Another possibility is that the source of the energy release
is located closer to one end of the loop. In this case this footpoint can be
brighter in hard X-ray independently on the strength of the underlying magnetic
field. In this paper we present example of a flare in which possible electron
acceleration site is located asymmetrically, near one of the footpoint at the
place where two magnetic loops interact.
Keywords: Solar physics; Solar corona; Solar flares;
Solar X-ray INTRODUCTION
It is now widely established from the Yohkoh and RHESSI hard X-ray images that, during the impulsive phase of a solar flare, double (or multiple) hard X-ray sources often appear at the base of flaring loop or arcades of loops. These sources are interpreted as regions of precipitation of non-thermal electrons along the legs of the magnetic loop (Sakao 1994, Kundu et al. 1995, Li et al. 1997, Aschwanden et al. 1999). In such model a weaker convergence of the magnetic field lines in a loop's leg with a weaker magnetic field allows more electrons to reach the chromosphere.
However there are examples of flares that do not fit the above scenario. Thus, of five flares analysed by Sakao (1994) for which magnetograms were available, one has a brighter footpoint located in the stronger photospheric magnetic field region. Asai et al. (2002) also reported an example of a flare for which the brighter footpoint was found in a stronger magnetic field. Goff et al. (2004) studied the magnetic field strengths at the footpoints of a sample of 32 flares and compared them to the hard X-ray brightness ratio. They have found that contrary to the expected relationship the brighter HXR footpoint is located in the region of stronger magnetic field in approximately one third of sample of events (11 of 32). This kind of flares was named by authors as N-type (non-Sakao type, in the opposite of typical Sakao type phenomena). According to their interpretation the explanation of N-type events may be an asymmetry in the location of the acceleration site. If the acceleration site is located closer to the brighter footpoint it may reduce the effects of convergence over the shorter distance, allowing more precipitation in this region than if the acceleration site was located at the loop apex.
In this paper we analyse more detailed one of the N-type
flare studied by Goff et al. (2004). We indicate that in this event possible
electron acceleration site may be located asymmetrically near one of the
footpoints at the place where two magnetic loops interact and high density in
the loop reduces number of electrons impacting the chromosphere at the other
footpoint.
OBSERVATIONS AND RESULTS
The analysed event occurred on 10 September 2001 around 05:13 UT. It was C5.8 GOES class solar flare, which started at 05:12 UT, reached the maximum at 05:16 UT and ended at 05:23 UT. This flare was located near solar disc center (E14 S24), and was observed by the Yohkoh soft X-ray (SXT) and hard X-ray (HXT) telescopes, and also by TRACE and SOHO satellites. We used here images taken at Be119 filter from SXT grazing-incidence imaging telescope (Tsuneta et al., 1991), images reconstructed in four energy ranges [L (14-23 keV), M1 (23-33 keV), M2 (33-53 keV) and H (53-93 keV)] from HXT Fourier synthesis telescope (Kosugi et al., 1991), and GOES broadband X-ray fluxes measured at 1-8 Å and 0.5-4 Å wavelength band.
FIGURE 1. X-ray light curves for 10 September 2001
flare: top) GOES;
bottom) HXT M1 and M2 channels .
GOES light curves of this event are presented in Figure 1 (top). HXT light curves (Figure 1 - bottom) indicate that actually there are two energy release events in this flare: one lasting from 05:13:30 UT to 05:14:00 UT and other from 05:14:50 UT to 05:16:20 UT. This is confirmed by sequence of SXT images in which two nearly parallel small loops brighten one after another during a few minutes. Figure 2 shows SXT soft X-ray image of the first flaring loop with overlaid hard X-ray contours at three HXT energy ranges: L, M1 and M2 (the image in H channel can not be reconstructed because of low count rate).
FIGURE 2. SXT soft X-ray image of the first flaring
loop at Be119 filter. Contour levels at 0.1, 0.3 ... 0.9 of the maximum flux
show hard X-ray images at three HXT energy ranges: left) L channel,
middle) M1 and right) M2.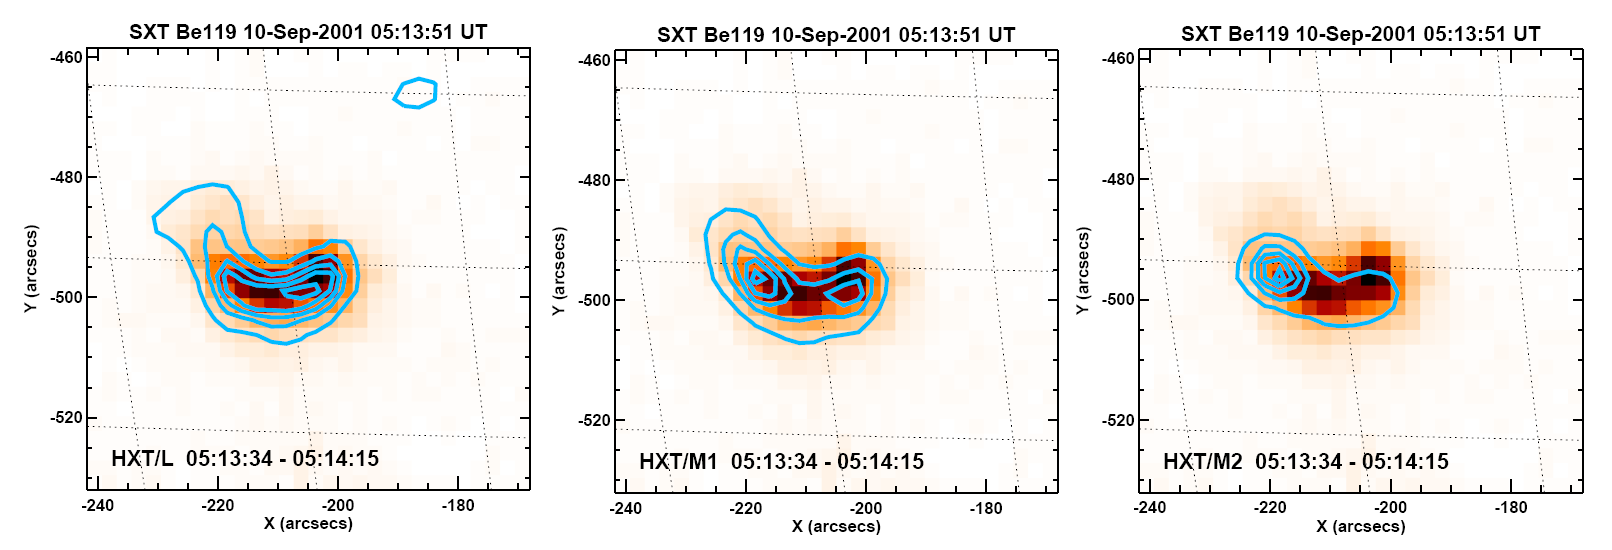
HXT images were synthesized using standard Maximum Entropy Method (MEM) from Solarsoft library. At lower energies (channel L) emission comes from the whole loop. Going to higher energies (M1 and M2) emission at the footpoints of this loop dominates; moreover East footpoint is clearly brighter than West one, even though it is located over region of stronger magnetic field (Goff et al., 2004).
FIGURE 3. Evolution of the whole flare as seen in
soft X-rays. Three frames are shown at which different loops dominate. In lower
left corners heliographic coordinates are shown.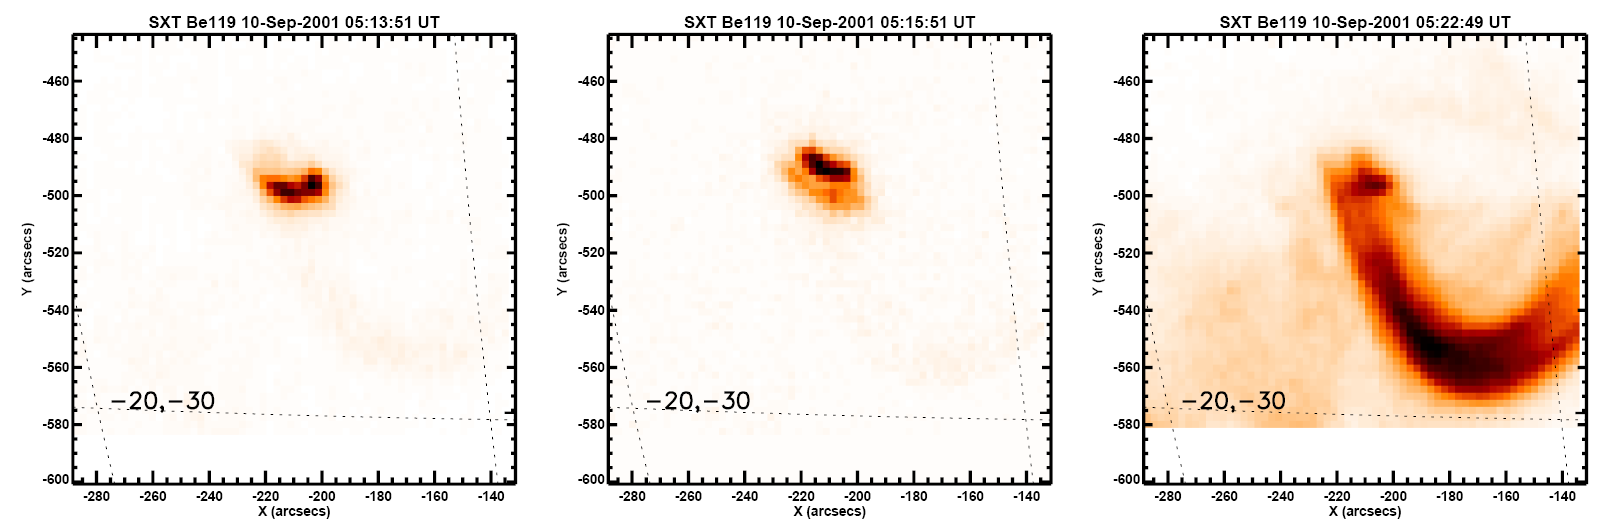
Evolution of the whole flare as seen in soft X-rays is presented in Figure 3. The loop described above (loop A in Figure 4) disappeared at about 05:15 UT and at this time a second small parallel loop brightened (loop B, see Figure 4) reaching soft X-ray flux maximum at 05:16 UT. When booth small loops decrease in intensity another system of much larger loops appears, in which at least two loops (denoted as A' and B', see Figure 4) can be clearly distinguished. This system of loops is seen from the first SXT image sequence but they have very low intensities in comparison with flaring loops A and B.
FIGURE 4. Left: Composition
of SXT images from Figure 3 (weighted sum) showing mutual locations of the loops
during the flare. Right: Schematic 3D models of the loops interaction for
two different angles of view.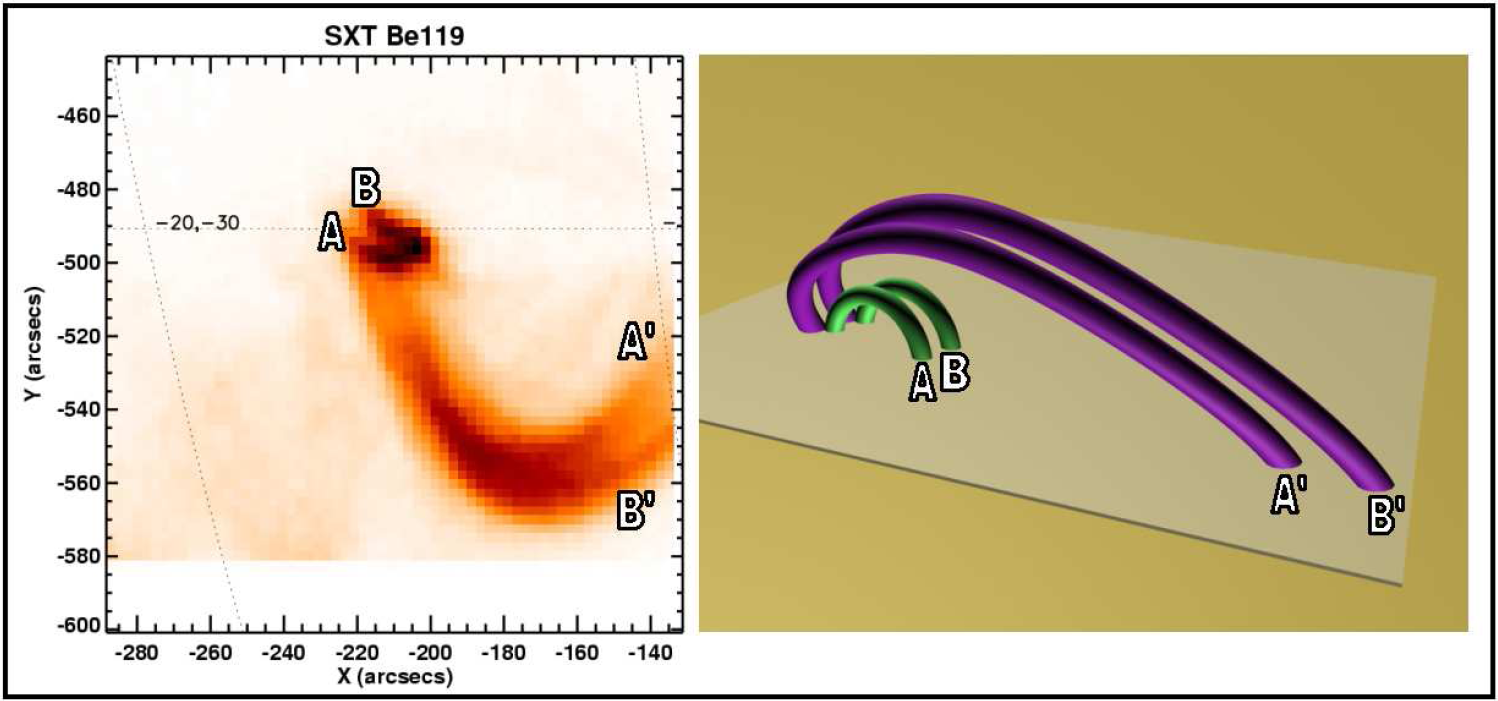
Figure 4 (left) presents compositions of images from Figure 3. This Figure indicates on the possible interaction of loops A with A' and B with B', near their East anchorages. Such interaction can be a source of energy release in the observed flare and can explain why the hard X-ray emission at the West footpoints of loops A and B is much weaker, if the loops are sufficiently dense to stop the flaring electrons on their way to these footpoints. Schematic 3-D model of the loops interaction in the analysed event is presented in right panel of Figure 4.
In order to check if the dense loop (loop A in Figure 4) can stop large amount of the nonthermal electrons we have calculated density and temperature of this loop from GOES 0.5-4 and 1-8 Å observations (Thomas et al., 1985). We obtained ne = 6.1×1010 cm-3 with Te = 12.8 MK. From the SXT images we can estimate the loop length and corresponding column density Nl » ne ×L » 1.05×1020 cm-2. We can also calculate the energy of the electrons which are collisionally stopped by this column density: El = (3×Ccoll ×Nl)1/2 (Fisher, Canfield, and McClymont, 1985), where Ccoll = 3.64×10⁻¹⁸ keV2 cm2. For the loop A this gives El » 34 keV, and means that only electrons with E > El can reach the chromosphere at West footpoint of the loop A.
To estimate the ratio of emission at the West footpoint (Ifw)
to the one at whole loop A (Il) and the ratio of the fluxes at
fotpoints East and West (Ife/Ifw) we use formulae
for intermediate thin-thick emission as given by Wheatland and Melrose (1995).
Assuming power law for photon and electron distribution and calculating mean
photon index gamma from ratio M2/M1 (![]() = 4.2) we have obtained If/Il » 0.38 and Ife/Ifw » 2.6 for M1 channel.
= 4.2) we have obtained If/Il » 0.38 and Ife/Ifw » 2.6 for M1 channel.
This last value corresponds well to the ratio of 2.2
calculated from M1 image (Figure 2 - middle). For the HXT channel M2 the
calculated ratio of Ife/Ifw » 1.6 is however less than value of 4.0 as obtained from observations (Figure 2
- right). The discrepancy in this channel can be explained by very low counts
statistic. For example the total counts in the channel M2 between 05:13:34 -
05:14:15 UT are 80 only. Below 200 counts the Maximum Entropy Method can produce
large errors in the photometry value of the reconstructed images. It should be
also remembered that in our simple model we do not consider the changes in
average pitch angle of the electrons as they traverse the dense region.
CONCLUSIONS
Basing on RHESSI observations, Veronig and Brown (2004) reported lately a new class of solar flare hard X-ray sources in which the emission is mainly concentrated in a coronal loop so dense as to be collisionally thick at electron energies up to » 50 keV. As the source of energy release in these events is located probably near the loop top both footpoints indicated for only weak emission.
In our case energy release source lies probably near one of the footpoints as an
effect of two loops interaction and this footpoint is brighter. High column
density in the loop reduces number of electrons impacting the chromosphere at
the other footpoint. This simple model gives similar values between the observed
and calculated flux ratios at both footpoints, at least at channel M1/HXT (24-34
keV).
ACKNOWLEDGMENTS
MS has been supported by the Polish Committee of Scientific Research, grant
PBZ KBN 054/P03/2001. RF has been supported by grant No. 2P03 001 23 from
the Polish Committee for Scientific Research (KBN).
REFERENCES