Advances in Space Res. vol. 38, Issue 7
pp. 1543-1546 2006
Temperature-sensitive Line Ratio
Diagnostics based on Si Satellite-to-Resonance Line Ratios for 1s2-1snp Transitions
K. J. H. Phillipsa,
J. Dubaub,
J. Sylwesterc,
B. Sylwesterc,
J. L. Culhaned,
G. A. Doscheke,
J. Langf
aNational
Research Council Senior Research Associate, NASA Goddard Space Flight Center,
Greenbelt, MD 20771, U.S.A.
bObservatoire
de Paris, Section de Meudon, Place Jules Janssen, F-92195, Meudon, France
cSpace
Research Centre, Polish Academy of Sciences, 51-622, Kopernika 11, Wroc aw,
Poland
dMullard
Space Science Laboratory, Holmbury St Mary, Dorking, Surrey RH5 6NT, United
Kingdom
eE.
O. Hulburt Center for Space Research, Naval Research Laboratory, Washington, D.C.
20375, U.S.A.
fSpace
Science Dept., Rutherford Appleton Laboratory, Didcot, Oxon. OX11 0QX, United
Kingdom
Abstract
Dielectronic satellite lines due to 1s2 n˘l˘- 1snp n˘l˘ (n=3, 4) transitions in Li-like Si (Si XII)
occur at 5.818 Ǻ and 5.565 Ǻ,
on the long wavelength side of the He-like Si (Si XIII)
1s2-1s3p and 1s2-1s4p lines at 5.681 Ǻ and
5.384 Ǻ respectively. They have been
extensively observed with the RESIK crystal spectrometer on the Russian
spacecraft CORONAS-F. As with corresponding satellites 1s2 nl
- 1s 2p nl on the long-wavelength side of the Si
XIII 1s2-1s2p resonance line, there is an inverse temperature dependence
of the intensity ratio of the satellites to the He-like ion lines (Isat/IHe).
New atomic data are used to calculate the Si XII
satellite line intensities and thus the Isat/IHe
ratio. RESIK observations of the ratio in solar flares, together with
temperatures from the ratio of the two GOES X-ray channels, are compared
with theoretical variation of the ratio with temperature. The good agreement
indicates this to be a valuable temperature diagnostic for solar flares and
laboratory plasmas such as tokamaks. There are implications for similar
satellites in Fe line spectra which are observed with broad-band resolution by
the RHESSI solar flare mission.
Key words:
Sun, X-ray,
spectra
1 Introduction
The REntgenowsky Spektrometr s Izognutymi Kristalami (RESIK) instrument on the
Russian
CORONAS-F mission, launched on 2001 July 31, has obtained spectra in the
wavelength range 3.4 Ǻ-6.1 Ǻ during
the course of many solar flares. The 4.96 Ǻ-6.09 Ǻ range,
covered by channel 4 of RESIK, includes He-like Si (Si XIII)
lines due to the transitions 1s2-1snp, n=3, 4, 5. Satellite lines due to transitions 1s2 n˘l˘- 1s np n˘l˘ in Si XII ('spectator' electron specified by
n˘l˘, those with n˘l˘=2s or 2p being the most intense) form prominent features on
the long-wavelength side of the He-like lines. Preliminary results have been
presented by Sylwester et al. (2002), while
instrumental details are given by Sylwester et al.
(2004b). Intensity and wavelength calibration has been achieved through a
combination of pre-flight laboratory and published data; count rate spectra can
be converted to flux unit spectra via routines using these data written by the
RESIK instrument team. The Si XII satellites are of
considerable interest since the ratios of the satellites to the nearby parent (He-like)
line are temperature-sensitive, so offering a means of diagnozing the flare
plasma in the absence of similar ratios involving Si XII
1s2 n˘l˘- 1s 2p n˘l˘ satellites which are not included in the RESIK wavelength range.
Atomic parameters for the satellites have been calculated by one of us (J.D.)
and are used here to derive theoretical intensity ratios of the satellites to
the He-like ion lines. We use observations of these ratios during the course of
long-duration X-ray flares observed by RESIK. We compare the observed and
theoretical ratios using temperatures from GOES X-ray data, showing that
the agreement is very close.
2 Observations and Analysis
We selected four long-duration flares observed by RESIK in 2002, used in a
previous analysis (Phillips et al. 2003) of line intensities to obtain
abundances of K, Ar, and S. The flares occurred on April 14/15, July 11, July
22/23, and July 26/27. Emission detected by channel 4 of RESIK covering the Si
lines is diffracted by quartz crystal (diffracting plane
 ), 2d
spacing 8.51 Ǻ and rocking curve (FWHM)
0.62 mǺ. The spectral resolution has been
empirically determined to be 15.7 mǺ from
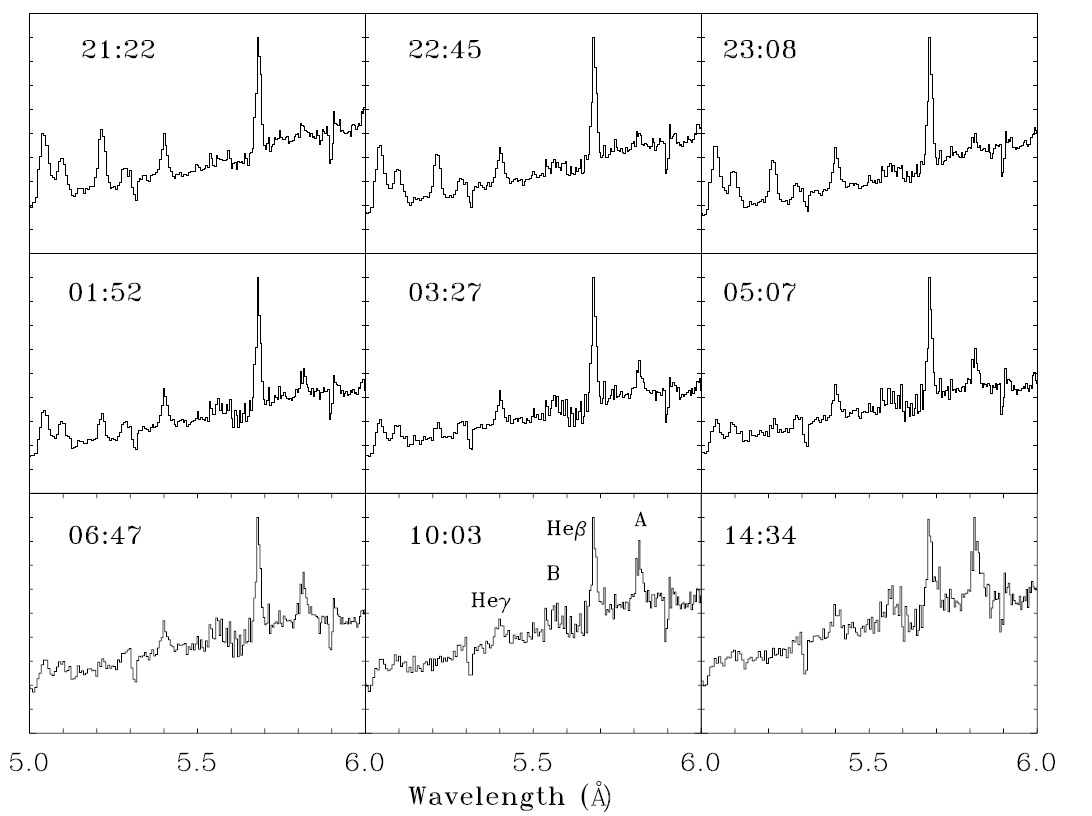
line widths during periods of relative quiescent solar conditions. Fig. 1 shows
nine spectra (data gathering intervals varying between 5 and 20 minutes) during
the course of the several-hour decay of the July 26/27 flare, with times (UT)
indicated. The Si XIII lines at 5.681 Ǻ and
5.384 Ǻ are due to 1s2-1s3p
), 2d
spacing 8.51 Ǻ and rocking curve (FWHM)
0.62 mǺ. The spectral resolution has been
empirically determined to be 15.7 mǺ from
line widths during periods of relative quiescent solar conditions. Fig. 1 shows
nine spectra (data gathering intervals varying between 5 and 20 minutes) during
the course of the several-hour decay of the July 26/27 flare, with times (UT)
indicated. The Si XIII lines at 5.681 Ǻ and
5.384 Ǻ are due to 1s2-1s3p
 and 1s2-1s4p
 transitions
respectively, and are prominent at earlier times (as are He-like S lines at
shorter wavelengths). At later times, the Si XII
satellite line features at 5.818 Ǻ and
5.565 Ǻ (called here A and B
respectively) are relatively more intense; the 5.818 Ǻ feature
is comparable in intensity to the 5.681 Ǻ line
some nineteen hours after the flare maximum, near 21:22 UT on July 26. There is
a marked decrease in temperature T, as indicated by the ratio of GOES
X-ray channels, for later times in this flare, so the intensity ratio of the
satellites to the He-like ion lines is clearly inversely related to T.
transitions
respectively, and are prominent at earlier times (as are He-like S lines at
shorter wavelengths). At later times, the Si XII
satellite line features at 5.818 Ǻ and
5.565 Ǻ (called here A and B
respectively) are relatively more intense; the 5.818 Ǻ feature
is comparable in intensity to the 5.681 Ǻ line
some nineteen hours after the flare maximum, near 21:22 UT on July 26. There is
a marked decrease in temperature T, as indicated by the ratio of GOES
X-ray channels, for later times in this flare, so the intensity ratio of the
satellites to the He-like ion lines is clearly inversely related to T.
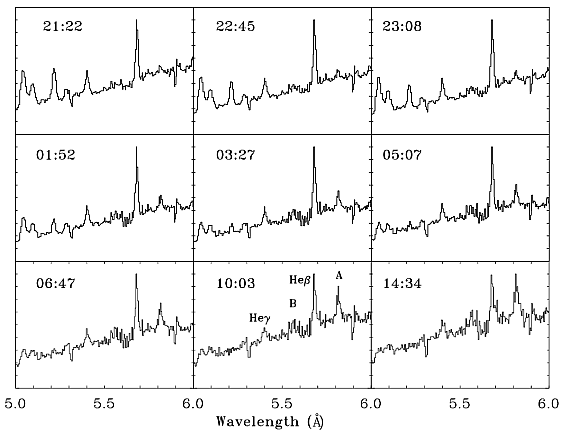
Figure 1: RESIK channel 4 spectra
during the flare of 2002 July 26/27 (times, UT, indicated), illustrating the
changing intensities of the Si XII satellite
features (A, 5.818 Ǻ and B, 5.565 Ǻ)
relative to the Si XIII
(5.681 Ǻ) and
(5.384 Ǻ) lines. These lines are indicated
in the 10:03 UT plot. The fluorescence background has not been subtracted from
these spectra.
RESIK spectra for times during all four flares were analyzed by finding best-fit
Gaussian profiles to the line emission whenever this was feasible. A pre-flare
spectrum was subtracted from each flare spectrum analyzed. For most spectra, the
measured Si XIII lines intensities have
uncertainties (taking account of the pre-flare spectrum subtraction) of
~ 15%, while the Si XII satellites have larger
uncertainties for times near the peak of each flare when they are relatively
much weaker. The ratios A/
and B/
were obtained for each time interval. For these same intervals, the GOES
temperature T was obtained, again subtracting a pre-flare level taken at
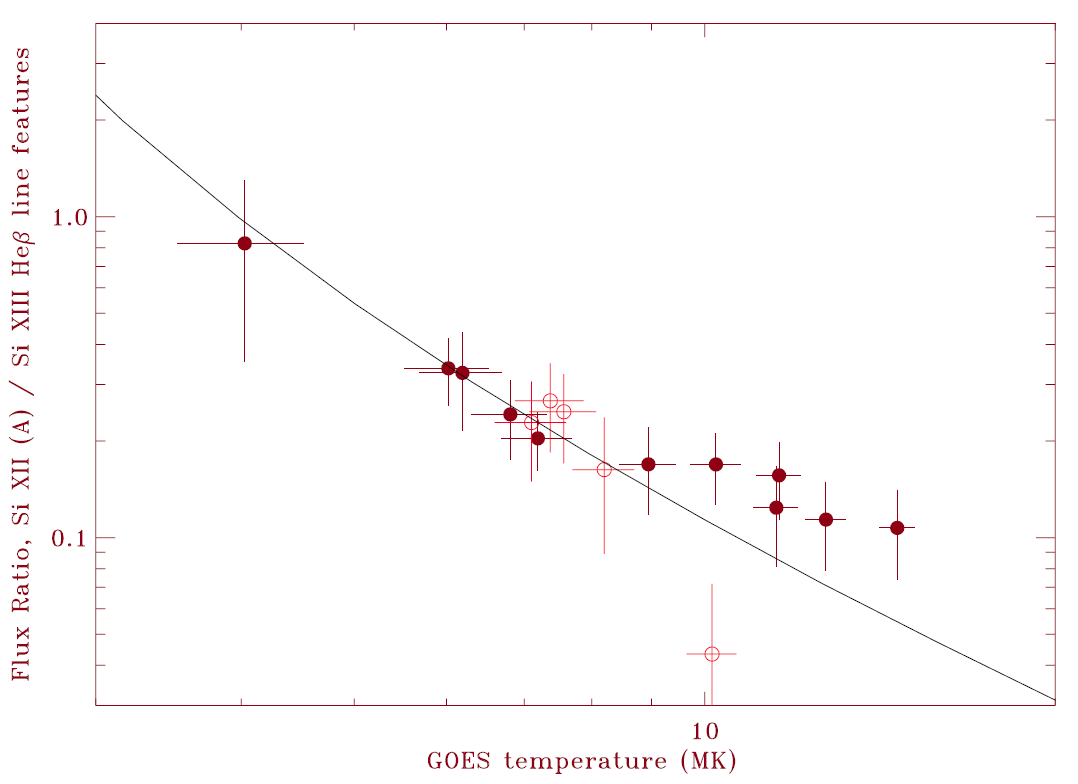
the same time as the RESIK pre-flare spectrum. The A/
ratios are plotted in Fig. 2 for the July 23 and July 26/27 flares, with error
bars indicating estimated uncertainties.
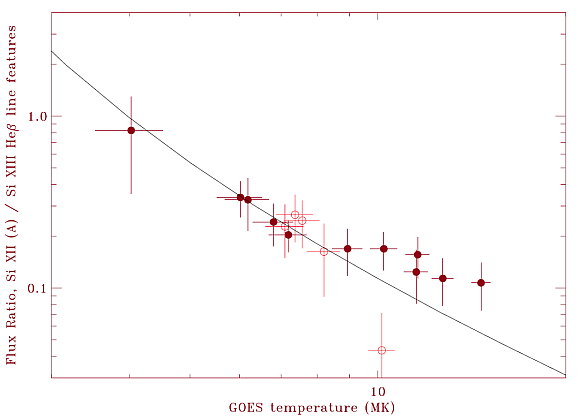
Figure 2: Observed (points with
error bars) values of Si XII
A/Si XIII
plotted against T derived from the ratio of the two
GOES channels over the same time intervals. Open circles: July 23 flare;
filled circles: July 26/27 flare. The curve is the theoretical variation
calculated using CHIANTI values for the Si XIII
line flux and data described in the text for the Si XII
satellites forming the line feature A.
3 Theoretical Line Intensities
The Si XIII
and
lines are formed mainly by electron collisional excitation. With the spectral
resolution of RESIK, there are two transitions involved, due to 1s2 1S0
- 1snp 1P1 and 1s2 1S0
- 1snp 3P1, the former much more intense
than the latter. The Si XII satellites making up the
A and B features are formed by dielectronic recombination.
Gabriel (1972) gives details of the
excitation rates, which are a function of T and an intensity factor Fsat
which depends on radiative and autoionization rate coefficients from the doubly
excited upper state. The CHIANTI atomic database and code gives line fluxes for
the Si XIII lines and for the Si
XII satellite feature A but not B. We
therefore used calculations of wavelengths, values of Fsat
and other atomic data for the satellites making up features A and B
done by one of us (J.D.). Generally, satellites with transitions 1s2
2p 2P3/2 - 1s 2p np 2D5/2 and 1s2
2p 2P1/2 - 1s 2p np 2D3/2 dominate A (n=3)
and B (n=4); they correspond to the intense satellites j
and k for the more familiar n=2 satellites
(Gabriel (1972)). The theoretical ratios
depend approximately on Fsat/T.
That for all satellites making up feature A are plotted against T
in Fig. 2, along with the observed points.
4 Results and Conclusions
There is a very close agreement between the observed points and theoretical
curve plotted in Fig. 2 for the Si XII A/Si
XIII
line ratio. Most points agree to within the estimated uncertainties. There are
fewer observed values of the Si XII B/Si
XIII
and the uncertainties are larger, but there is a general agreement with the
theoretical curve. In this preliminary work, we are aware of the possible
uncertainty in values of temperature derived from the two GOES
channels using a standard routine in the SolarSoft IDL package. This
package is based on ratios empirically derived by
Thomas et al. (1985), though newer line and continuum data from CHIANTI
will probably modify the dependence somewhat. In later work, we will use the
ratio of the total flux in two RESIK channels as temperature-indicators which
may be more satisfactory. Meanwhile, we may conclude that RESIK observations
during long-duration flares of the Si XIII 1s2-1s3p and 1s2-1s4p lines and nearby Si XII
satellites indicate their ratios to be a useful diagnostic of temperature.
RESIK observes corresponding satellite line features near He-like Ar (Ar
XVIII) lines (extreme end of channel 1 wavelength range)
and He-like S (S XV) lines (channels 2 and 3) during
flares. Sylwester etal.(2004a) gives details.
Depending on the flare temperature, these satellite features have intensities
often exceeding the He-like ion lines themselves. With such lines, other
temperature diagnostic information is therefore available. Recognizing the
multi-thermal nature of flare plasmas, the ratios of satellites to He-like ion
lines may give much more accurate differential emission measures than has
hitherto been possible.
Satellites to the 1s2-1s3p and 1s2-1s4p lines in He-like Fe (Fe XXV)
have not, to the authors' knowledge, been observed in solar flare spectra with
crystal spectrometer resolution, but they must have intensities that are
stronger than Si, S, or Ar because of the strong Z-dependence of the
satellite intensity factor Fsat.
The entire complex of Fe XXV lines and satellites form a
strong feature in the broad-band resolution of spectra obtained with the
RHESSI solar flare mission, photon energies around 8 keV (wavelengths
~ 1.5 Ǻ). The ratio of the 8 keV feature to
the stronger 6.7 keV line feature, also observed in RHESSI spectra, is
being used to diagnoze the hottest parts of the flare plasma.
Dennis et al. (2004) and Phillips (2004))
discuss this in more detail.
Acknowledgements
B.S, J.S. and M.S. acknowledge support from grants 2.P03D.002.22 and
BPZ-KBN-054/P03/2001 of the Polish Committee for Scientific Research.
K.J.H.P. acknowledges support from the U.S. National Research Council
Research Associateship Program.
References
- Dennis, B. R., Phillips, K. J. H., Sylwester, J., Sylwester, B., R. A.
Schwartz, A. K. Tolbert, Thermal and Nonthermal Contributions to the Solar
Flare X-ray Flux, Paper E2.3-0006-04, These Proceedings.
- Gabriel, A. H., 1972, Dielectronic satellite spectra for highly-charged
helium-like ion lines, M.N.R.A.S., 160, 99.
- Phillips, K. J. H., 2004, The Solar Flare 3.8-10 keV X-ray Spectrum,
Ap.J., 605, 921.
- Phillips, K. J. H., Sylwester, J., Sylwester, B., & Landi, E. 2003, Solar
Flare Abundances of Potassium, Argon, and Sulphur, Ap.J., 589,
L113.
- Sylwester, B., Sylwester, J., Siarkowski, M., Phillips, K. J. H., Culhane,
J. L., Lang, J., Brown, C., & Kuznetsov, V. D., 2004, Identification of
Lines in the Range 3.35 Å - 6.1 Å Observed in RESIK Spectra, Paper
E1.9-0032-04, These Proceedings.
- Sylwester, J., Culhane, J. L., Doschek, G. A., Oraevsky, V. N., Phillips,
K. J. H., & Sylwester, B. 2002, RESIK observations of highly ionized argon
and potassium X-ray emission lines in solar flares, Proc. Tenth European
Solar Physics Meeting, Prague: ESA SP-506, 765.
- Sylwester, J. et al. 2004, RESIK: A Bent Crystal X-ray Spectrometer for
Studies of Solar Coronal Plasma Composition, Solar Phys. (submitted).
- Thomas, R. J., Starr, R., & Crannell, C.-J., 1985, Expressions to
determine temperatures and emission measures for solar X-ray events from
GOES measurements, Solar Phys., 95, 323.
BACK