solar physics X-ray flares ectroscopy abundances
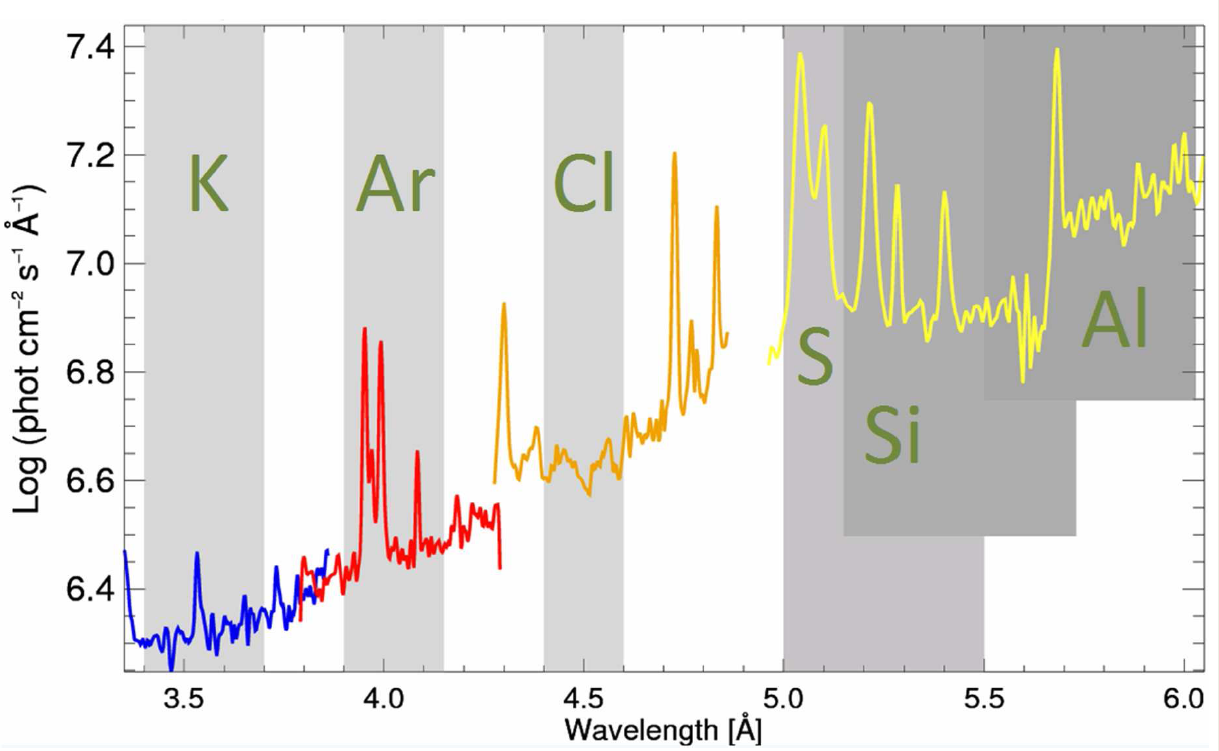
Figure 1: An example of a calibrated RESIK spectrum. This spectrum was accumulated over entire 2003 February 22 flare which took place around 09:30 UT. In gray, several spectral bands are marked, selected to study the absolute abundance of indicated respective elements.
The RESIK consists of two double-channel X-ray spectrometers equipped with bent crystals, a design similar to the BCS spectrometers aboard SMM and Yohkoh. RESIK was designed to observe hot solar plasmas. It was included in the scientific payload of the Russian solar satellite mission CORONAS-F. The detailed description of the RESIK instrument, its operation and calibration are presented in the paper by . Here we summarize a number of instrument characteristics important for the present study. The nominal wavelength coverage of RESIK was 3.35 Å - 6.1 Å. This range contains several spectral features useful for the X-ray plasma diagnostics. The observed line intensities can be used in order to study the physical conditions in the flaring plasma as well as to investigate its relative (element-to-element) composition. Inclusion of the continuum, also reliable measured, allows us to measure the absolute (relative to hydrogen) abundances, as substantial contribution to the continuum comes from bremsstrahlung emission. In the RESIK spectra one can find lines belonging to the elements with substantially different values of FIP: from the lowest being 4.34 eV (K), the highest being 15.75 eV (Ar). Other lines are identified by and . They include the triplets of He-like ions (K XVIII, Ar XVII, Cl XVI and S XV) as well as lines corresponding to (n > 3) ® (1) transitions in Si and Al.
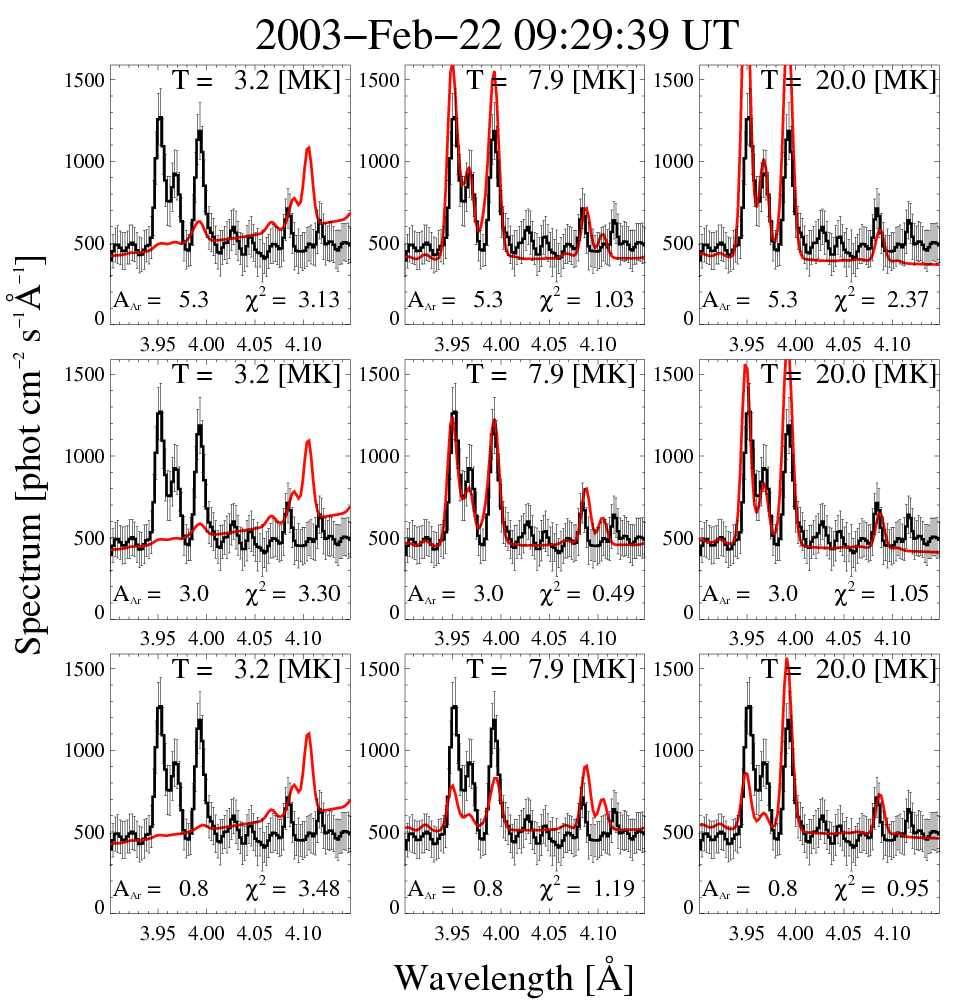
Figure 2: Nine examples of the fit between observed (histogram) and synthetic spectra. In each row, the abundance of the element of interest (Ar) is kept constant and the plasma temperatures correspond to three different values. In each column, the plasma temperature is constant and the abundance of Ar is set to three different values. In the central panel, the optimum fit is shown, characterized by the smallest value of c2 parameter. Such an optimum fit has been obtained for each of the spectra recorded throughout the flare.
All flares were observed early in 2003, when the instrument settings were optimised (cf. Table 1). We have carefully calibrated the observed spectra, establishing an absolute wavelength scale and determining the absolute spectral photon fluxes. We incorporated all known corrections which essentially remove the instrumental fluorescence radiation from the RESIK bent crystals material. This leads us to believe that the level of the continuum seen in the longer wavelength channels of RESIK is not contaminated. For the two shorter wavelength bands, the contribution of this fluorescence to the continuum is found not to be a problem as it amounts to less than one percent.
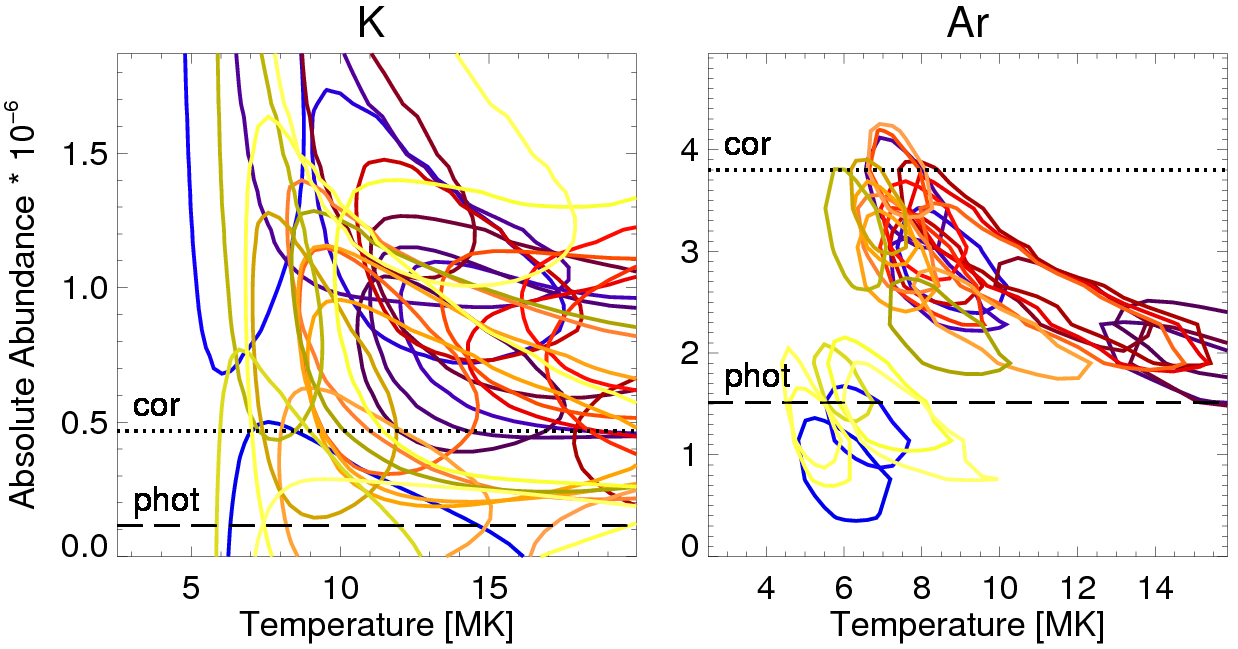
Figure 3: left: potassium
Contours of
 dupafor the 2003
February 22, 09:30 UT flare. Individual shades of the contours represent the
time-in-flare, with dark shades representing fits to the spectra observed
earlier on in the rise phase. The light gray contours represent the decay phase
of the flare. The "phot." and "cor." horizontal lines designate the photospheric
and coronal abundance levels for potassium as taken from and respectively.
right: argon A corresponding diagram shown for more abundant element
Ar. Here the
dupafor the 2003
February 22, 09:30 UT flare. Individual shades of the contours represent the
time-in-flare, with dark shades representing fits to the spectra observed
earlier on in the rise phase. The light gray contours represent the decay phase
of the flare. The "phot." and "cor." horizontal lines designate the photospheric
and coronal abundance levels for potassium as taken from and respectively.
right: argon A corresponding diagram shown for more abundant element
Ar. Here the
![]() contours are more compact which indicates that respective abundance
uncertainties are much smaller. The inset in the upper right shows the actual
shape of the
contours are more compact which indicates that respective abundance
uncertainties are much smaller. The inset in the upper right shows the actual
shape of the
 surface at one time
corresponding to flare maximum.
surface at one time
corresponding to flare maximum.
In the analysis, we have used a novel "locally isothermal" (LI) approach in order to separate the impact of abundance variability from the temperature (multitemperature-DEM) effects on the spectra as much as possible. In the LI approach we make "implicit use'' of somewhat similar temperature dependence of the line and the nearby continuum emission functions in the region of the effective line formation. This similarity causes the abundance effects to dominate over DEM effects in the Line-to-Continuum (L/C) ratio variability.
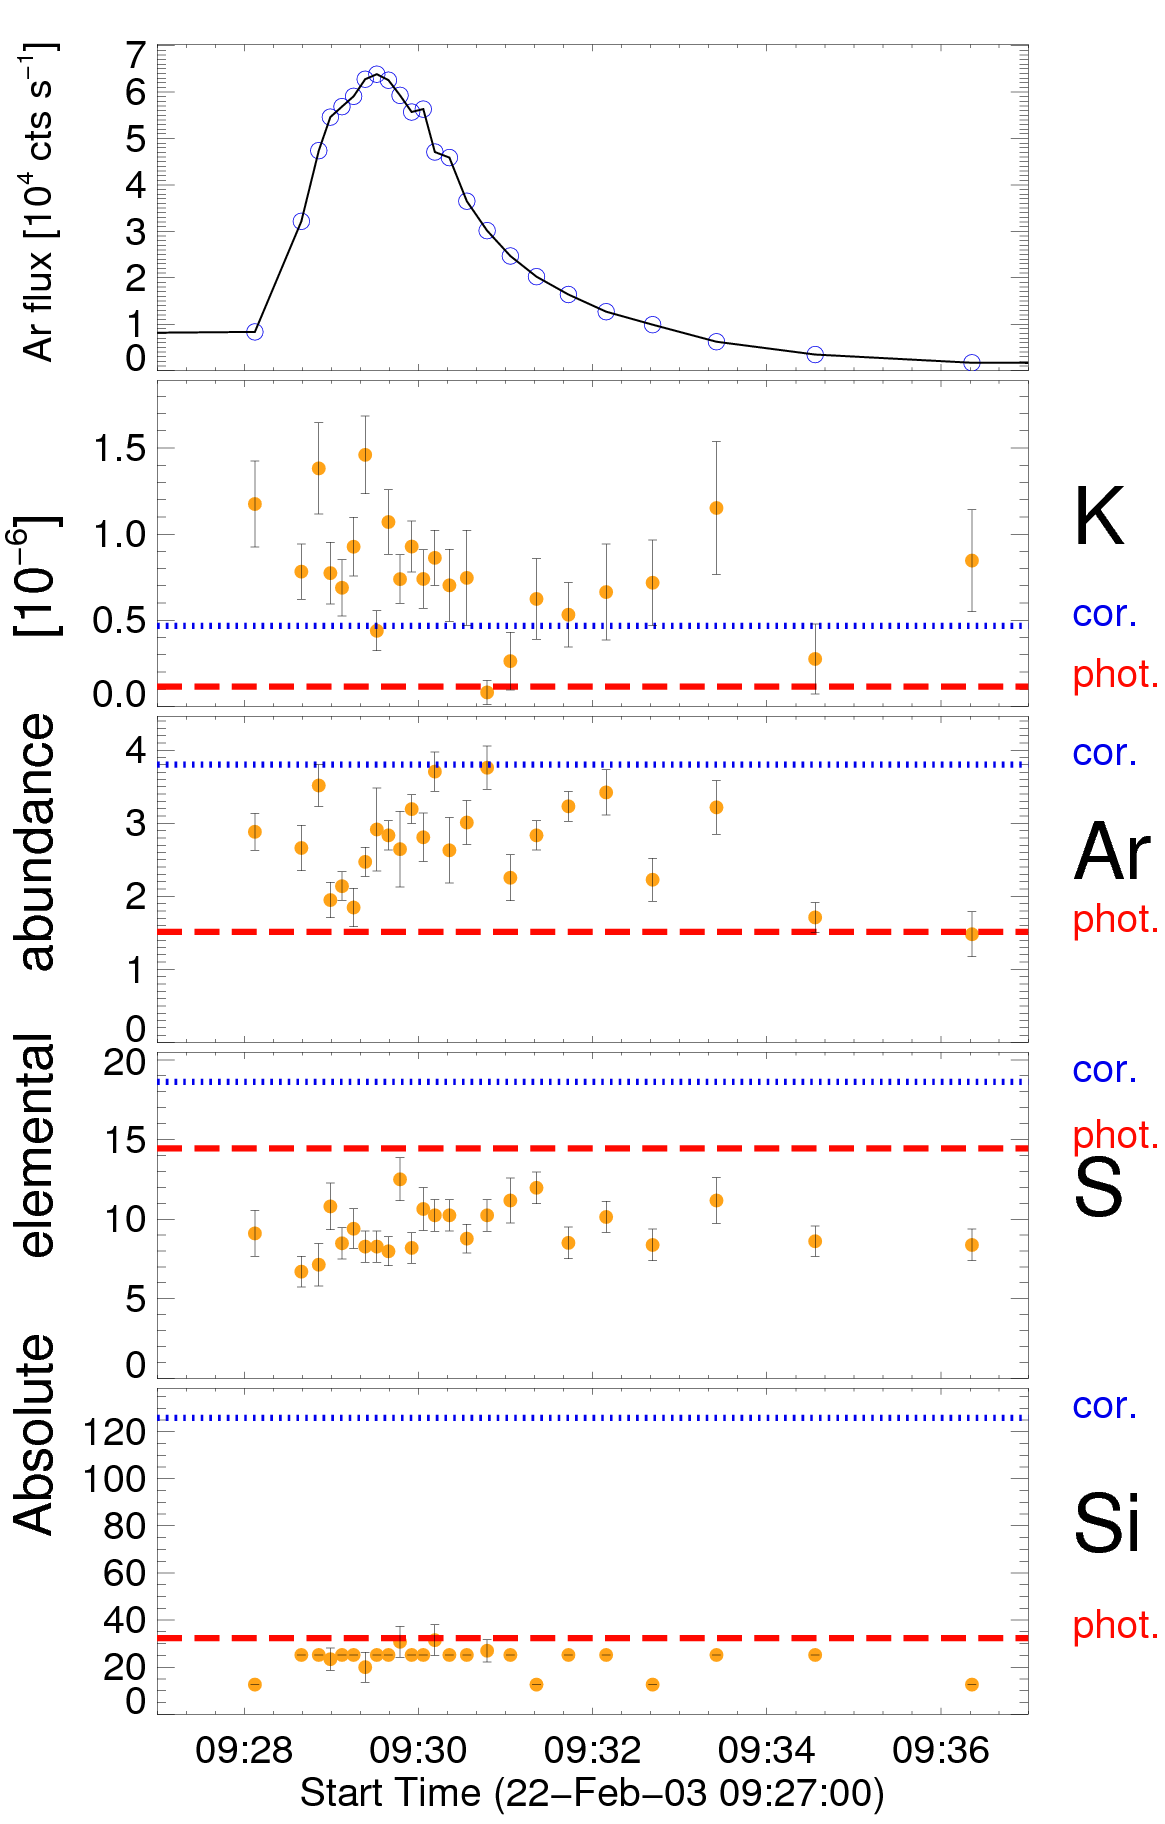
Figure 4: Time dependence of derived flare abundances. Two flares are shown in the figure in respective columns: a fast evolving flare on 2003 February 22 (left), and a "double" flare of 2003 January 9. In the upper part, the flare flux in the Ar spectral band is plotted for each flare. The uncertainties plotted correspond to the vertical extension of the iso-contours shown in Figure 3. Respective coronal and photospheric abundance levels are given for each element as dotted and dashed lines respectively.
Our non-standard determination technique is based on converging iterative
scheme, where we start from the measured value of a total (wavelength
integrated) flux in entire selected wavelength band including the lines of the
element of interest and substantial part of near-by continuum. A counterpart,
theoretically predicted fluxes in the same selected band depend on the assumed
plasma temperature, emission measure and the composition. By varying values of
the two parameters within the calculation cube, i.e. for a set of selected
temperatures and particular element abundances (40 linearly separated values
from "zero" up to four times the coronal abundance value of Feldman & Laming,
2000), we determine respective emission measure values from the measured band
fluxes. These values are next used to calculate the shape of synthetic spectrum
in each of the observed individual spectral bins contained in the analyzed band.
Such synthetic spectra are then compared with the observed spectra in terms of
the  statistics. This comparison
makes use of the measurement uncertainties in each spectral bin separately. By
performing the calculations for each of the mesh values of the 2D parameters
temperature-abundance (T - AEl) grid, we
construct the
statistics. This comparison
makes use of the measurement uncertainties in each spectral bin separately. By
performing the calculations for each of the mesh values of the 2D parameters
temperature-abundance (T - AEl) grid, we
construct the
![]() surface,
identify the position of its local minimum in the parameter space, and determine
the
surface,
identify the position of its local minimum in the parameter space, and determine
the
 contours
according to the classical approach of . Example result of the described
procedure is illustrated in Figure 2. As mentioned, the quality of the spectral
fits between the observed and synthetic spectra was characterized by the value
of
contours
according to the classical approach of . Example result of the described
procedure is illustrated in Figure 2. As mentioned, the quality of the spectral
fits between the observed and synthetic spectra was characterized by the value
of
![]() statistics which in the temperature (T - AEl)
parameter space is represented as a surface. The position of the minimum and the
shape of the
statistics which in the temperature (T - AEl)
parameter space is represented as a surface. The position of the minimum and the
shape of the
![]() contour provide a realistic estimate of the instantaneous value of average
temperature of formation for the line
and nearby continuum for each measured spectrum, as it evolves
throughout the flare. It is also possible to estimate the uncertainty of both
the temperature and abundance. For purposes of the spectral synthesis task, we
pre-calculated an extensive ~ 10 GB-database consisting of a grid of theoretical spectra, with
contour provide a realistic estimate of the instantaneous value of average
temperature of formation for the line
and nearby continuum for each measured spectrum, as it evolves
throughout the flare. It is also possible to estimate the uncertainty of both
the temperature and abundance. For purposes of the spectral synthesis task, we
pre-calculated an extensive ~ 10 GB-database consisting of a grid of theoretical spectra, with
 = 0.001Å,
for 101 temperatures between 1 - 100 MK, for 6 elements: K, Ar, Cl, S, Si and
Al, and for 41 abundance value of each element. The calculations were based on
CHIANTI v5.2 spectral code, a part of SolarSoft. The important
free-free and free-bound processes have all been included in the calculations of
the continuum. As checked by the continuum calculations following from CHIANTI
are in very good agreement (few percent) with the earlier results of . As these
two sets of calculations depend on independent approximations for the basic
atomic cross-sections, such a good agreement increases our confidence in derived
values of the abundances discussed in the present study.
= 0.001Å,
for 101 temperatures between 1 - 100 MK, for 6 elements: K, Ar, Cl, S, Si and
Al, and for 41 abundance value of each element. The calculations were based on
CHIANTI v5.2 spectral code, a part of SolarSoft. The important
free-free and free-bound processes have all been included in the calculations of
the continuum. As checked by the continuum calculations following from CHIANTI
are in very good agreement (few percent) with the earlier results of . As these
two sets of calculations depend on independent approximations for the basic
atomic cross-sections, such a good agreement increases our confidence in derived
values of the abundances discussed in the present study.
The other flare was much stronger with the two pronounced maxima. It was
possible to study its spectral variability each few seconds. In the Figure we
plot the abundance values for each element in question together with respective
 uncertainties. These uncertainties represent the size of the min
 contour from Figure 3, as projected onto the abundance axis. It is worth noting
that the results presented in Figure 3 show for the first time the plasma
composition variability during flares, as determined from spectroscopic
data.
contour from Figure 3, as projected onto the abundance axis. It is worth noting
that the results presented in Figure 3 show for the first time the plasma
composition variability during flares, as determined from spectroscopic
data.
Examination of Figure 4 and similar plots constructed for the other flares studied, allows us to draw a number of conclusions.
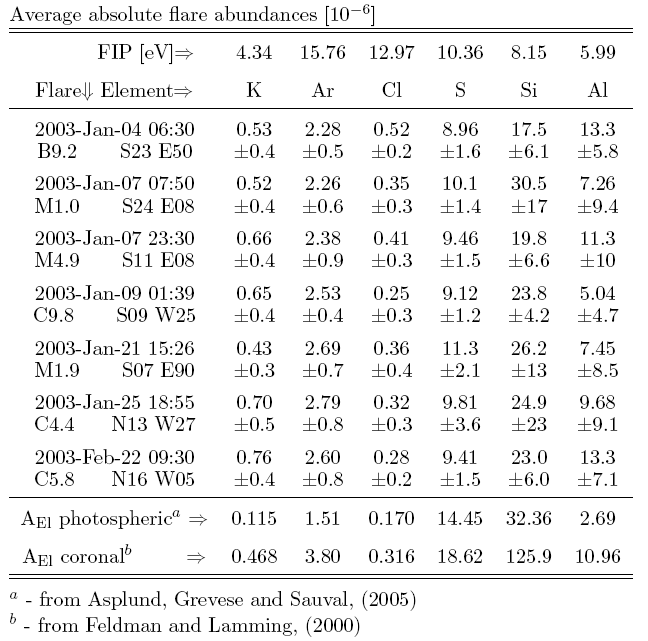
Based on the observed composition variability pattern for the analyzed flares,
it was possible to determine seven flare-averaged plasma abundance sets for
the six elements studied. These average values are given in Table 1,
together with formal
![]() uncertainties. The uncertainties were calculated taking into account the
scatter about the mean value. The uncertainties are large for cases where
the abundance appears to be time dependent.
uncertainties. The uncertainties were calculated taking into account the
scatter about the mean value. The uncertainties are large for cases where
the abundance appears to be time dependent.
Acknowledgements
RESIK is a common project between NRL (USA), MSSL and RAL (UK), IZMIRAN (Russia) and SRC (Poland). B.S and J.S. acknowledge support from the Polish Ministry of Education and Science grant 1.P03D.017.29.