Hard X-ray emission at the footpoints
of solar flares
aAstronomical
Institute of the Wrocław University, Wrocław, Poland
bSpace
Research Centre, Polish Academy of Sciences, Wrocław, Poland
b,cObservatoire
de Paris, Section de Meudon, LESIA, France
Abstract
We analyse X-ray flare observations made by the Soft X-ray Telescope and Hard
X-ray Telescope on the Yohkoh satellite during period 1999-2001. For
the strongest flares, when HXT imaging with high time cadence (0.5 - 1 sec) is
possible, clear changes in the asymmetry of the observed footpoints fluxes are
revealed. We present four examples of flares which illustrate such asymmetrical
time variations the best. Observed asymmetries are usually interpreted as due to
a difference in magnetic field strength or field divergence at the footpoints,
however this interpretation should lead to the existence of strong magnetic
field oscillations or movements of the footpoints' locations in the presence of
strong magnetic gradients. Our analysis indicates rather that either differences
in the electron injection or electron distribution in each loop's leg is the
source of the observed asymmetry variations. We discuss possible mechanisms
which may be responsible for such effect.
Keywords: Chromosphere; Corona; Flares; Magnetic fields; Hard
X-rays
1 Introduction
It is widely established from the Yohkoh Hard X-ray Telescope (HXT;
Kosugi et al., 1991) observations that, during the impulsive phase of a
solar flare, double (or multiple) hard X-ray sources often appear. They are
usually located on either side of the magnetic neutral line, suggesting that
they are magnetically connected, i.e. they are two footpoints of a single loop (Sakao
1994). These sources often tend to show asymmetry in hard X-ray emission where
the brighter source is usually located in a weaker photospheric magnetic field
region and vice versa (Sakao et al., 1996).
Double sources are interpreted as regions where non-thermal electrons
precipitate after travelling along the magnetic loop legs (Aschwanden
et al., 1999; Kundu et al., 1995; Li et al., 1997; Sakao, 1994). In such
scenario, a weaker magnetic field allows more electrons to reach the
chromosphere.
However, some flares do not fit the above scenario. Thus, of five flares
analysed by ] for which magnetograms were available, one has a brighter
footpoint located in the stronger photospheric magnetic field region.
Asai et al. (2002) also reported an example of a
flare for which the brighter footpoint was found in a stronger magnetic field.
Recently, Goff et al. (2004) have found seven other double source events in
which the brighter HXR (Hard X-Ray) footpoint is found in the region of stronger
magnetic field.
Qiu et al. (2001) observed remarkable changes in the asymmetry of
 footpoint emission during the impulsive phase of a flare on 2000 March 16.
Their observation indicates also changes in HXR emission (see their Figure 1)
from two sites spatially coincident with the
kernel, though the authors do not discuss this behavior. Alexander and Metcalf
(2002) found clear evidence for an energy-dependent HXR asymmetry in a flare on
2002 March 17. They also found that the asymmetry shows a transition from the
clear dominance of one footpoint to clear dominance of the other later during
the flare impulsive phase. However, both these
papers were based only on two and three images respectively.
footpoint emission during the impulsive phase of a flare on 2000 March 16.
Their observation indicates also changes in HXR emission (see their Figure 1)
from two sites spatially coincident with the
kernel, though the authors do not discuss this behavior. Alexander and Metcalf
(2002) found clear evidence for an energy-dependent HXR asymmetry in a flare on
2002 March 17. They also found that the asymmetry shows a transition from the
clear dominance of one footpoint to clear dominance of the other later during
the flare impulsive phase. However, both these
papers were based only on two and three images respectively.
We have found another example of a flare in which there is a marked asymmetry,
with first one, then the other footpoint being dominant alternately several
times during the impulsive phase (Siarkowski and Falewicz, 2004). In this paper
we briefly describe this event, reanalysing observations of Qiu et al. (2001),
and present two other examples of flares in which the asymmetry changed markedly
with time.
2 Observations
Hard X-ray images of the flare were obtained with the
Yohkoh/HXT and reconstructed using the standard pixon reconstruction
procedure (Metcalf et al. 1996). We used variable accumulation times assuming a
threshold count rate of 200 counts in the M2 band (33-53 keV), giving a range of
accumulation times from about 0.5 - 1.0 seconds during the flux maximum. The
restored images are presented in Figures 1 (left panel), 3, 5, and 7. The fluxes
in the individual footpoints were obtained from the reconstructed images for
three HXT channels: M1, M2 and H.
We defined flux asymmetry by A = (F2 - F1)/(F1 +
F2) where F1 and F2 are the fluxes at footpoints 1 and 2
respectively. For full symmetry F1 = F2, and A = 0; for perfect
asymmetry A = +1 or -1.
The obtained values of asymmetries for analysed events are presented in Figures
2, 4, 6 and 8. The vertical bars in these Figures show the statistical errors of
the fluxes and asymmetry. Errors of the fluxes were derived from the
uncertainties provided by the pixon reconstruction algorithm (Metcalf
et al., 1996). They represent the statistical errors only, and do not
represent any systematic errors which might be caused by the reconstruction
itself.
2.1 25-August-2001
The first analysed flare (for more details see Siarkowski & Falewicz 2004)
occurred on 25 August 2001, with a GOES peak intensity of X5.3.
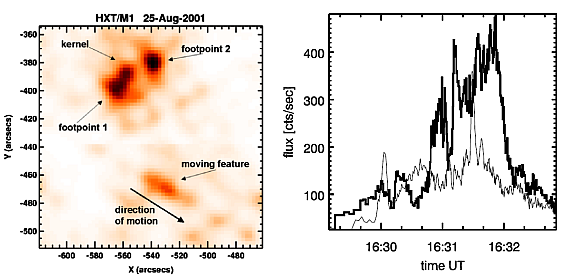
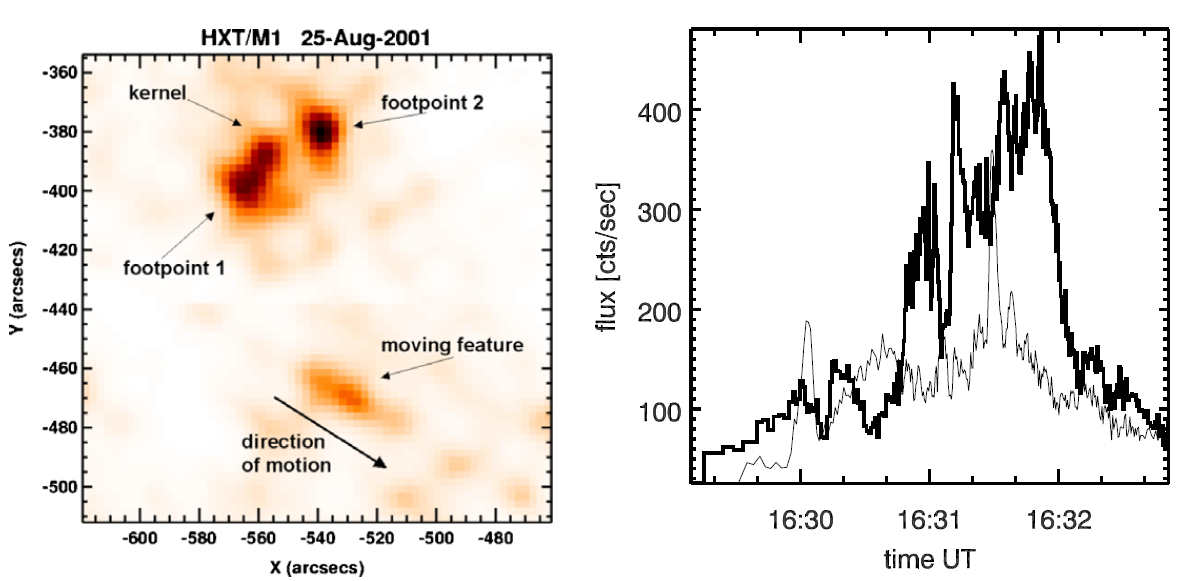
Figure 1: Hard X-ray emission
sources in M1 channel of
Yohkoh/HXT on the 25 August 2001 flare (left panel). The light curves of the
hard X-ray footpoint sources obtained (right panel). Strong quasi-periodic
oscillations are seen. The thin line corresponds to the footpoint's 1 flux and
thick to the footpoint 2.
The Yohkoh satellite observed this flare from 16:18 UT, during four
consecutive orbits up to about 22:00 UT. Figure 1 shows an image obtained
from the HXT/M1 channel (23-33 keV) flux integrated over the period 16:28 -
16:33 UT. Two main structures are evident: the first we interpret as a flare
loop and the second as moving feature. Between 16:28 and 16:32 UT two bright
footpoints were seen in the flare loop. After 16:32 UT a bright loop-top
source developed.
The white-light emission of this flare has been analysed in detail by Metcalf et
al. (2003).
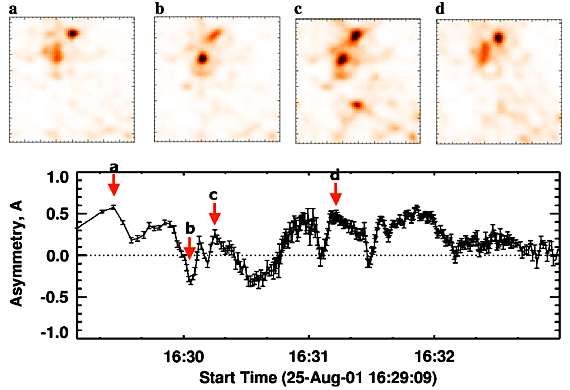
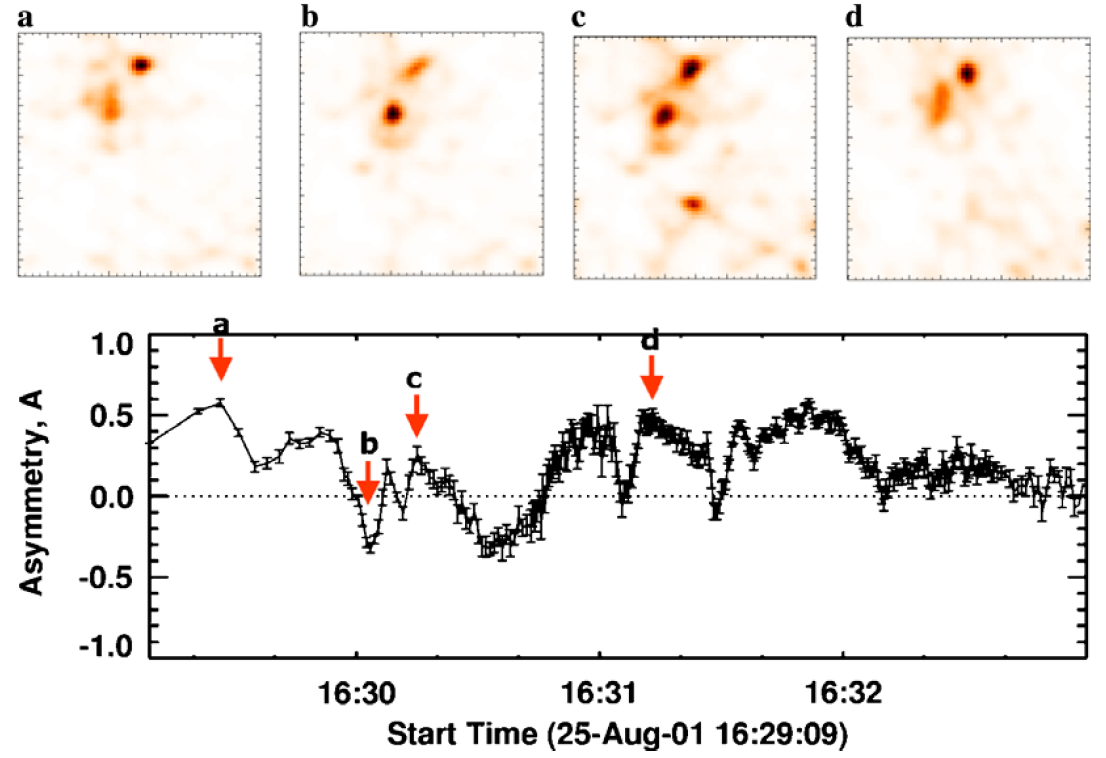
Figure 2: Upper panel: Images of
the flare in HXT/M1 channel for the selected moments of time. Lower panel: Time
profiles of the footpoints' asymmetry for HXT channel M1. The arrows indicate
the times of the images a, b, c and d.
Each footpoint source in Figure 1 indicates fluctuations in both flux and
position. Figure 1 (right panel) presents the light-curves for each footpoint as
obtained for channel M1. The observed variations are very obvious as seen in a
movie obtained from the reconstructed images. Figure 2 presents four images from
this movie obtained at channel M1 at 16:29:26, 16:30:03, 16:30:15 and 16:31:12
UT respectively (upper panel) and the asymmetry for footpoints 1 and 2 (lower
panel). Strong variations of asymmetry can be seen in the range from -0.3 to
+0.6. Changes of the asymmetry are similar in all the channels but they are the
strongest in the channel H.
Using the SOHO/MDI magnetogram we also estimated the footpoints' magnetic
flux. During the entire event one of the footpoints indicates for a larger
magnetic field than the other; the corresponding ratio was greater than 2. So
motion of the loop footpoints in the presence of the magnetic field gradient
cannot explain the observed strong asymmetry variations (Siarkowski & Falewicz
2004).
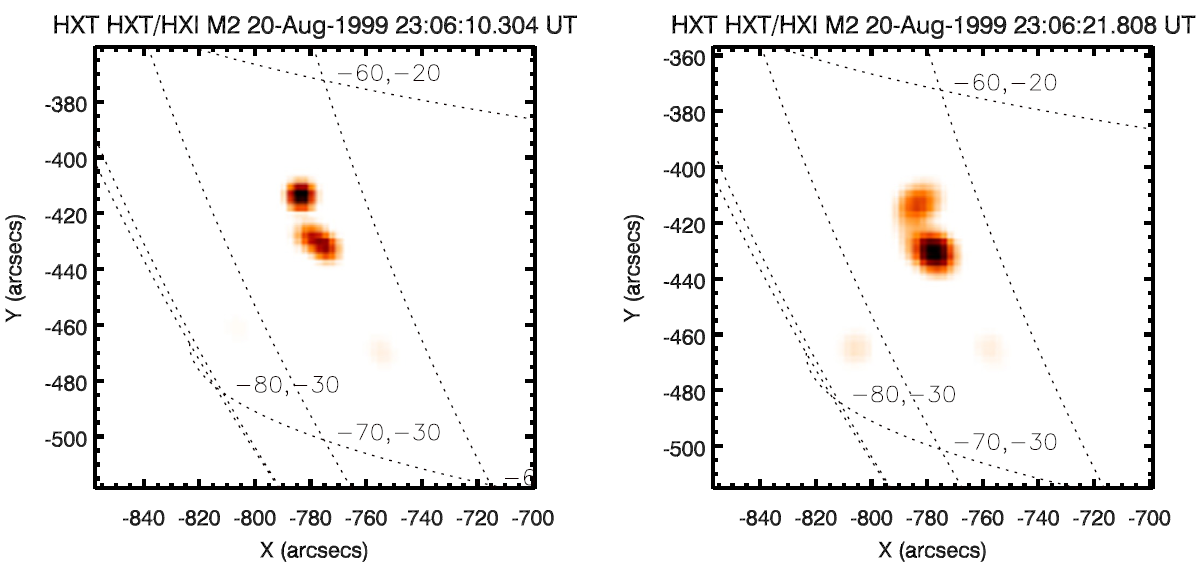
2.2 20-August-1999
The second analysed flare occurred on 20 August 1999 in NOAA 8673 active region
(S17 E81), with a GOES peak intensity of M9.8. The
Yohkoh satellite observed this flare from about 22:30 UT to 23:20 UT.
Yohkoh/HXT recorded strong emission in all of the four channels during the
impulsive phase. For example, emission in the channel H (53-93 keV) reached a
maximum flux as high as 788 counts/sec/subcollimator at 23:06:10 UT. Figure 3
shows images obtained from the M2 channel (33-53 keV) at 23:06:10 and 23:06:22
UT. Two structures, interpreted as two bright footpoints, were seen in the soft
X-ray (SXR) flare loop.
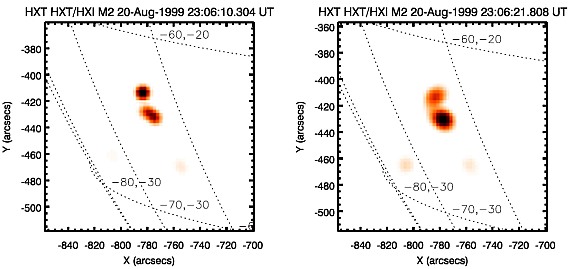 Figure 3: Images of the emission in the
HXT/M2 channel for the 20 August 1999 flare taken during the time when the
asymmetry was strong.
Figure 3: Images of the emission in the
HXT/M2 channel for the 20 August 1999 flare taken during the time when the
asymmetry was strong.
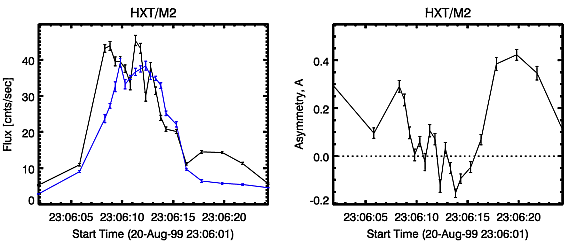
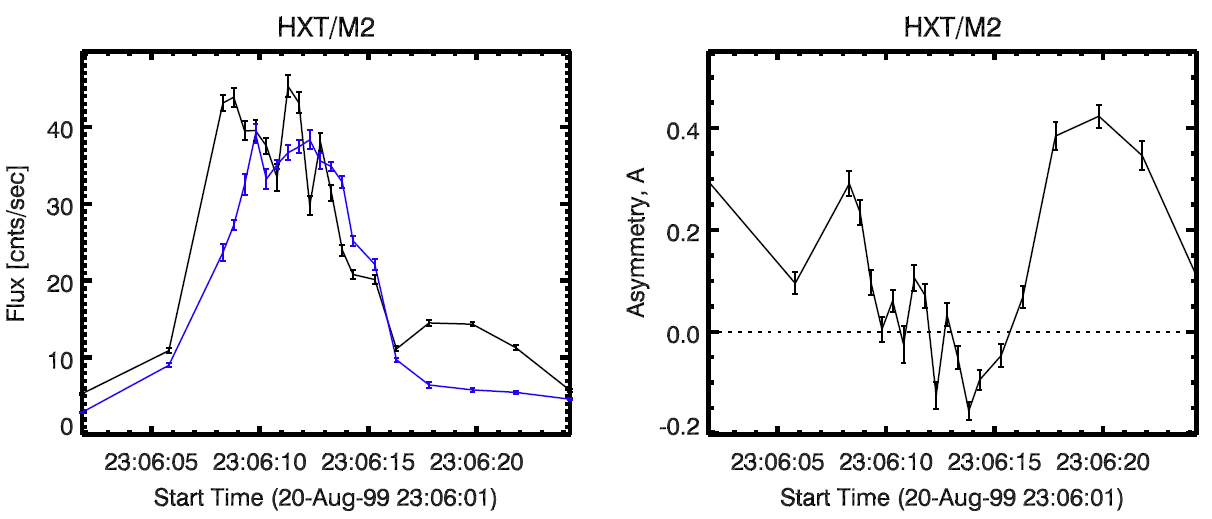
Figure 4: Light-curves of hard
X-ray footpoint sources obtained in the M2 channel of HXT for the 20 August 1999
flare (left panel). Strong quasi-periodic oscillations are seen. Right panel
shows the time profile of the footpoints' asymmetry for HXT channel M2.
Both footpoint sources in Figure 3 show large fluctuations in the HXR fluxes.
Time variations of this fluxes are shown in Figure 4 (left panel). Strong time
variations of the asymmetry can be seen in the range A = -0.2/+0.4 (see
Figure 4 - right panel). Changes of the asymmetry are similar in all the
channels but they are the strongest in the channel M2.
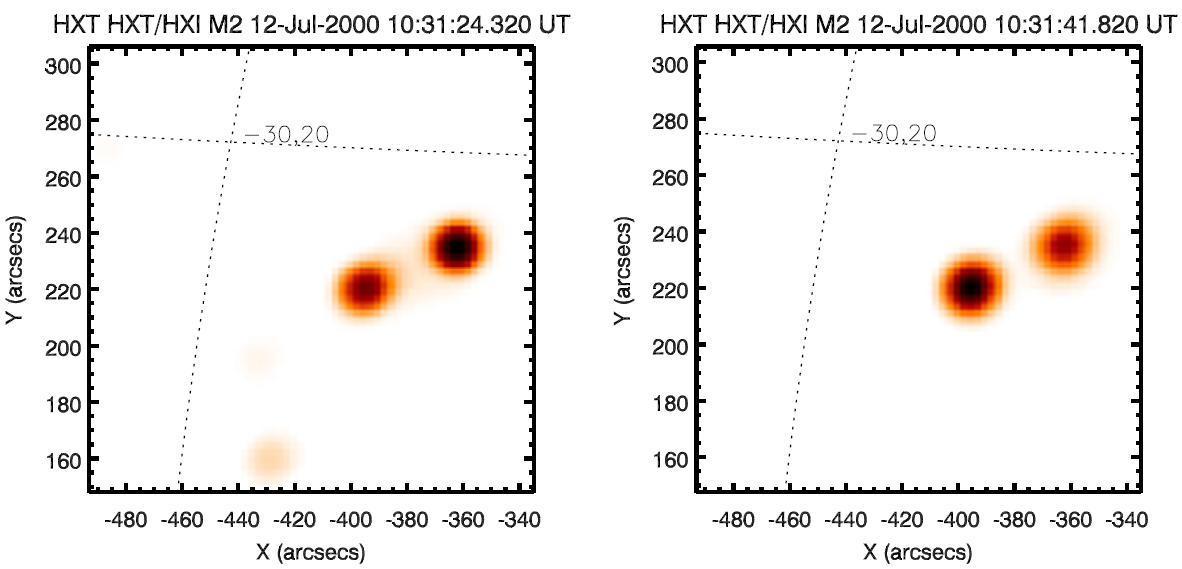
2.3 12-July-2000
The third analysed flare occurred on 12 July 2000 in the NOAA 9077 active region
(N17 E27), with a GOES peak intensity of X1.9. The
Yohkoh satellite observed this flare from about 09:55 UT, during one
orbit up to about 10:55 UT. Yohkoh/HXT recorded strong emission in all
of the four channels during the impulsive phase. For example, emission in the
channel H (53-93 keV) reached a maximum flux as high as 181
counts/sec/subcollimator at 10:31:20 UT.
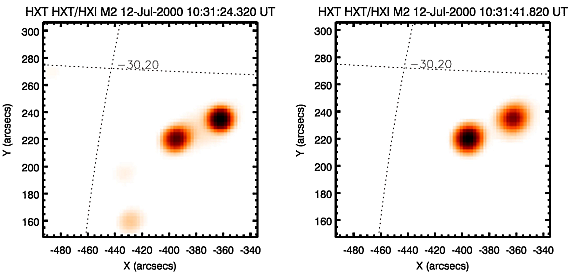 Figure 5: Images of the emission in the
HXT/M2 channel for the 12 July 2000 flare taken during the time when the
asymmetry was strong.
Figure 5: Images of the emission in the
HXT/M2 channel for the 12 July 2000 flare taken during the time when the
asymmetry was strong.
Figure 5 shows images obtained from the M2 channel (33-53 keV) at 10:31:24 and
10:31:42 UT when the asymmetry was strongest. Two structures, interpreted as two
bright footpoints, are seen. The loop top is evident in soft X-ray emission.
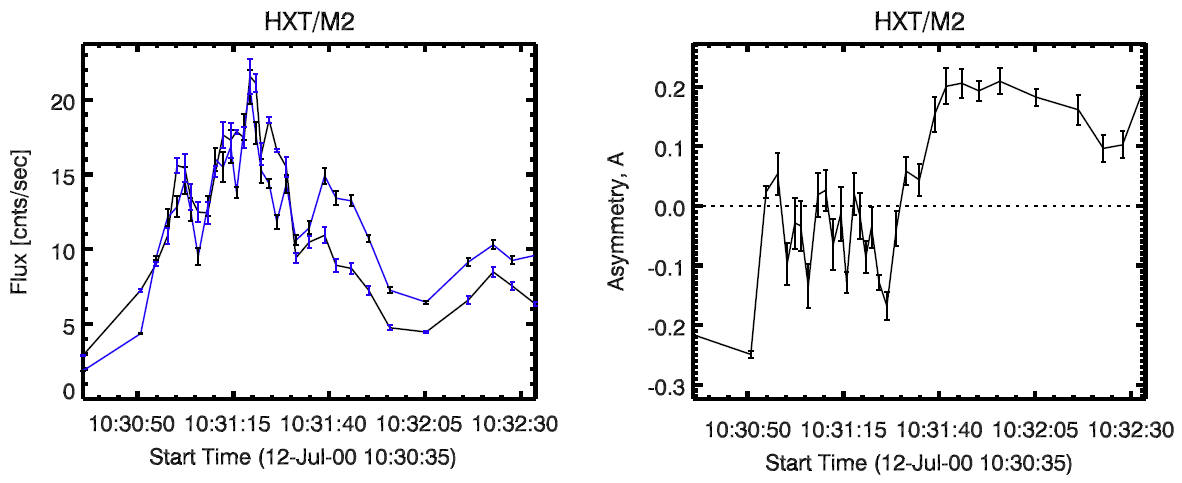
Both footpoint sources in Figure 5 indicate clear fluctuations in HXR fluxes.
Time variations of this fluxes are shown in Figure 6. Strong time variations of
the asymmetry can be seen in the range A = ±0.25 (see Figure 6 - right panel). Changes of the asymmetry are similar in all
the channels but they are the strongest in the channel M2.

Figure 6: Light-curves of hard
X-ray footpoint sources obtained in the M2 channel of HXT for the 12 July 2000
flare (left panel). Strong quasi-periodic oscillations are seen. Right panel
shows the time profile of the footpoints' asymmetry for HXT channel M2.
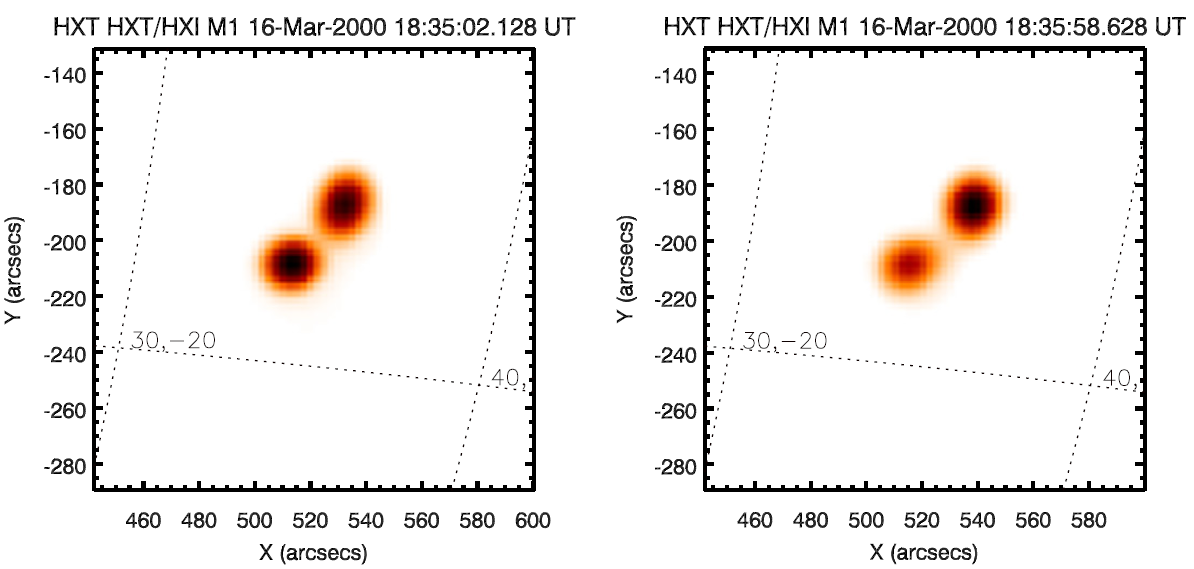
2.4 16-March-2000
The fourth analysed flare occurred on 16 March 2000 in NOAA 8906 active region
(S17 W34), with a GOES peak intensity of C9.0. The
Yohkoh satellite observed this flare from about 18:00 UT to 19:00 UT.
Yohkoh/HXT recorded emission in all of the four channels during the
impulsive phase. For example, emission in the channel H (53-93 keV) reached a
maximum flux as high as 12 counts/sec/subcollimator at 18:35:12 UT. This flare
was also analysed by Qiu et al. (2001). The authors investigated a strong
changes in the asymmetry of Ha footpoint emission, but not discussed asymmetry behavior in the HXR emission.
Figure 7 shows two images obtained from the M1 channel (23-33 keV) for two
times: 18:35:02 UT and 18:35:59 UT (when the asymmetry was strongest). Two
structures, interpreted as two bright footpoints, are seen. Both footpoint
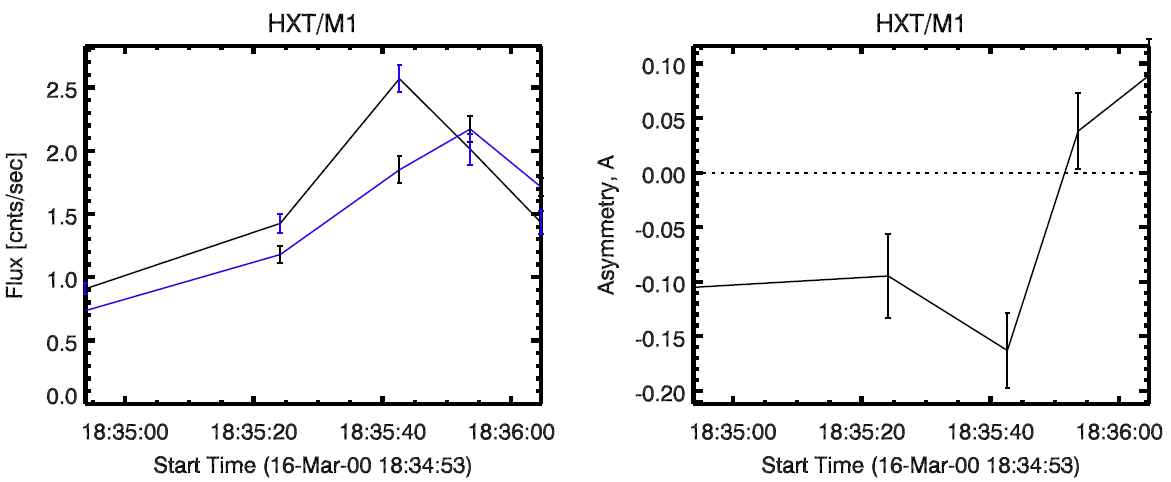
sources presented in Figure 7 indicated clear fluctuations in HXR fluxes as
shown in Figure 8. Strong time variations of the asymmetry can be seen in the
range A = -0.16/+0.09 (see Figure 8 - right panel). Changes of the asymmetry are
similar in three channels (L, M1 and M2) but they are the strongest in the
channel M1.
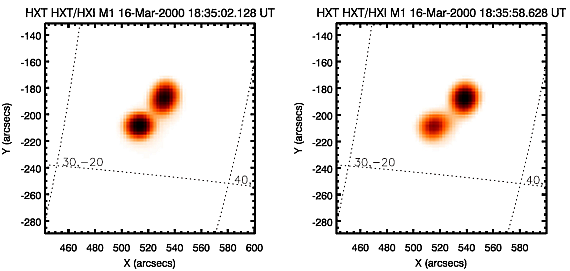 Figure 7: Images of the emission in the
HXT/M1 channel taken for the 16 March 2000 flare during the time when the
asymmetry was strong.
Figure 7: Images of the emission in the
HXT/M1 channel taken for the 16 March 2000 flare during the time when the
asymmetry was strong.
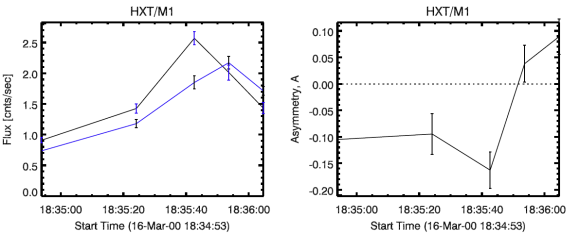
Figure 8: Light-curves of hard
X-ray footpoint sources obtained in the M1 channel of HXT for the 16 March 2000
flare (left panel). Right panel presents the time profile of the footpoints'
asymmetry for HXT channel M1.
3 Discussion and conclusions
We have analysed four flares for which clear asymmetry footpoint variations are
observed with good time cadence. The present analysis allows us to draw the
following conclusions.
Usually the brighter emission of the footpoint is related with the weaker
magnetic field convergence (e.g., Sakao 1994), i.e in stronger magnetic field
more electrons are reflected in the magnetic mirror back into the top of the
loop. However, there are many examples of flares that do not fit with the above
interpretation (Sakao 1994, Asai et al. (2002), Goff et al. (2004)).
Additionally, there are also examples of flares for which time variations of the
asymmetry are observed (this paper, Siarkowski & Falewicz 2004). Observed time
variation of asymmetry may be interpreted as differences in the injection
conditions and/or the electron distribution in each loop's leg. A plausible
candidate for an asymmetric source of energy release may be turbulent kernel
located near the top of the flaring loop. In such a kernel, electrons moving
along the loop legs (and emitting HXR at footpoints) are produced at small-scale
reconnection sites, independently in both legs of the loop (Jakimiec et al.
1998). The observed changes in asymmetry can tell us about the time or spatial
scale or the number of these elementary processes. A possible way in which this
mechanism may occur is a configuration in which the magnetic field containing
the flaring plasma is stressed. This process could continue to occur as long as
the magnetic pressure in the region of MHD turbulence is higher than plasma
pressure. In this state, electrons are still accelerated in the stressed,
turbulent plasma until its pressure reaches the magnetic pressure, when plasma
ejection would occur. This process can be repeated in a quasi-periodic manner
producing local maxima in the hard X-ray emission and microwaves, until the
magnetic energy is exhausted. This is generally in good agreement with
observations (Aschwanden and Güdel,
1992; Kundu et al., 1994).
Another possibility which can explain time variations of asymmetry are
oscillations of the whole flare loops system. Such oscillations can lead to time
changes of the convergence of the magnetic field lines highly in the loop
independently on the magnetic field strength in their footpoints. Finally,
theoretical simulations of the particle trajectories in a reconnecting region in
a 3-D magnetic field topology (Zharkova and Gordowsky, 2004) indicate strong
asymmxetric accelerations. Depending on the ratio of the magnetic field
components, different proportions of electrons and protons can be injected into
the different legs of the reconnecting loops.
Acknowledgements
We are grateful to unknown referees for useful comments and suggestions. We also
thank to K.J.H. Phillips for reading the manuscript. RF has been supported by
the grant No. 2 P03D 001 23 of the Polish Committee of Scientific Research. MS
has been supported by the Polish Committee of Scientific Research, grant number
PBZ KBN 054/P03/2001. AB has been partially supported by the European Commission
through the RTN programme (European Solar Magnetism Network, contract
HPRN-CT-2002-00313).
References
- Asai, A., Masuda, S., Yokayama, T., Shimojo, M., Isobe, H., et
al.,Difference between Spatial Distributions of the Halpha Kernels and Hard
X-Ray Sources in a Solar Flare, 2002, ApJ, 578, L91-L94
-
Aschwanden, M.J., & Güdel, M., The coevolution of decimetric millisecond spikes
and hard X-ray emission during solar flares, 1992, ApJ, 401, 736-753
-
Aschwanden, M.J., Fletcher, L., Sakao, T., Kosugi, T., & Hudson, H.,
Deconvolution of Directly Precipitating and Trap-precipitating Electrons in
Solar Flare Hard X-Rays. III. YOHKOH Hard X-Ray Telescope Data Analysis,
1999, ApJ, 517, 977-989
-
Goff, C. P., Matthews, S. A., van Driel-Gesztelyi, L., Harra, L. K., Relating
magnetic field strengths to hard X-ray emission in solar flares, 2004, A&A,
423, 363-372
-
Jakimiec, J., Tomczak, M., ., Falewicz, R., Phillips, K. J. H., & Fludra, A.,
The bright loop-top kernels in YOHKOH X-ray flares, 1998, A&A, 334,
1112-1122
- Kosugi, T., Masuda, S., Makishima, K., Inda, M., Murakami, et al., The
hard X-ray telescope (HXT) for the Solar-A mission, 1991, Solar Phys., 136,
17-36
-
Kundu, M.R., White, S.M., Gopalswamy, N., & Lim, J., Millimeter, microwave, hard
X-ray, and soft X-ray observations of energetic electron populations in solar
flares, 1994, ApJS, 90, 599-610
- Kundu, M. R., Nitta, N. White, S. M., Shibasaki, K., Enome, et al.,
Microwave and Hard X-Ray Observations of Footpoint Emission from Solar
Flares, 1995, ApJ, 454, 522-530
-
Li, J., Metcalf, T. R., Canfield, R. C., Wülser, J. P., What Is the Spatial
Relationship between Hard X-Ray Footpoints and Vertical Electric Currents in
Solar Flares ?, 1997, ApJ, 482, 490-497
-
Metcalf, T. R., Hudson, H. S., Kosugi, T., et al., Pixon-based Multiresolution
Image Reconstruction for Yohkoh's Hard X-Ray Telescope, 1996, ApJ, 466, 585-594
- Metcalf, T. R., Alexander, D., Hudson, H. S., Longcope, D. W.,
TRACE and YOHKOH Observations of a White-Light Flare , 2003, ApJ,
595, 483-492
- Qiu, J., Ding, M. D., Wang, H.,Gallagher, P. T., Sato, J., Denker, C.,
Goode, P. R., Asymetric Behavior of Ha Footpoint Emission During the Early Phase of an Impulsive Flare, 2001, ApJ,
554, 445-450
- Sakao, T., Characteristics of solar flare hard X-ray sources as revealed
with the Hard X-ray Telescope aboard the Yohkoh satellite, 1994, Ph.D.
thesis, University of Tokyo
- Sakao, T., Kosugi, T., Masuda, S., Yaji, K., Inda-Koide, M., and
Makishima, K., Characteristics of hard X-ray double sources in impulsive
solar flares, 1996, Adv. Space Res., 17, 67-70
-
Siarkowski, M. & Falewicz, R., Variations of the hard X-ray footpoints asymmetry
in a solar flare, 2004, A&A, 428, 219-226
-
Zharkova, V. and Gordovsky, M., Particle Acceleration Asymmetry in a
Reconnecting Nonneutral Current Sheet, 2004, ApJ, 604, 884-891
BACK