pp. 165-168 2006
1Solar Physics Division, Space Research
Center, Polish Academy of Sciences, 51 622 Wroclaw, Kopernika 11, Poland 2Mullard Space Science Laboratory, Holmbury
St Mary, Surrey RH5 6NT, UK
Keywords. Sun: fares, X-rays, spectroscopic plasma diagnostic.
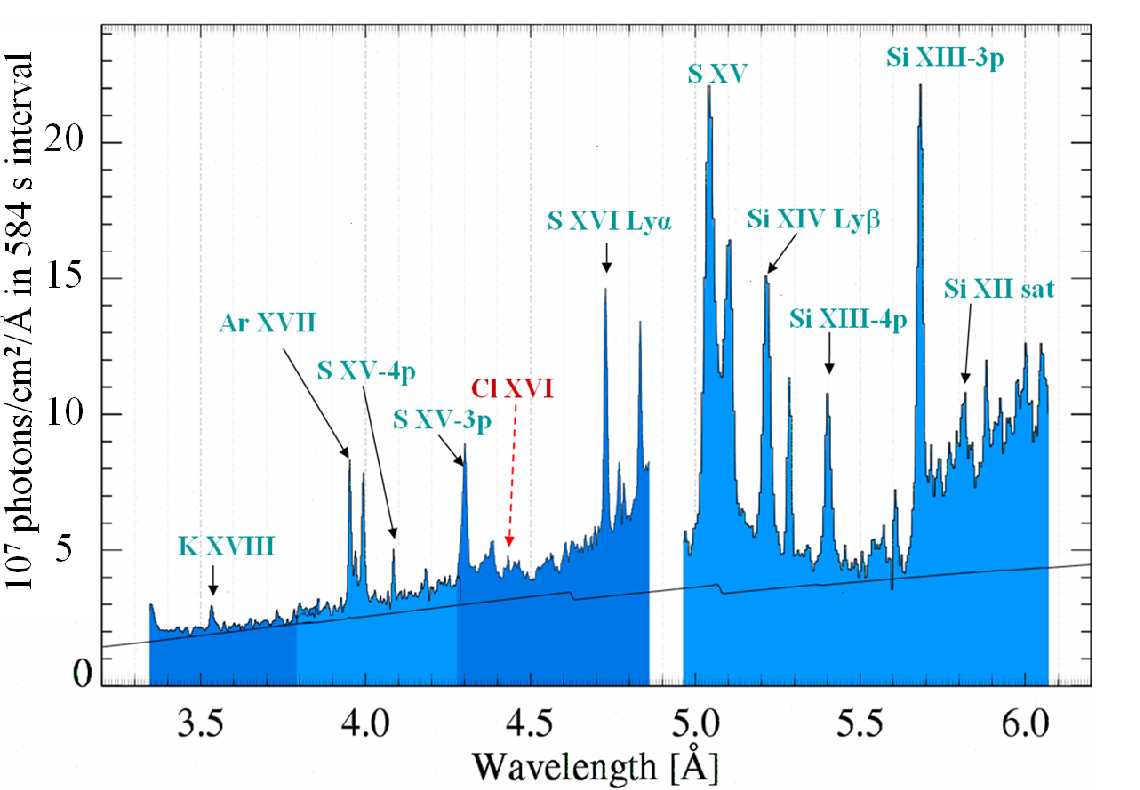
Figure 1: The absolute RESIK spectrum of the 2003 February 22 flare. The most prominent lines are marked. Individual spectral channels are shown in slightly different semi-tones. The thin line at the base of the lines represents the real continuum as calculated based on the temperature and emission measure determined in the isothermal approximation based on channel 1 and channel 4 flux ratio (T=8.9 MK, EM=8×1048 cm-3). The spectrum has been integrated over 584 s, covering the entire flare.
The RESIK consists of two double-channel X-ray spectrometers, designed to observe solar active region and flare plasmas. The nominal wavelength coverage of RESIK is 3.35 Å - 6.1 Å . The detailed description of the instrument, its operation and calibration is presented in the paper by Sylwester, Gaicki, Kordylewski, et al. (2005). We have calibrated the measured spectra, establishing an absolute wavelength scale and determining the absolute photon fluxes. This made it possible to identify several spectral features, some of which were observed for the first time from astrophysical plasmas. In particular we have detected lines due to highly ionized chlorine (see Sylwester, Sylwester, Siarkowski,et al. (2004)). The observed line intensities can be used in order to study the physical conditions in the flaring plasma as well as to investigate its composition. It is now generally accepted that the coronal abundances of elements with first ionization potential (FIP) less than 10 eV (low-FIP) can reach the values much higher than photospheric values relative to those of high-FIP (so called FIP effect). The evidence of diversified FIP effect in the other stars is presented in the paper by Garcia-Alvarez, et al. (2006). In the RESIK spectra one can find lines belonging to the elements with substantially different values of FIP (from K with FIP = 4.34 eV through S with FIP = 10.36 eV to Ar with FIP = 15.75 eV). In the present analysis, we consider in more details the determination of basic flaring plasma characteristics in preparation for the subsequent study of the plasma composition and detailed role of FIP effect in this respect.
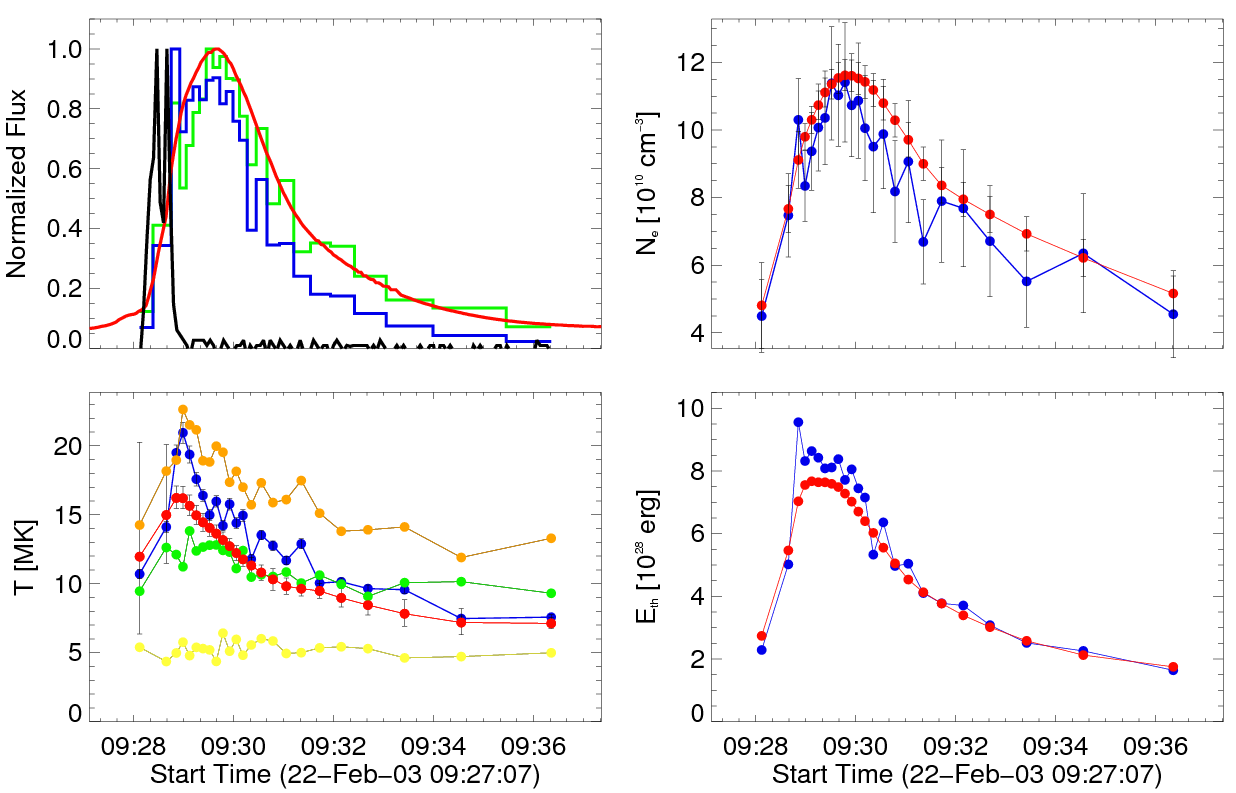
Figure 2: Upper left: The normalized lightcurves for the flare on 2003 February 22. The GOES 1 - 8 Å, lightcurve is shown as smooth solid line, the RHESSI 25-50 keV as heavy, the RESIK short wavelength (3.35-3.8 Å) and long wavelength (5.0 -6.05 Å) channels are shown as darker and lighter gray histograms respectively. Lower left: The time variability of the temperature as determined in the isothermal approximation based on the flux ratio technique from different pairs of fluxes (see the text). Upper right: The corresponding plots of density variations (open and full circles for GOES and RESIK respectively) as determined using the estimate of the source extend from RHESSI reconstructed image. Lower right: Plot of plasma thermal energy content for the analyzed flare obtained from GOES (open circles) and RESIK.
The main spectral features characteristic for individual channels are
identified. In the first RESIK channel it is K XVIII
triplet in the range 3.53 Å - 3.58 Å.
At the wavelength of 3.73 Å the
weak
 line of Ar
XVIII is seen. In the second channel, prominent line
features in the range 3.94 Å - 4.05 Å are
identified as belonging to the Ar XVII triplet and
to 1s2-1s4p transition in S XV ion at 4.08 Å .
In the third channel a strong line seen at the edge (4.3 Å )
corresponds to 1s2 - 1s3p transition in S XV
He-like ion. Near the other edge of this channel (at 4.7 Å )
the S XVI
line appears. In the fourth
channel the S XV triplet lines are seen in the range 5.0 Å - 5.12 Å ,
as do the strong lines of Si XIII (1s2 - 1s3p
and 1s2 - 1s4p transitions at 5.68 Å and
5.4 Å). In addition,
one can see in this channel a line corresponding to the transition 1s-3p
line of Ar
XVIII is seen. In the second channel, prominent line
features in the range 3.94 Å - 4.05 Å are
identified as belonging to the Ar XVII triplet and
to 1s2-1s4p transition in S XV ion at 4.08 Å .
In the third channel a strong line seen at the edge (4.3 Å )
corresponds to 1s2 - 1s3p transition in S XV
He-like ion. Near the other edge of this channel (at 4.7 Å )
the S XVI
line appears. In the fourth
channel the S XV triplet lines are seen in the range 5.0 Å - 5.12 Å ,
as do the strong lines of Si XIII (1s2 - 1s3p
and 1s2 - 1s4p transitions at 5.68 Å and
5.4 Å). In addition,
one can see in this channel a line corresponding to the transition 1s-3p  in Si XIV ion at 5.21 Å.
In the analyzed spectral region many strong dielectronic lines formed in He-like
ions are evident. These lines have not often been discussed in the literature as
diagnostics of the solar flare plasma. They include, in particular, the 5.818 Å and
5.565 Å satellite
lines of Li-like ion Si
XII. For more details about these lines' diagnostic use
see Phillips, et al.
(2006). Having so many lines and the continuum at our disposal, we
can select a number of suitable pairs of lines (or bands) fluxes in order to
investigate the temperature of the plasma under isothermal approximation.
Example results are presented in the left lower panel of figure 2. In this
figure, the temperatures (lower left plot) obtained from 3 s GOES data
are shown also for the comparison (densely packed full points). The top plot
with dark grey points presents the temperature changes as determined from the
flux ratio of the strongest S XVI and S
XV lines, while the second from bottom plot is the temperature from the
flux ratio of the strongest Si xiv and Si XIII
lines. The second from the top plot represents temperature as determined from
the ratio of wavelength-integrated fluxes measured in the first and fourth RESIK
channels. The bottom plot is that of temperatures derived from the flux ratio of
dielectronic (Si XII) to parent (Si
XIII) lines. This line ratio is a good indicator of the
temperature for a cooler plasma component (Phillips,
et al.
(2006)). From the emission measures corresponding to each of the
temperature determinations, plasma densities can be derived based on the spatial
extent of the source (taken in this case from RHESSI images to be
FWHM = 3.8×108 cm). These derived densities are plotted in the right
upper panel of the Figure for GOES and RESIK. It is seen that the
density values obtained are consistent between these two instruments. From this
plot, it follows that the flare hot plasma source was rather dense (
~ 1011cm-3), especially during the maximum phase.
in Si XIV ion at 5.21 Å.
In the analyzed spectral region many strong dielectronic lines formed in He-like
ions are evident. These lines have not often been discussed in the literature as
diagnostics of the solar flare plasma. They include, in particular, the 5.818 Å and
5.565 Å satellite
lines of Li-like ion Si
XII. For more details about these lines' diagnostic use
see Phillips, et al.
(2006). Having so many lines and the continuum at our disposal, we
can select a number of suitable pairs of lines (or bands) fluxes in order to
investigate the temperature of the plasma under isothermal approximation.
Example results are presented in the left lower panel of figure 2. In this
figure, the temperatures (lower left plot) obtained from 3 s GOES data
are shown also for the comparison (densely packed full points). The top plot
with dark grey points presents the temperature changes as determined from the
flux ratio of the strongest S XVI and S
XV lines, while the second from bottom plot is the temperature from the
flux ratio of the strongest Si xiv and Si XIII
lines. The second from the top plot represents temperature as determined from
the ratio of wavelength-integrated fluxes measured in the first and fourth RESIK
channels. The bottom plot is that of temperatures derived from the flux ratio of
dielectronic (Si XII) to parent (Si
XIII) lines. This line ratio is a good indicator of the
temperature for a cooler plasma component (Phillips,
et al.
(2006)). From the emission measures corresponding to each of the
temperature determinations, plasma densities can be derived based on the spatial
extent of the source (taken in this case from RHESSI images to be
FWHM = 3.8×108 cm). These derived densities are plotted in the right
upper panel of the Figure for GOES and RESIK. It is seen that the
density values obtained are consistent between these two instruments. From this
plot, it follows that the flare hot plasma source was rather dense (
~ 1011cm-3), especially during the maximum phase.
Based on the temperature, emission measure and the volume of the emitting region one can calculate the thermal energy content (see the lower right panel in figure 2) using the following equation:
Using a full set of line fluxes (several) observed instantaneously by RESIK one can calculate momentary distributions of the plasma with temperature (i.e. DEM - differential emission measure distributions) for particular flare phases. In figure 3 the results of such calculations are presented for the rise, maximum and decay phase of the analyzed flare of 2003 February 22 at 09:39 UT. DEM calculations have been performed using Withbroe-Sylwester maximum likelihood algorithm. It is seen that the flaring plasma is concentrated into two distinguishable temperature components. Notice that the ratios of emission measure in the hotter and cooler components vary markedly depending on the phase of the flare.
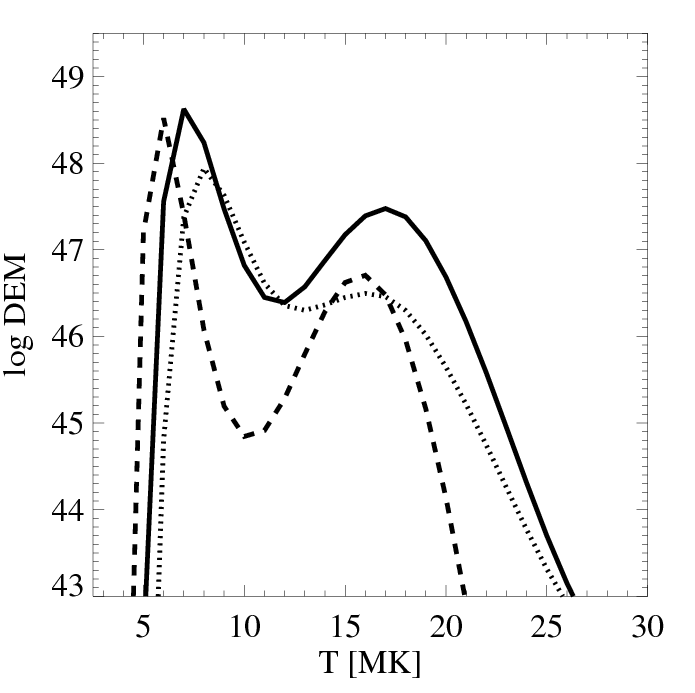
Figure 3: The temperature distribution of the differential emission measure (DEM) for the analyzed flare on 2003 February 22. Dotted, solid and dashed lines correspond to the rise, maximum and the decay phases respectively.
Acknowledgements
RESIK is a common project between NRL (USA), MSSL and RAL (UK), IZMIRAN (Russia) and SRC (Poland). The authors acknowledge support from the Polish Ministry of Education and Science grant 1.P03D.017.29.