Advances in Space Research,
Volume 38, Issue 5, pp. 986-989 2006
Keywords: Sun; Corona; Flares; X-rays
Long duration events (LDEs) are generally associated with large, high (104 - 105 km), long-lasting (several hours) arcades of loops (Kahler, 1977). These arcades are characterised by slow expansion (1 - 10 km/s). SXR time profiles of LDEs are usually smooth. Hard X-ray emission of LDEs are weaker than in impulsive flares but still clearly observed (Tsuneta et al. 1992, Harra-Murnion et al. 1998). In a previous paper (Siarkowski et al., 2002) we have identified many very soft, low intensity and long duration flares, using data taken with RF15-I X-ray photometer aboard INTERBALL-Tail satellite from August 1995 to November 1997. In this paper we extend the former analysis to a period of low activity (February 1994 - November 1997). We have identified about 250 LDE events with decay times longer than 1 h and GOES classes less than C6. We used Yohkoh/Soft X-ray Telescope (SXT) images to identify structures of these events. Imaging capability of the SXT gives a unique opportunity to study such faint events.
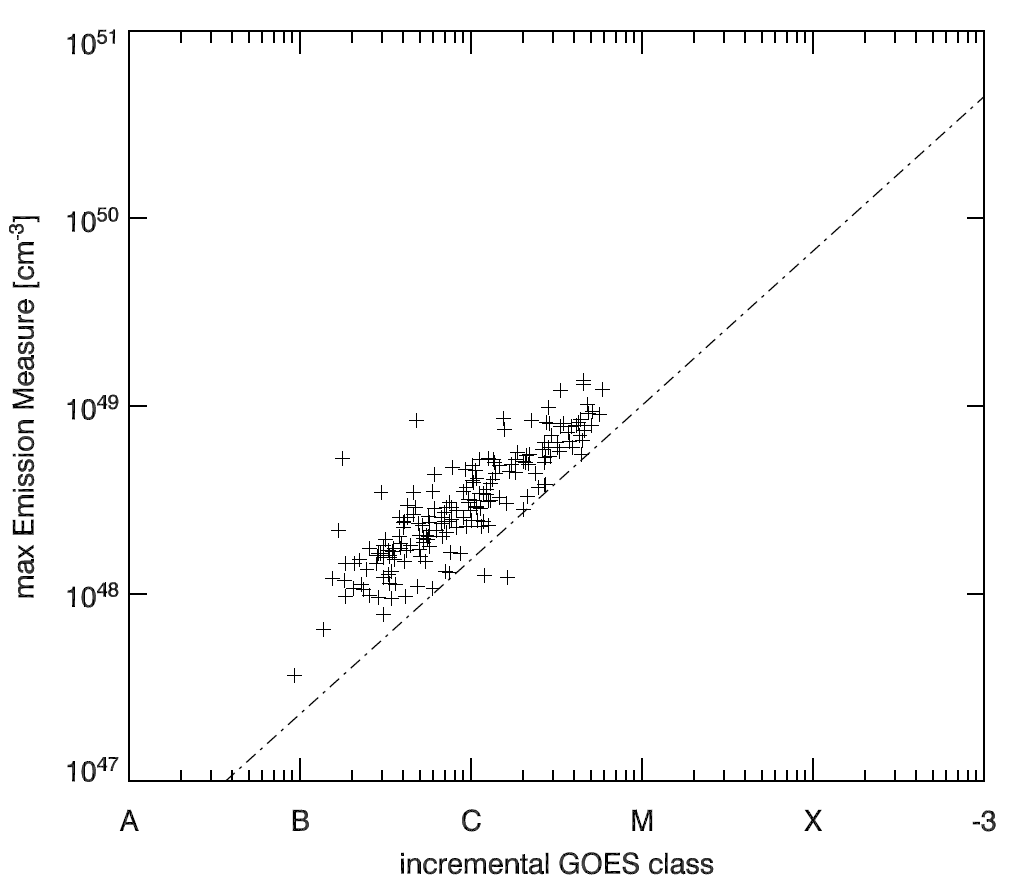
Figure 1: Maximum emission measure as a function of incremental GOES class for our set of small LDE. Dashed line shows the lower boundary of the distribution found by Garcia (1988) for M and X-class flares.
The previous results have clearly indicated that the emission measure increases with the flare GOES class. Garcia (1988) has shown this relationship for strong M and X-class flares, Phillips and Feldman (1995) - for flares with GOES class B5 to C2. Using BCS data Feldman et al. (1995b) confirmed this relationshop for flares with GOES class greater than C2. Above results were based on the data for all (not only LDE) flares. We confirmed here this relationship for our set of LDEs. These results are presented in Fig. 1 together with lower boundary of the maximum emission measure found by Garcia (1988). This figure shows that small LDEs follow the same relation as large flares. However it should be noticed that some of the above results were obtained using BCS data. These results cannot be so directly compared to results obtained from GOES data.
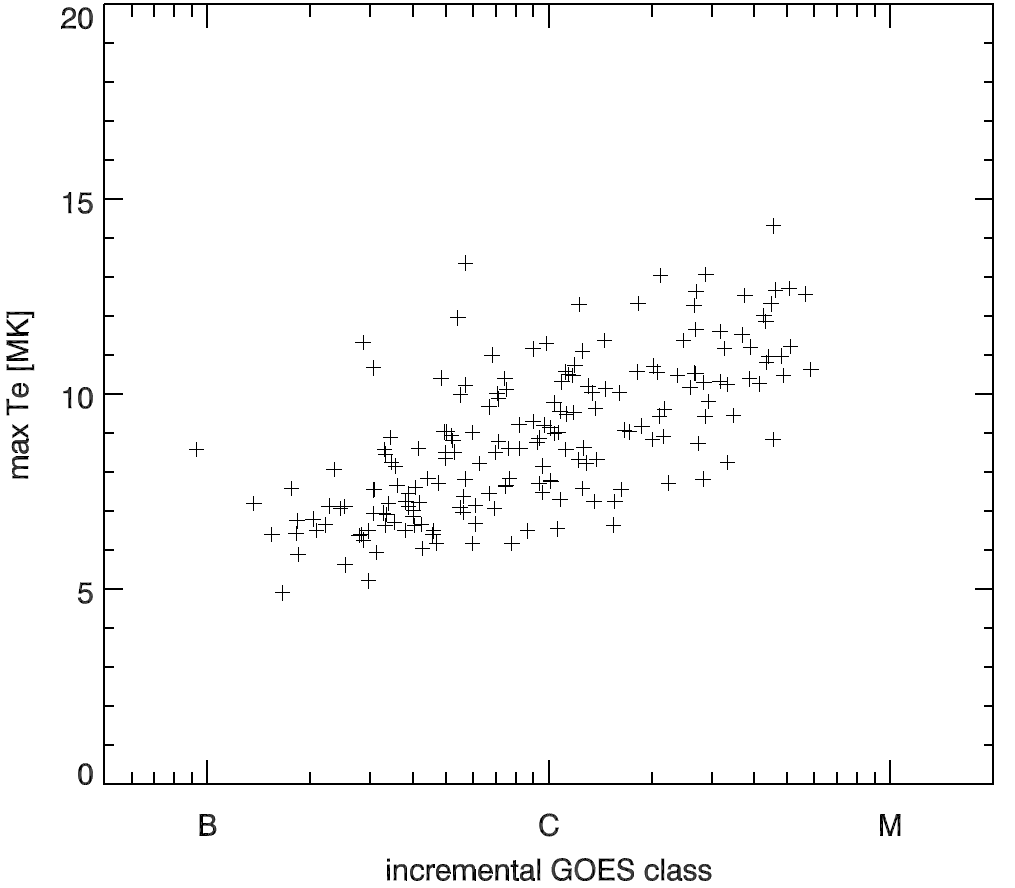
In Figure 2 the relationship between the incremental GOES class and the maximum temperature is shown. As expected clear increase of the maximum temperature with the GOES class can be observed. Similar relationship was observed by Garcia (1988), Feldman et al. (1995b, 1996a,b). However it is worth to noticing that Phillips and Feldman (1995) did not find such relation for their set of B5-C2 GOES flares.
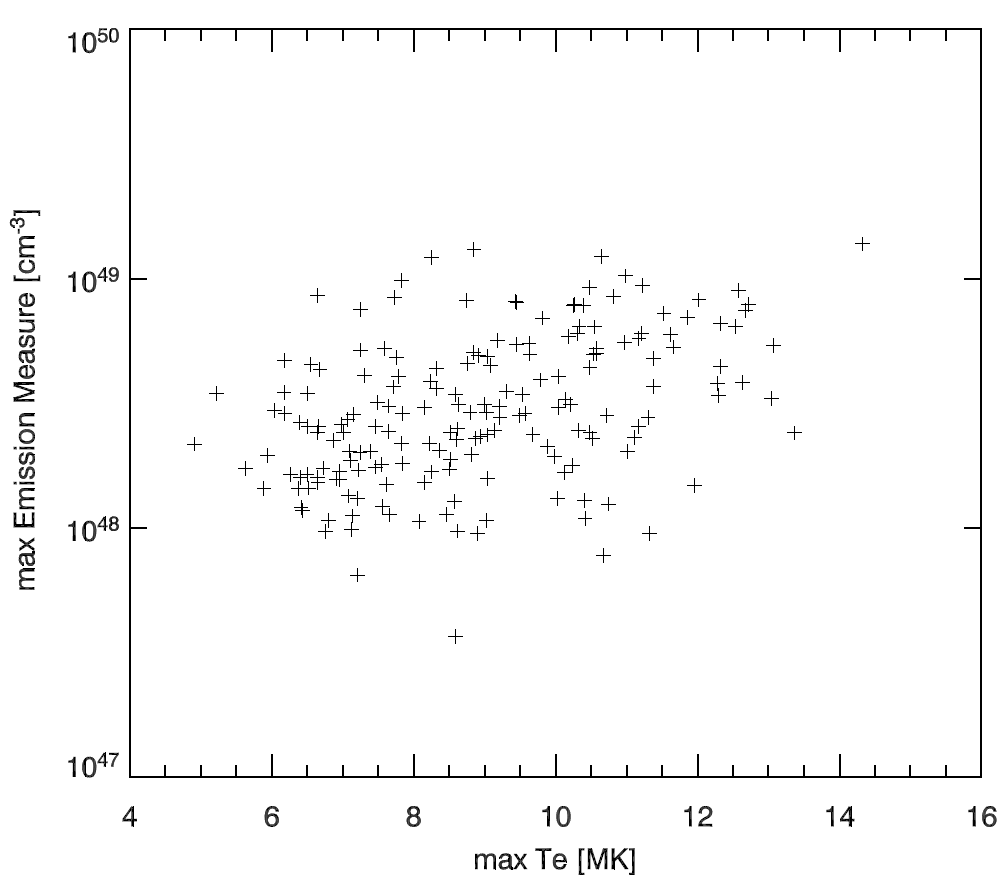
Feldman et al. (1995b) analysed relationship between emission measure and temperature for flares with GOES class greater than C2 (all flares, not only LDEs). They confirmed that, as expected, the hottest flares have large value of emission measure. However, Phillips and Feldman (1995) analysed the same relationship for flares with GOES class B5-C2 and did not find this correlation to be particularly evident. It was probably due to limited range of emission measure in their data. We present this relationship for our sample of small LDEs in Fig. 3. Similarly to Phillips and Feldman we also do not see evident correlation. However there is slight tendency that hottest flares have larger value of emission measure.
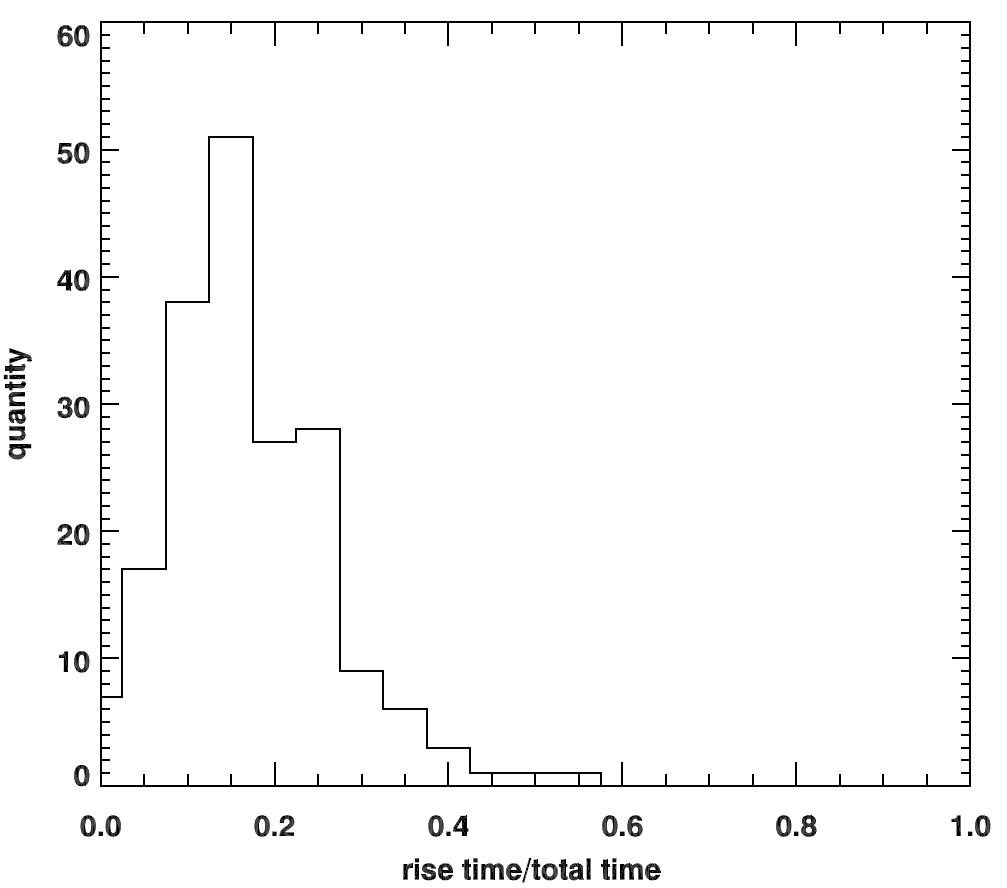
Fig. 4 shows the histogram of the rise time, normalised to the total duration of the flare. We can state that the average rise time of all events is about 15% of their duration time.
The structure of LDE flares is quite complicated and characterized by a large diversity of magnetic loops. Usually these loops form giant arcades associated with filament eruption or coronal mass ejection. According to Feldman et al. (1995a) the most intense emission comes from a small number of loops. The brightest emitting regions are found to be located near the tops of these loops. During the flare evolution usually a few hot and bright kernels of emission develop along the arcade channel (Jakimiec et al. 1997; Kołomański and Jakimiec 2002). Yohkoh/SXT observations revealed numerous examples of the cusp-shaped loop in LDE flares (Tsuneta et al., 1992; Isobe et al., 2002). All these observations indicate that continuous magnetic reconnection and the resultant energy release should occur in the decay phase of LDE (e.g. Harra-Murnion et al. 1998).
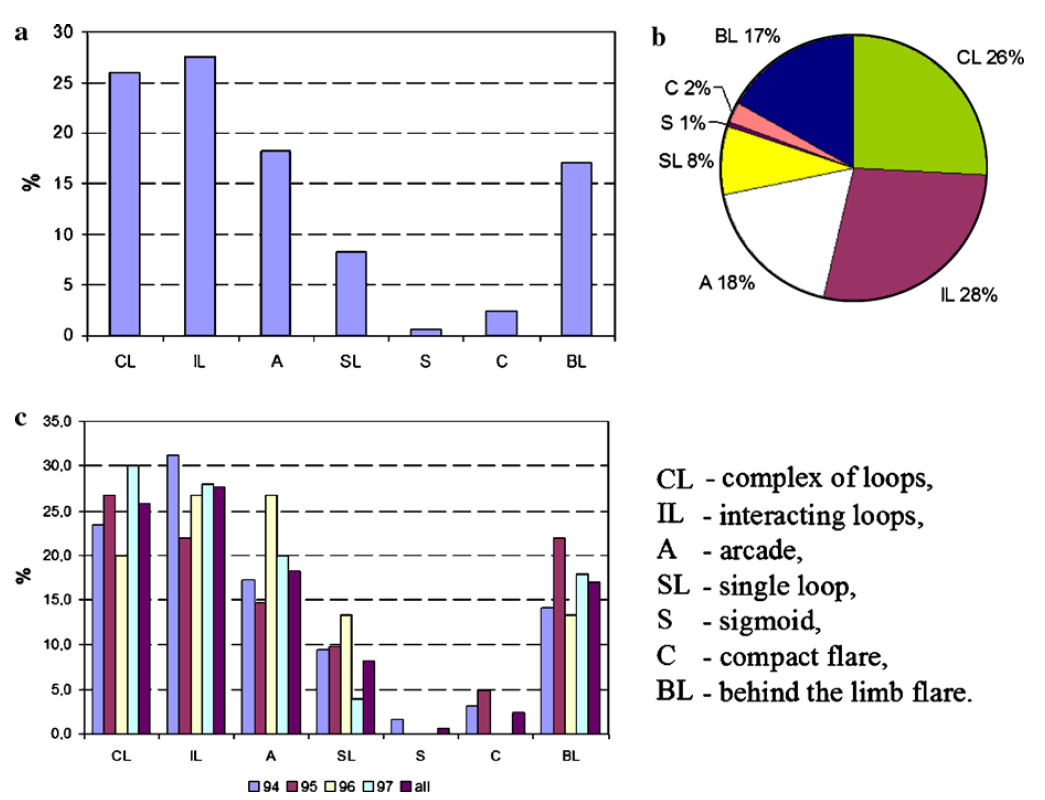
In this paper we analysed the morphology of small LDE flares for 170 out of 189 events for which the SXT images were available. We have found that, similarly to bigger flares there is a large diversity of the morphology of these small events, including single loops (SL), interacting loops (IL), sigmoids (S), arcades (A) and complex system of the loops (CL). We have also identified significant group of events that are behind the limb (BL). The distributions of the observed groups of events are presented in Figure 5a and Figure 5b. In Figure 5c the quantity distribution of the above groups for individual years is shown. We can observe similar distribution in particular years for each group of events. In Figures 6 we present two characteristic examples of the SXT images for analysed events.
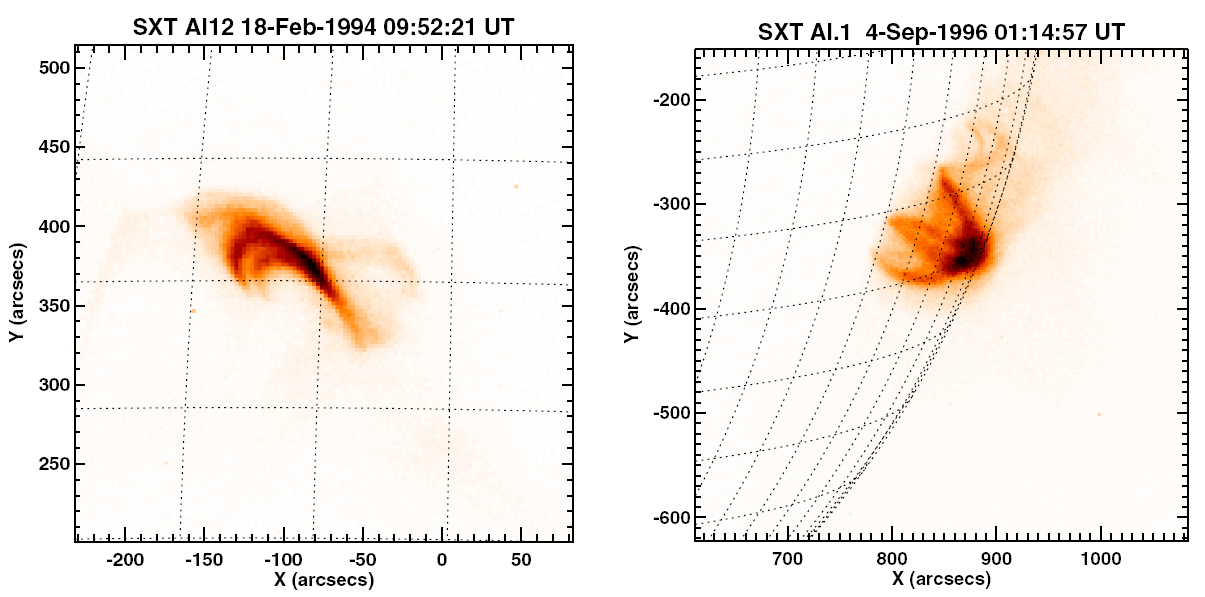
Figure 6: Yohkoh/SXT images. Left: 18 February 1994 flare (an example of interacting loops - IL). Right: 4 September 1996 flare (an example of complex system of loops - CL).
We have found that morphology of analysed small LDEs is quite complicated with a large diversity of loops configuration. These structures are however very similar to those observed in large long duration flares.
Acknowledgements
The Yohkoh satellite is a project of the Institute of Space and Astronautical Science of Japan. UBS and RF have been supported by grant No. 2PO3D 001 23 from the Polish Commitee for Scientific Research (KBN). MS has been supported by the Polish Committee of Scientific Research, grant number PBZ KBN 054/P03/2001.