Thermal and Nonthermal Contributions to
the Solar Flare X-ray Flux
aLaboratory
for Astronomy and Solar Physics, NASA Goddard Space Flight Center, Code 682,
Greenbelt, MD 20771, USA
bNational
Research Council Senior Research Associate, NASA Goddard Space Flight Center,
Code 682, Greenbelt, MD 20771, USA
cSpace
Research Centre, Polish Academy of Sciences,ul. Kopernika 11, PL-51-622 Wroclaw,
Poland
dSSAI,
NASA Goddard Space Flight Center, Code 682, Greenbelt, MD 20771, USA
Abstract
The relative thermal and nonthermal contributions to the total energy budget of
a solar flare are being determined through analysis of RHESSI X-ray
imaging and spectral observations in the energy range from
~ 5 to ~ 50 keV. With its ~ 1-keV spectral resolution, intensities and equivalent widths of two line
complexes, the Fe line group at 6.7 keV (mostly due to Fe
XXV lines and Fe XXIV satellites) and the
Fe/Ni line group at 8 keV (mostly due to higher-excitation Fe
XXV lines and Ni XXVII lines)
can be obtained as a function of time through a number of flares. With line and
continuum intensities from the CHIANTI code, the thermal component of the flare
emission can be more reliably separated from the nonthermal. The abundance of Fe
can also be determined from RHESSI spectra. Comparisons of RHESSI spectra
with those from the RESIK crystal spectrometer on CORONAS-F show very
satisfactory agreement, giving much confidence in the intensity calibration of
both instruments.
Key words:
Sun, X-ray,
spectra
1 Introduction
The RHESSI mission has been operating successfully since its launch on
2002 February 5, and has observed many thousands of solar flares. The instrument
, which has been described by Lin et al. (2002),
has nine cooled germanium detectors which enable flare spectra and images by
modulation collimators to be obtained from the soft X-ray region (3 or 4 keV) to
gamma-rays (17 GeV). Its relatively high resolution, ~ 1 keV at energies less than 20 keV, enable line features in the spectrum at 6.7
keV (Fe line feature) and 8.0 keV (Fe/Ni line feature) to be observed. These
line features are on a flare continuum which, at the flare impulsive stage,
consists of a nonthermal component with relatively flat energy dependence and a
thermal component with steeper spectrum.
This paper is concerned with analysis of flare spectra in the energy range
~ 2 -20 keV, which has been observed by both RHESSI and the RESIK crystal
spectrometer on the Russian CORONAS-F spacecraft. The 2-20 keV range is of great interest since it is where the nonthermal component
begins to be evident over the thermal component. We report on attempts to derive
parameters for the thermal component as well as the absolute abundance of Fe in
the flare plasma from line emission during a flare on 2003 April 26.
2 Theoretical X-ray Spectra in the 3.8 keV - 10 keV Range
We first briefly describe line and continuum emission from thermal solar flare
plasmas in the range 3.8 keV - 10 keV. More details are given by
Phillips (2004). The emission has been calculated for solar plasmas by
Mewe et al.(1985) (MEKAL code) and Dere et al. (1997)
(CHIANTI code). In analyzing RHESSI spectral data, we have used both
codes, though most of the illustrations here are from CHIANTI. In the RHESSI
range, the thermal spectrum consists of free-free and free-bound continua and
two line features at 6.7 keV and 8 keV that, for flare temperatures
 20 MK, are made up of
He-like Fe (Fe
XXV) lines (transitions 1s2
- 1snl, n ³ 2, l=s, p etc.) and Fe XXIV
dielectronic satellites. At higher temperatures, Fe XXVI
and Ni XXVII lines contribute to both features.
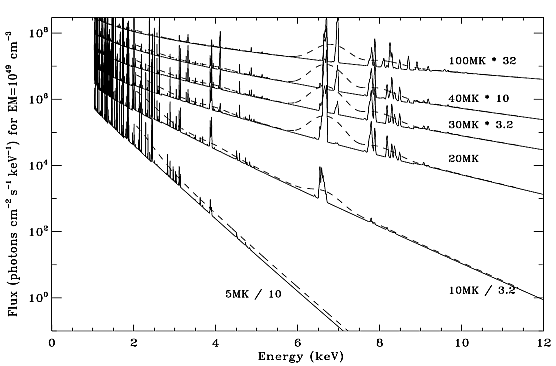
Illustrations of theoretical spectra in the 1 keV - 12 keV range at various
temperatures are given in Figure .

Figure 1: CHIANTI X-ray line and continuum spectra for temperatures
indicated. Solid lines: spectral resolution (FWHM) 0.05 keV; dashed lines: FWHM
0.8 keV. Coronal abundances (Feldman & Laming 2000) and ion fractions of
Mazzotta et al.(1998) are assumed.
With RHESSI's spectral resolution, individual lines, in particular the Fe
XXIV satellite structure at 6.6 - 6.7 keV, cannot be
resolved. However, because the lines are all due to Fe and have a known
dependence on temperature, and, as the continuum is well observed by RHESSI,
we can find the Fe/H abundance. Spectral fits to the thermal spectrum, defined
by the continuum slope and intensity, give temperature T and volume
emission measure  (Ne
= electron density, V= emitting volume), which can be easily found,
assuming an isothermal plasma. Other spectral fits, involving a multi-thermal
plasma (i.e. two or more values of T) or a temperature distribution have
been applied elsewhere in our analyses.
A convenient way of expressing the intensity of the two RHESSI line
features is through the equivalent width (energy width of a portion of the
continuum at the line's energy with flux equal to that of the line feature). The
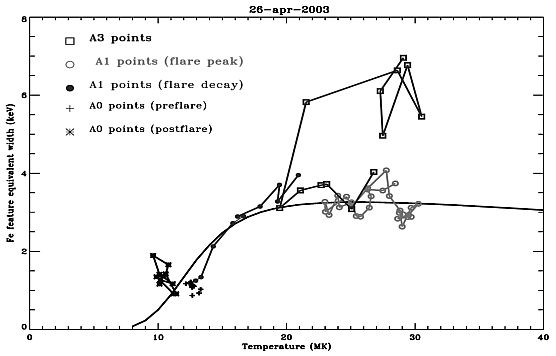
variation of equivalent width with T is given in Figure (solid line)
based on CHIANTI. There is a fast rise of equivalent width with T for
T  16 MK.

Figure 2: Equivalent width (keV) of the Fe line feature plotted against
T (smooth curve) as calculated from CHIANTI (assuming coronal abundances
and
Mazzotta et al. (1998) ion fractions).
Observed RHESSI values in attenuator states A0, A1, and A3, for the flare
of 2003 April 26 are shown as points connected by lines (see legend for line
styles and plotting symbols).
3 RHESSI Observations
We illustrate our RHESSI flare thermal spectral analyses in the 4 keV - 10 keV
range with observations made during an M2 flare with maximum at 03:08 UT on 2003
April 26. This flare was also observed by the RESIK instrument on CORONAS-F.
There were several changes in the RHESSI attenuator state (see Smith et
al. 2002), from A0 (no attenuator) to A1 (thin attenuator) to A3 (thick
attenuator) and the reverse sequence.

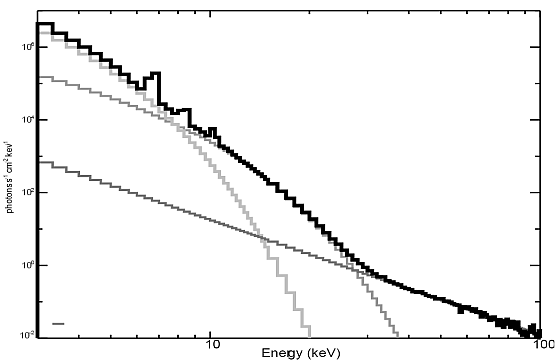
Figure 3:
RHESSI X-ray spectrum (thick black histogram) in A3 attenuator state
near the peak of the flare on 2003 April 26, integrated over 03:07:44 - 03:09:24
U.T. This was fitted with a two-component thermal spectrum (T1
= 29.4 MK, T2=11.5 MK) and a nonthermal component with
power-law energy dependence (grey histograms). Three line features were added
with Gaussian profiles having centroid energies 6.70 keV, 8.36 keV, and 10.30 keV,
identifiable with the Fe line and Fe/Ni line features and an instrumental
feature.
RHESSI spectra were fitted with the RHESSI analysis software over
the energy range 3-100 keV. In our investigations, we sometimes used the
spectral output from individual detectors, while for some purposes data from
seven of the nine detectors summed were more appropriate: in such cases, data
from detectors 2 and 7, which have poorer spectral resolution, were omitted. A
first-guess spectrum with appropriate parameters found from previous analysis
was folded through the RHESSI spectral response matrix for each
attenuator state, having subtracted a background spectrum.
The low-energy ( ~ 3 keV - 20 keV) part of the spectrum could generally be fitted during the A0
and A1 attenuator states with a thermal continuum and three line features with
Gaussian profiles having a single value of T and EM. For
higher-intensity spectra, the addition of a continuum with power-law dependence
on energy E was found necessary to fit the spectrum at energies above
~ 30 keV. An iterative process was used to refine the parameters of the
first-guess spectrum, minimizing the value of
 . This procedure is adequate
for spectra in the A0 and A1 attenuator states, but less so for A3 spectra,
which are better fitted with two-component thermal continua: see Figure 3. Two
of the three line features can be identified with the flare Fe line feature (energy
~ 6.7 keV) and Fe/Ni line feature (energy ~ 8 keV), and the third with an instrumental (Ge) line. Parameters from the final
iteration describing the two thermal components of the continuum and the
nonthermal continuum are given in the Figure. The fit to the observed spectrum
over the 3 keV - 100 keV range gave
 = 0.84, and can be regarded
as satisfactory.
With observed fluxes of the continuum and Fe and Fe/Ni line features, the line
equivalent widths can be evaluated (points in Figure 2) and the agreement with
the theoretical curve examined. For observations in the A1 attenuator states, on
the rise and decline of the flare, the observed equivalent widths of the Fe line
feature approximately follow the theoretical curve, giving support for a coronal
abundance of Fe in the flare plasma. However, the observed equivalent widths
from the A3 attenuator state, analyzed with single-temperature fits (i.e. not
the two-component fit as in Figure 3) vary widely, much more than is predicted
by CHIANTI. This apparent discrepancy has been encountered in the analysis of
several other spectra. The presence of a multi-thermal or two-component emission
measure spectrum is likely to contribute to this discrepancy, but other possible
explanations for this are also under investigation.
4 RESIK Observations and their Comparison with RHESSI
RESIK is a high-resolution crystal spectrometer (Sylwester et
al., 2004) operating in the energy range 2.04 keV - 3.68 keV (3.37 Ǻ - 6.09 Ǻ)
on the Russian CORONAS-F
spacecraft launched on 2001 July 31. RESIK's spectral range includes
diagnostically important lines of Ar, S, and Si ions, as well as `trace'
elements (K and Cl). Unlike many previous crystal spectrometers, it observes the
continuum in solar flares with a background that is negligible for two of its
channels (that in the other 2 channels can be accounted for in analysis
software). Normally, RESIK operates in first order Bragg diffraction, but by
changing the instrument's gain, third-order spectra (with wavelength ranges
one-third their first-order ranges) can be obtained. The instrument has been
precisely calibrated, with 20% uncertainties at most in the measured fluxes,
making RESIK spectra suitable for comparison with those from RHESSI.
RESIK observed a number of flares in 2002 and 2003 for which there are RHESSI
observations. During the 2003 April 26 flare, RESIK was in third-order
diffraction mode for a short interval near the event peak (03:03 U.T. - 03:05 UT),
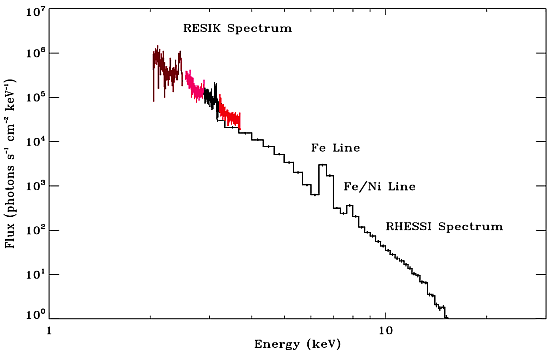
but in first-order mode at other times. Figure shows RESIK (all four
channels) and
RHESSI spectra at 03:00 UT (RHESSI in A0 attenuator state). The
RHESSI spectra show a thermal continuum, with the Fe line (6.7 keV) and
Fe/Ni (8.0 keV) line features while the RESIK spectra show He-like Ar (3.1 keV)
and He-like and H-like Si (2.4 keV) lines. The RESIK continuum agrees with the
RHESSI spectrum at around 3.5 keV to within about 20%, within the expected
intensity calibration uncertainties of RESIK. The agreement between two quite
different instruments is very gratifying, and adds to our confidence in the
calibration of both instruments.

Figure 4: Observed X-ray spectra for a time (03:00 U.T.) just preceding
the main flare on 2003 April 26. RESIK spectra (four channels) cover 2.0 keV - 3.7 keV
and include lines and continuum. Spectrum above 3 keV (histogram) is from
RHESSI detector 4 (A0 attenuator) and shows the Fe line and Fe/Ni line
features. The best-fit thermal spectral parameters for this spectrum are Te
= 18.6 MK, EM = 2.1 ×1047 cm-3.
The Fe line was observed by RESIK in third-order diffraction when RHESSI
was in its A1 attenuator state. The RHESSI spectrum gives the line flux
as 7.83 ×10⁴
photons cm-2 s-1, while RESIK spectra integrated over the same interval gives nearly the
same flux: 8.22×10⁴ photons cm-2 s-1.
5 Conclusions and Summary
Observations of several flares, including the one discussed in detail here,
suggest that
RHESSI can measure equivalent widths of the Fe line to an accuracy that
allows a preliminary estimate to be made of the abundance of Fe: this is close
to the coronal value (1.26×10⁻⁴). There is good agreement - within about 20% - of
RHESSI spectral fluxes and those from the CORONAS-F RESIK crystal
spectrometer in the region of overlap, around 3 - 4 keV. There is also agreement
between RHESSI
and RESIK estimates of the Fe line flux.
Acknowledgements
K.J.H.P. acknowledges a National Research Council Senior Research Associateship
award at the NASA Goddard Space Flight Center. B.S. and J.S. acknowledge
support from grants 2.P03D.002.22 and BPZ-KBN-054/P03/2001 of the Polish
Committee for Scientific Research. CHIANTI is a collaborative project
involving Naval Research Laboratory, Rutherford Appleton Laboratory (U.K.),
and the Universities of Florence (Italy) and Cambridge (U.K.). We thank E.
Landi for providing updates of the CHIANTI database.
References
- Dere, K. P., Landi, E., Mason, H. E., Monsignori Fossi, B. C., & Young, P.
R., CHIANTI - An Atomic Database for Emission Lines, 1997,
A&AS, 125, 149.
- Feldman, U., & Laming, M., Element Abundances in the Upper Atmospheres of
the Sun and Stars: Update of Observational Results, 2000, Phys. Scripta, 61,
222.
- Lin, R. P., et al., The Reuven Ramatry High-Energy Solar Spectroscopic
Imager (RHESSI), Solar Phys., 210, 3.
- Mazzotta, P., Mazzitelli, G., Colafrancesco, S., & Vittorio, N.,
Ionization Balance for Optically Thin Plasmas, 1998, A&AS, 133,
403.
- Mewe, R., Gronenschild, E. H.B.M., van den Oord, G.H.J., Calculated
X-radiation from optically thin plasmas, 1985, A&AS, 62, 197.
- Phillips, K. J. H., The Solar Flare 3.8-10 keV X-ray Spectrum, 2004,
ApJ, 605, 921-930.
- Smith, D. M. et al., The RHESSI Spectrometer, 2002,
Sol. Phys., 210, 33-60.
- Sylwester, J., Gaicki, I., Kordylewski Z., et al., RESIK: A Bent Crystal
X-ray Spectrometer for Studies of Solar Coronal Plasma Composition, 2004,
Solar Phys., in press.
BACK
 20 MK, are made up of
He-like Fe (Fe
XXV) lines (transitions 1s2
- 1snl, n ³ 2, l=s, p etc.) and Fe XXIV
dielectronic satellites. At higher temperatures, Fe XXVI
and Ni XXVII lines contribute to both features.
Illustrations of theoretical spectra in the 1 keV - 12 keV range at various
temperatures are given in Figure .

 (Ne
= electron density, V= emitting volume), which can be easily found,
assuming an isothermal plasma. Other spectral fits, involving a multi-thermal
plasma (i.e. two or more values of T) or a temperature distribution have
been applied elsewhere in our analyses.


 . This procedure is adequate
for spectra in the A0 and A1 attenuator states, but less so for A3 spectra,
which are better fitted with two-component thermal continua: see Figure 3. Two
of the three line features can be identified with the flare Fe line feature (energy
~ 6.7 keV) and Fe/Ni line feature (energy ~ 8 keV), and the third with an instrumental (Ge) line. Parameters from the final
iteration describing the two thermal components of the continuum and the
nonthermal continuum are given in the Figure. The fit to the observed spectrum
over the 3 keV - 100 keV range gave
