Published in Astronomicheskii Vestnik, 2006,
Vol. 40, No. 2, pp. 125–132
Thermodynamics of Selected Solar Flares as Determined
from the Analysis of the Spectra Obtained
with the RESIK Instrument
B. Sylwestera, J. Sylwestera, A. Kępaa, Z. Kordylewskia,
K. J. H. Phillipsb, and V. D. Kuznetsovc
aSpace Research Centre, Polish Academy of Sciences, Kopernika 11, 51-622 Wroclaw, Poland
bNASA Goddard Space Flight Center, Greenbelt, MD, 20771, USA
cPushkov Institute of Terrestrial Magnetism, Ionosphere, and Radio Wave Propagation,
Russian Academy of Sciences, Troitsk, Moscow oblast, 142090 Russia
Received April 12, 2005
Abstract
The RESIK instrument is an X-ray spectrometer with bent crystals onboard the CORONAS-F satellite. It was used to observe the spectra of solar flares, active regions, and quiet corona. During the period of the instrument’s operation, many spectra were collected in four energy channels covering the wavelength range from 3.2 to 6.1 Å. For the present analysis, we selected solar flares of various X-ray classes (B, C, and M in the GOES notation), which were observed during moderate level of solar activity (from January to March 2003). The analysis of the RESIK spectra fulfilled with different techniques allowed us to determine the temperature, emission measure, and temperature distribution of the differential emission measure, as well as to examine their time variability.
PACS numbers: 96.60 ge
DOI: 10.1134/S0038094606020067
INTRODUCTION
The RESIK instrument consists of two X-ray spectrometers (four energy channels) designed for observing hot plasma of flares and active regions on the Sun. The observations were made in the following wavelength ranges:
3.3–3.8–4.3–4.9–6.1 Å. The instrument, its operational principle, and the calibration technique are described by Sylwester et al. (2005c). A preliminary analysis of the obtained spectra indicates many spectral features, which have been identified only recently. Thanks to the accurate calibration of the instrument, we managed to determine the absolute fluxes in individual lines and to associate the observed bins with the absolute values of the wavelengths. Some of these lines were observed by the RESIK instrument in the astrophysical plasma for the first time (Sylwester et al., 2005a). One example is the line of highly ionized chlorine (Cl XVI) observed in the 4.4- to 4.5-Å range. In this range, the resolution of RESIK allows the individual components of this heliumlike triplet to be distinguished, and these lines are seen in many flares. Previously, the resonance line of Cl XVI (the wavelength is 4.43 Å) has been observed only once with the FCS spectrometer onboard the Solar Maximum Mission (SMM) spacecraft. These data were analyzed by Phillips and Keenan (1990). A preliminary analysis of the chlorine lines observed with RESIK is presented in the paper by Sylwester et al. (2004). The RESIK experiment was designed to determine the abundances of elements in the corona whose lines are observed with the instrument, and the results have justified the expectations. In the spectra, lines of elements having various first ionization potentials (FIP) are seen, from the lowest (potassium, FIP = 4.34 eV) to intermediate (sulfur, FIP = 10.36 eV) and high ones (argon, FIP = 15.76 eV). These RESIK data allow us to study the FIP effect, which most likely causes the difference between the ratios of elemental abundances in the corona and photosphere. The RESIK observations for long-lived solar flares were used by Phillips et al. (2003) for determination of the coronal abundances of sulfur, argon, and potassium. The coronal potassium abundances in many flares and active regions were particularly studied by Sylwester et al. (2005b).In the present paper, we attempt to analyze the RESIK spectra for selected flares in order to determine the thermodynamic characteristics of the emitting plasma.
A period of moderate solar activity (from January to March 2003), for which the instrumental characteristics of the device (the high-voltage levels and the positions of discrimination levels) were selected in the best way, was at the center of our interest.
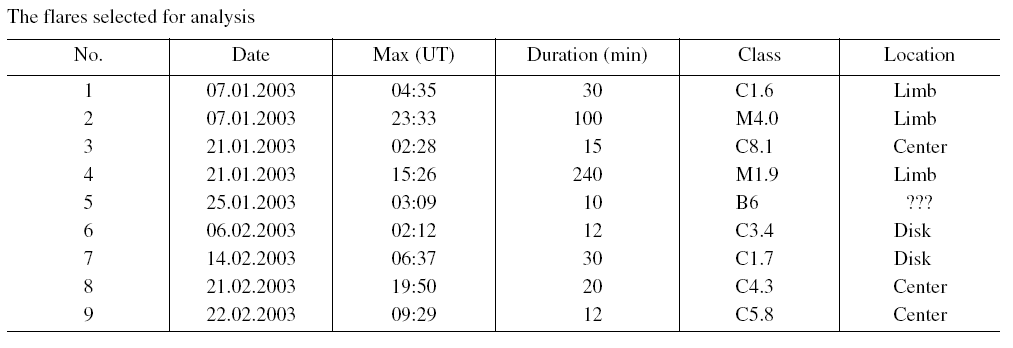
We selected nine flares from this observational period (see table).
The spectra of these nine flares, averaged over the time intervals when the satellite was out of the Brazilian anomaly and auroras of the polar radiation belts, are summed and presented in Fig. 1.
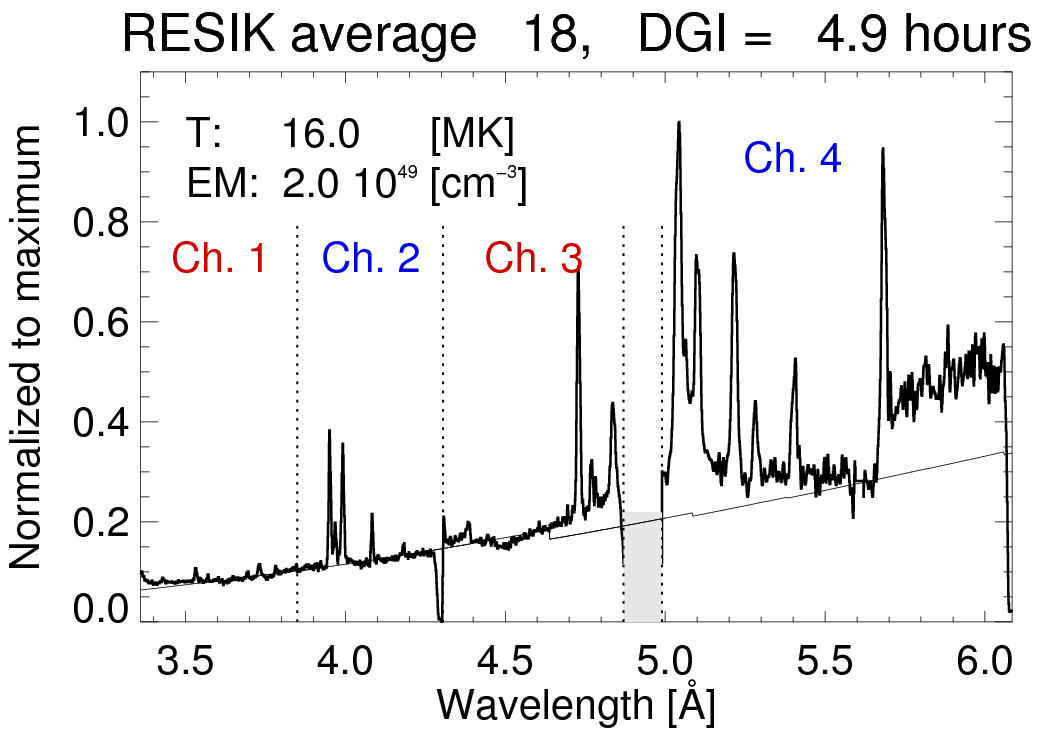
Fig. 1. The averaged composite spectrum of nine selected flares observed with the RESIK instrument during the maximum and decay phases. The summation was made for 18 time intervals (4.9 hours of observations). The thin line below the spectrum indicates the level of the continuum calculated with the CHIANTI code from the plasma parameters (T and EM) given in the plot. These parameters were obtained from the ratio of the total fluxes in the first and second channels in the one-temperature approximation.
This composite spectrum obtained from 18 time intervals (observed in the phase of the flare maximum or decay) covers 4.9 hours of observations in total. The figure presents the average temperature (T) and emission measure (EM) derived in the isothermal (one-temperature) approximation from the analysis of the total flux observed with the RESIK instrument in the first (3.3–3.8Å) and second (3.8–4.3Å) spectral channels. The thin line below the spectrum indicates the level of the continuum calculated with the CHIANTI code (Dere et al., 1997) from the temperature (T) and emission measure (EM). Numerous spectral lines are clearly seen in the composite spectrum. In the first channel, in the range between 3.3 and 3.6 Å, the triplet of He-like potassium (K
XVIII) stands out noticeably. In the second channel, the strongest lines correspond to the triplet of a He-like argon ion (Ar XVII) (in the 3.93 to 4.0 Å range) and to the 1s2–1s4p transition of a He-like sulfur ion (S XV) ( =
4.08Å). In the third channel, the
strongest lines are in the range between 4.7 and 4.8 Å. The strongest line (4.72Å)
is Ly
=
4.08Å). In the third channel, the
strongest lines are in the range between 4.7 and 4.8 Å. The strongest line (4.72Å)
is Ly in the H-like sulfur ion (S
XVI) (the
1s–2p
transition). The other lines correspond to the
1s–p
transitions (when
n= 5, 6) in the H-like silicium ion
(Si
XIV).
The fourth channel is characterized by the presence of many lines emitted by
cooler plasma. In the
5.0–5.18
Å range, the S
XV
ion triplet is observed. Moreover, the lines corresponding to 5.22, 5.40, and
5.7Å
(the 1s–3p
transition in a Si
XIV
ion, as well as the
1s2–1s4p
and 1s2–1s3p
transitions in a Si
XIII ion) are
clearly seen.
in the H-like sulfur ion (S
XVI) (the
1s–2p
transition). The other lines correspond to the
1s–p
transitions (when
n= 5, 6) in the H-like silicium ion
(Si
XIV).
The fourth channel is characterized by the presence of many lines emitted by
cooler plasma. In the
5.0–5.18
Å range, the S
XV
ion triplet is observed. Moreover, the lines corresponding to 5.22, 5.40, and
5.7Å
(the 1s–3p
transition in a Si
XIV
ion, as well as the
1s2–1s4p
and 1s2–1s3p
transitions in a Si
XIII ion) are
clearly seen.
Many lines in this channel are so-called dielectronic satellites (5.57 and 5.8 Å), which are located on a longwave side of their parent lines (5.4 and 5.7 Å). It is known from theoretical calculations that such pairs—a parent line and its dielectronic satellite—make a good thermometer for studying electron temperature. Such pairs were well known for resonance transitions in Helike ions (n = 2) and their dielectronic satellites (Gabriel, 1972; Grineva et al., 1973). However, similar pairs for the transitions with n > 2 have not yet been used to analyze plasma.
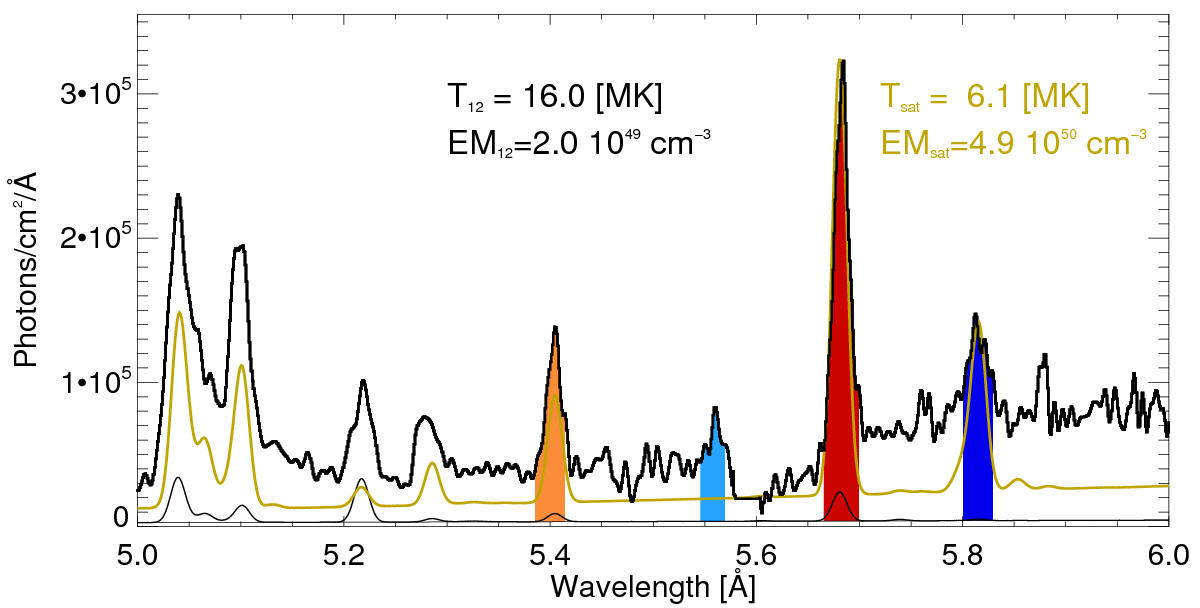
Fig. 2. The portion of the observed spectrum (thick line) shown in Fig. 1 for the fourth channel. The thin lines (black and light) present theoretical spectra calculated with the CHIANTI code for various indicated parameters of the emitting plasma.
The authors (Phillips et al., 2005) examined the ratios of the line intensities in these pairs for the longlived flares observed with the RESIK instrument in 2002. Figure 2 presents a small portion of the averaged spectrum shown in Fig. 1 related to the 5–6 Å wavelength range. These line pairs are indicated in the spectrum with filled areas. The thin line shows a theoretical spectrum calculated with the CHIANTI code with the usage of the values (í and EM) obtained in a one-temperature approximation from the ratio of fluxes in the first and second spectral channels. It is seen that the calculated and observed spectra do not agree at all. The light line in Fig. 2 presents a spectrum also calculated with the CHIANTI code, but for other parameter values (í and EM). These new values of T and EM have been obtained based on the fluxes observed in the line pair at 5.68 and 5.81 Å. It is seen that the fluxes observed in this case in other lines do not match the calculations even within such a limited spectral range. This indicates that the one-temperature model definitely cannot describe the emitting plasma. The figure also shows that the RESIK instrument observed some lines that have no equivalents in the theoretical spectra calculated with the CHIANTI code.
DETERMINATION OF THE MAIN PHYSICAL CHARACTERISTICS OF PLASMA
The table presents the main data for the nine selected flares. Specifically, the table contains the X-ray class and duration of a flare (according to the data of the
Geostationary Operational Environmental Satellite (GOES)), as well as its location on the Sun. It is seen that the selected events vary considerably in class (B6–M4.0), duration (12–240 min), and location on the Sun (at the limb or on the disk). The weakest flare (number 5) remained beyond the Solar Soft catalog of flares (http://www.lmsal.com/solarsoft/latest_events_archive. html). We approximately determined its intensity (B6) ourselves from the GOES flux measured at maximum.The results of the analysis of the most long-lived flare (among the selected) are given below for illustration. This flare occurred on January 21, 2003 (the maximum was at 15:26 UT), at the limb. Figure 3 shows a portion of the RESIK catalog containing this flare. The catalog (in full color) can be found at the site http://www.cbk.pan.wroc.pl/2003/RDC_200301/resik_prC_08253_0_20030121_1316.png. The RESIK records are indicated with green; the X-ray fluxes found from the GOES observations are given in blue and red. Note that the satellite entered the Earth’s shadow three times during this flare. The small rise in the RESIK record before the flare (at 14:50 UT) is caused by the auroral radiation coming to the detector.
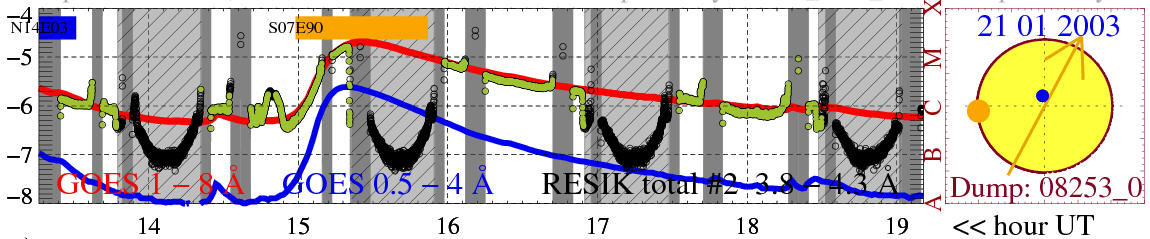
Fig. 3. The segment of the catalog of the RESIK observations related to the M1.9 flare, which took place on January 21, 2003, at the limb.
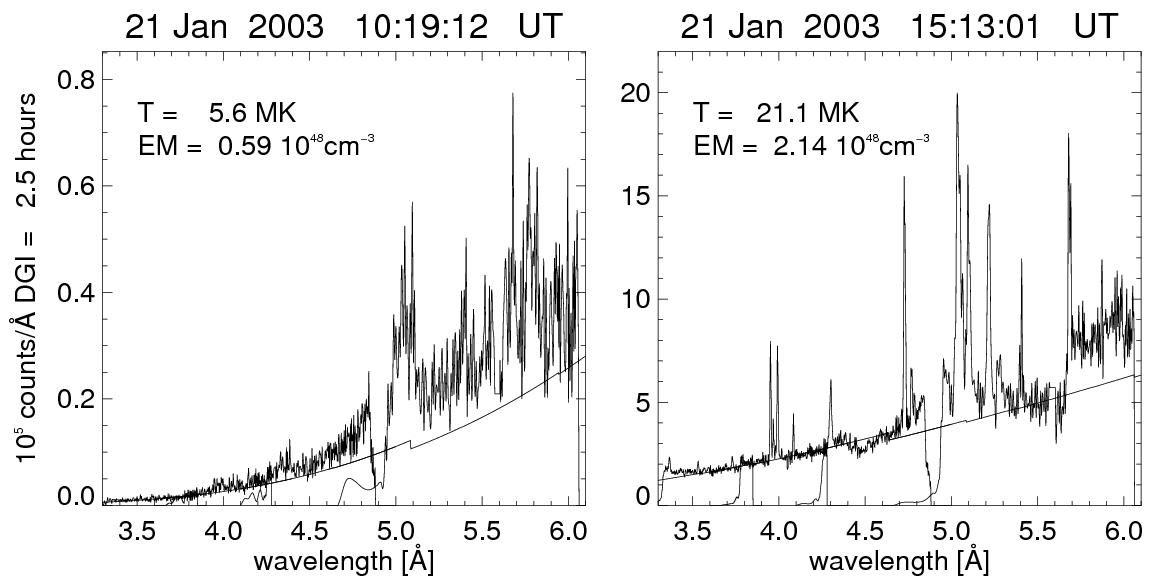
Fig. 4. The spectra collected by the RESIK instrument during the period of quiet Sun (left) and during the flare (right). The thin line below the spectra indicates the continuum level calculated with the CHIANTI code from the values of the temperature and emission measure shown in the plot.
The RESIK instrument can record spectra from
cold and hot plasma, and the spectra obtained from the quiet corona differ
substantially from those got during the flares. Fig. 4 shows the spectra
collected with the RESIK instrument on January 21, 2003, under quiet conditions
on the Sun (5 hours before the X-ray radiation enhancement) and during the rise
phase of the flare. The temperature and emission measure presented in the figure
were derived with the one-temperature model from the ratios of the fluxes in the
first and second channels. A great difference between the spectra of the cold
(the quiet Sun) and hot (the flare) plasma is clearly seen. Naturally, in the
cold plasma, the stronger lines are observed in the fourth channel (![]()
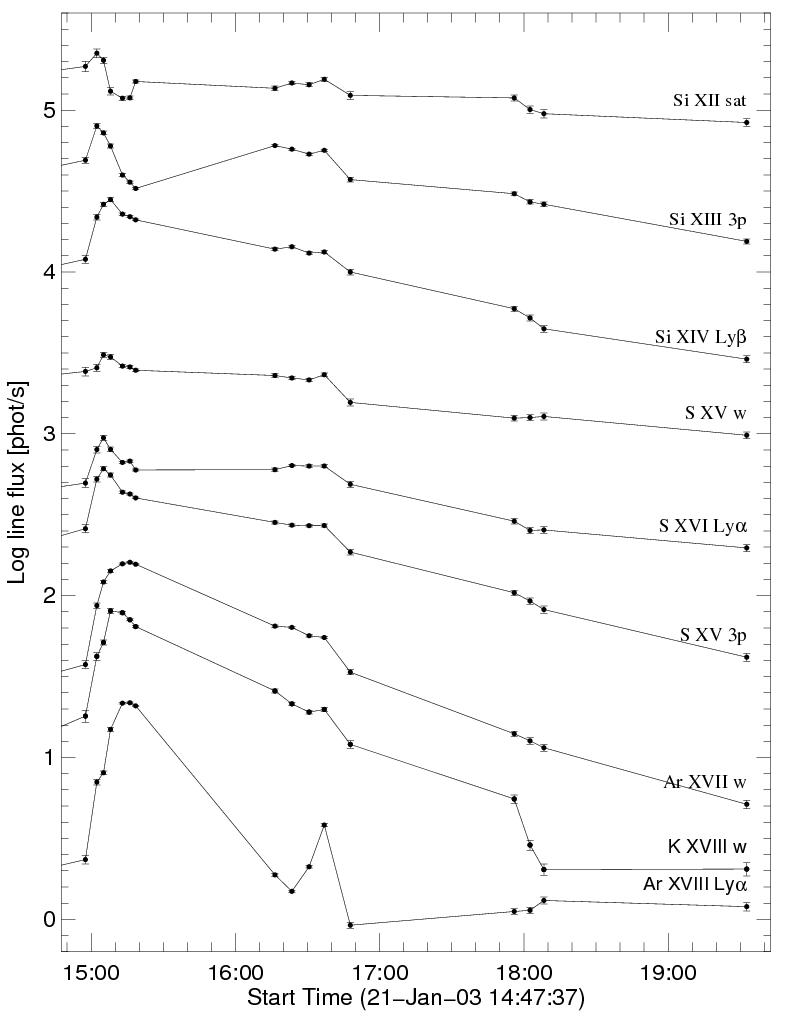
Fig. 5. The time variations of the fluxes observed by the RESIK instrument in different lines during the limb flare on January 21, 2003 (with a maximum at 15:26 UT). Individual lines are shifted to avoid crossing. The vertical scale is logarithmic.
Figure 5 shows the time variations of the integral (in wavelength) fluxes of the X-ray radiation from the flare of January 21, 2003. Several lines standing out in the spectra are presented. In the plot, the zero levels have been shifted to keep the curves from crossing. Note that the radiation grows in the “cooler” lines (S XV and Si XII) while it decays in the “hotter” lines (Ar XVIII, Ar XVII, and K XVIII).
The temperature and emission measure can be found from the ratios of the fluxes in individual lines using the one-temperature approximation. Instead of this, to interpret the averaged values (T and EM), we chose the total fluxes (the lines and continuum) in the neighboring channels (the first and the second ones). Based on these observations and on theoretical spectra (the CHIANTI code), we calculated the time variations of the temperature and emission measure for this flare.
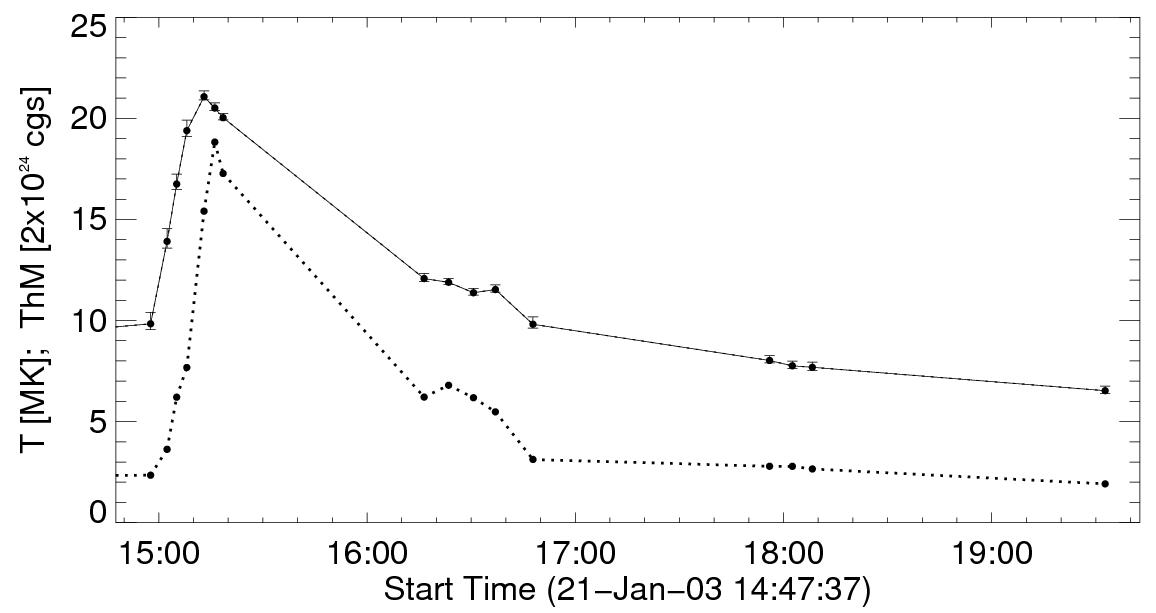
Fig. 6. The upper curve presents the time variations of temperature (derived in the one-temperature approximation). The lower curve shows the changes of the thermodynamic measure for the flare on January 21, 2003. The scales are shifted to keep the curves from crossing.
The temperature variations obtained in such a way are given in Fig. 6 (upper curve). The lower curve in this figure shows the time variations of the so-called thermodynamic measure ThM=T(EM)1/2 (Sylwester et al., 1995). This quantity characterizes the thermal energy of the plasma emitting volume V . If we assume that this volume remains constant during the flare, the ThM behavior directly describes the change in the thermal energy Eth:
|
|
(1) |
Here,
k is the Boltzmann constant and N and V are the plasma density and volume, respectively. From the definition of the emission measure
|
|
(2) |
we have
|
|
(3) |
Since the volume
V of the emitting plasma remains unknown in the RESIK observations, the total thermal energy cannot be derived from expression (1). However, the time behavior of ThM can be followed. This quantity is a good characteristic of the thermal energy of the plasma in the emitting volume. The most important point is that ThM is weakly influenced by the onetemperature approximation, because all errors are eliminated when T is multiplied by (EM)1/2. It is seen from Fig. 6 that the temperature maximum is observed 10 minutes before the thermal energy maximum.Although the flare plasma is multitemperature, the one-temperature approximation is often used in solar physics to characterize the emitting region and its time variability in general. Specifically, the one- temperature approximation was used in a series of works (Serio et al., 1991; Jakimiec et al., 1992; Sylwester et al., 1993) to study the so-called function of plasma heating in solar flaring loops. Calculations with the PALERMO-HARWARD hydrodynamic code showed that examination of plasma evolution in the temperature– density (
T–N) diagram (the so-called diagnostic diagram, DD) is a very useful and convenient tool for studying the processes of energy release and plasma cooling in coronal loops. Such a diagram allows the behavior of the plasma heating at the flare decay stage to be determined based on the slope of the evolutionary curve: an abrupt termination (OFF) of the heating or its continuation can be identified. When the heating is suddenly switched off, the slope of the evolutionary curve is about 2. If the heating continues, its function has the form|
|
(4) |
(i.e., decays with the time constant
 ); if
); if
 is rather large, the evolution follows the line with a slope of
»1/2.
The decay along such a trajectory is called a quasisteady- state (QSS).
is rather large, the evolution follows the line with a slope of
»1/2.
The decay along such a trajectory is called a quasisteady- state (QSS).
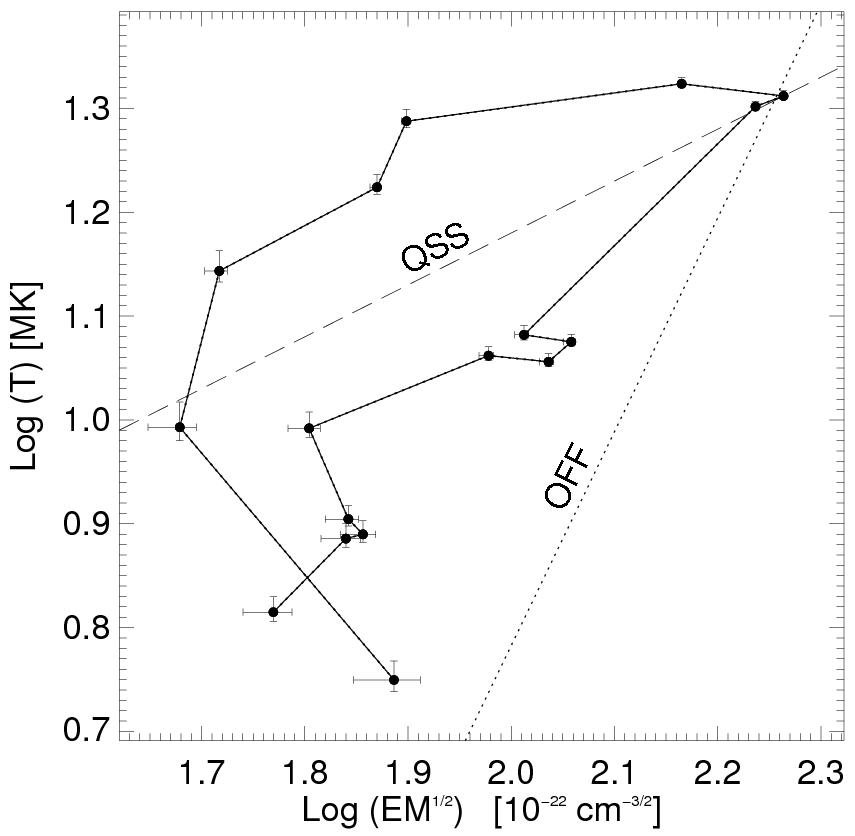
Fig. 7. The evolution of the flare on January 21, 2003, displayed in the diagnostic diagram (DD). The points represent the observations. The lines labeled as QSS and OFF are the theoretical lines obtained by hydrodynamic simulation for the quasi-steady-state evolution (QSS) and abrupt termination of the plasma heating (OFF).
Figure 7 presents the DD diagram for the flare of January 21, 2003. The temperature found in the onetemperature approximation from the ratio of the total fluxes in the first and second RESIK channels is given along the vertical axis. The quantity characterizing the plasma density, i.e.,
(EM)1/2, is given on the horizontal axis (when the volume of the emitting plasma remains constant in time, N ~ (EM)1/2). The figure also shows the theoretical lines (N–T) for the cases when the heateH0 ing terminates suddenly (OFF) and when the evolution is quasistationary (QSS). It is seen that the evolution of the flare considered here proceeds following a trajectory with a slope between these two extreme cases, along the line with a slope of »1.1. This shows that the plasma is still being heated during the entire decay phase of this flare. If the heating function is assumed to have a form of (4), the heating decay constant is about 150 s.In the one-temperature approximation, the plasma parameters can be determined from fluxes in two lines (or energy channels). However, RESIK collects the spectrum within the wavelength range from 3.2 to 6.1 Å, and we have at our disposal the fluxes in many lines and continuum (~1000 spectral bins) formed at various temperatures. We used the data on the absolute calibration of the RESIK instrument and found the fluxes in 16 strong, well-pronounced lines (see the paper by Kepa et al. (2004) for details) observed constantly during the flare’s evolution (the phases of rise, maximum, and decay). From the theoretical emission functions calculated with the CHIANTI code for these lines and from the Withbroe–Sylwester iteration algorithm (Sylwester et al., 1980), we obtained the temperature distribution of the differential emission measure (DEM). The DEM characterizes the amount of plasma in individual temperature intervals.
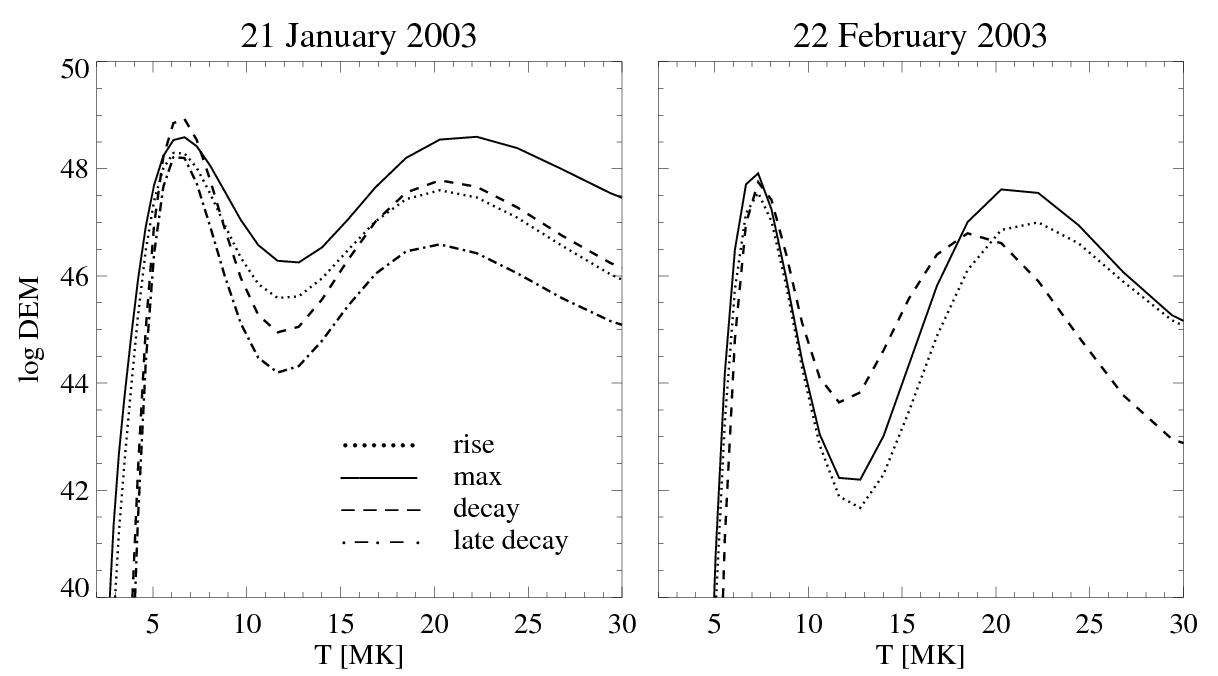
Fig. 8. The temperature distribution of the differential emission measure for two different flares: a long-duration limb flare of M1.9 X-ray class (January 21, 2003) and a short-duration one of C5.8 class occurring on the disk (February 22, 2003).
Figure 8 shows the DEM distributions obtained with the Withbroe–Sylwester method for two flares from the table (numbers 4 and 9). For the M1.9 flare of January 21, 2003 (number 4), the DEM curve corresponding to the late decay phase of the flare (18:15 UT) is shown together with the curves for the rise (15:00 UT), maximum (15:15 UT), and decay (16:30 UT) phases. The distributions are generally two-humped during these three hours, corresponding to two temperature components: a cold plasma with a temperature of 5–8 MK and a hot plasma with a temperature of 18–25 MK. The temperature of the cold component is almost constant during the flare, although the amount of the plasma changes considerably. During the late decay, the cold plasma amount is almost an order of magnitude higher than that during the rise phase. The amount of hot plasma decreases more substantially (by two orders of magnitude) during the decay. The maximum temperature of this component changes from 22 MK at the maximum phase to 20 MK in the following three hours.
The right panel of Fig. 8 shows the distribution of the differential emission measure for the C5.8 flare, which occurred on February 22, 2003, on the solar disk. It was a short-lived flare. Its X-ray duration was 12 min, while the previous flare lasted for 240 min (see table). For this flare, it is also seen that the most of the plasma is concentrated in two temperature components. However, in this case, the hot plasma cools from 22 MK at the rise phase to 19 MK at the decay phase over a few (six) minutes. At the decay phase, the amount of hot plasma is an order of magnitude smaller than that at the maximum phase.
CONCLUSIONS
The preliminary analysis of the spectra of nine flares obtained with the RESIK X-ray spectrometer shows the following:
The observed character of the 3.2 to 6.1 Å spectrum cannot be described within the framework of the one-temperature model. Although this fact was already known (Schmelz et al., 2001), many authors still use this assumption when studying the physical conditions in the solar plasma. It is worth stressing here that, if we determine the plasma parameters for a given moment using a single pair (
T, EM), these parameters can be far from the real conditions of plasma in the emitting volume. It is more reasonable to study the thermodynamic measure, which depends less on the actual distribution of the plasma temperature.Although the one-temperature approximation is rather rough, we may still carefully use the results it yields. This approximation is convenient for analyzing the temporal variations of the plasma heating function. The DD analysis allows one to determine whether the heating of the plasma extends into the flare decay or terminates abruptly after the impulsive phase. If the size of the emitting area is additionally known, the heating rate can be estimated.
From the fluxes measured in the selected lines observed with the RESIK instrument, the temperature distribution (DEM) of the plasma can be determined in the temperature interval from 3 to 30 MK. The present analysis shows that
Regardless the importance of a flare, its location on the disk, and the duration of the event, DEM is the two-component distribution: the colder and hot components are within 5–10 and 15–25 MK, respectively.
The relative amounts of cold and hot plasma, as well as their characteristic temperatures, change during
the flare’s evolution. The cooling of the hotter component is most clearly seen during the decay phase. It is worth noting in conclusion that many spectra, which are especially useful for investigation of temporal variations of the thermal plasma component, were obtained during the operation of the RESIK instrument (from August 2001 to May 2003). In the future, we plan to carry out a statistical analysis of the behavior of the thermal component of the flare plasma.
ACKNOWLEDGMENTS
The work was supported by the Polish Foundation for Science Research (project nos. 1.P03D.017.29 and PBZ-KBN-054/P03/2001).
REFERENCES
Dere, K.P., Landi, E., Mason, H.E., et al., CHIANTI—an Atomic Database for Emission Lines,
Astron. Astrophys., Suppl. Ser., 1997, vol. 125, pp. 149–173.Gabriel, A.H., Dielectronic Satellite Spectra for Highly- Charged Helium-Like Ion Lines,
Mon. Not. R. Astron. Soc, 1972, vol. 160, pp. 99–119.Grineva, Yu.I., Karev, V.V., Korneev, V.V., et al., Solar X-Ray Spectra Observed from the
INTERCOSMOS-4 Satellite and the VERTICAL-2 Rocket, Sol. Phys., 1973, vol. 29, pp. 441–446.Jakimiec, J., Sylwester, B., Sylwester, J., et al., Dynamics of Flaring Loops. II. Flare Evolution in the Density–Temperature Diagram,
Astron. Astrophys., 1992, vol. 253, pp. 269–276.Kepa, A., Sylwester, J., Sylwester, B., and Siarkowski, M., First Determinations of Differential Emission Measure Distribution Based on RESIK X-Ray Spectra,
Proc. IAU Symp. N. 223. “Multi-Wavelength Investigations of Solar Activity”, Stepanov, A.V., Benevolenskaya, E.E., and Kosovichev, A.G., Eds., 2004, vol. 223, pp. 461–462.Phillips, K.J.H. and Keenan, F.P., Solar Chlorine Abundance from an X-Ray Flare Spectrum,
Mon. Not. R. Astron. Soc., 1990, vol. 245, pp. 4–6.Phillips, K.J.H., Sylwester, J., Sylwester, B., and Landi, E., Solar Flare Abundances of Potassium, Argon, and Sulfur,
Astrophys. J., 2003, vol. 589, pp. L113–L116.Phillips, K.J.H., Dubau, J., Sylwester, J., et al., Temperature-Sensitive Line Ratio Diagnostics Based on Si Satelliteto-Resonance Line Ratios for 1s
2-1snp Transitions, Adv. Space Res., 2005 (in press).Schmelz, J.T., Scopies, R.T., Cirtain, J.W., et al., Observational Constraints on Coronal Heating Models Using Coronal Diagnostics Spectrometer and Soft X-Ray Telescope Data,
Astrophys. J., 2001, vol. 556, pp. 896–904.Serio, S., Reale, F., Jakimiec, J., et al., Dynamics of Flaring Loops. I. Thermodynamic Decay Scaling Laws,
Astron. Astrophys., 1991, vol. 241, pp. 197–202.Sylwester, J., Schrijver, J., and Mewe, R., Multitemperature Analysis of Solar X-Ray Line Emission,
Sol. Phys., 1980, vol. 67, pp. 285–309.Sylwester, B., Sylwester, J., Serio, S., et al., Dynamics of Flaring Loops. III. Interpretation of Flare Evolution in the Emission Measure-Temperature Diagram,
Astron. Astrophys., 1993, vol. 267, pp. 586–594.Sylwester J., Garcia H.A., Sylwester B., Quantitative Interpretation of
GOES Soft X-Ray Measurements, Astron. Astrophys., 1995, vol. 293, pp. 577–585.Sylwester, B., Sylwester, J., and Siarkowski, M., et al., Detection of H- and He-Like Resonance Lines of Chlorine in Solar Flare Spectra,
Proc. IAU Symp. No. 223 “Multi-wavelength investigations of solar activity,” Stepanov, A.V., Benevolenskaya, E.E., and Kosovichev, A.G., Eds., 2004, vol. 223, pp. 671–672.Sylwester, B., Sylwester, J., Siarkowski, M., et al., Identification of Lines in the Range 3.3 Å–6.1 Å Observed in RESIK Spectra,
Adv. Space Res., 2005a (in press).Sylwester, J., Sylwester, B., Phillips, K.J.H., et al., Analysis of Potassium Abundance Variability in a Large Number of Flares,
Adv. Space Res., 2005b (in press).Sylwester, J., Gaicki, I., Kordylewski, Z., et al., RESIK: A Bent Crystal X-Ray Spectrometer for Studies of Solar Coronal Plasma Composition,
Sol. Phys., 2005c, vol. 226, pp. 45–72.


