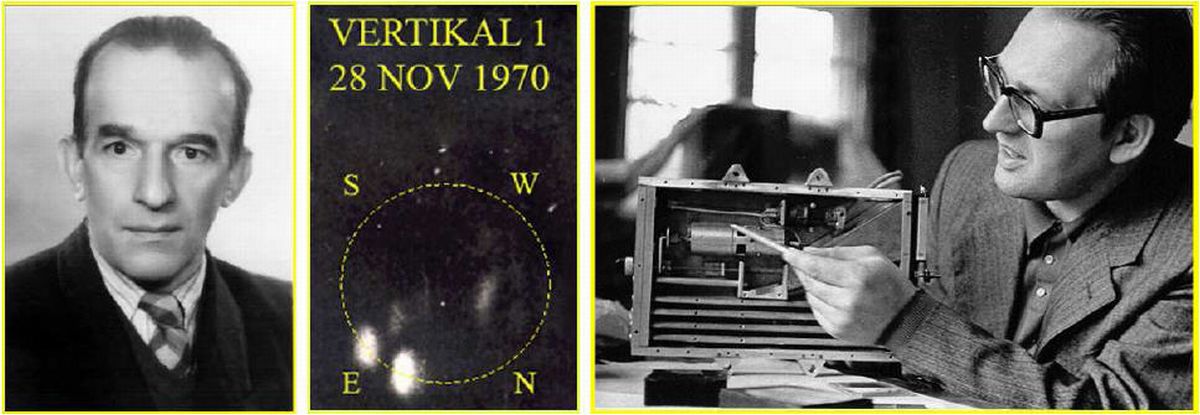
Figure 1: Left: Professor Jan Mergentaler (1901-1995), while in charge of the Astronomical Institute of the Wroclaw University, decided in late 60-ties to take the political opportunity and set-up a group of people designing the first Polish space experiment: the solar XUV spectrometer and X-ray pinhole camera.
Middle: Solar images obtained using pin-hole cameras during the flight of Vertical-1 sounding rocket on 28 November 1970.
Right: Dr. Zbigniew Kordylewski designer of the instrument unveils the hardware after the first successful flight which took place on 28 November 1970 aboard the Vertical-1 sounding rocket launched from Kapustin Yar (South of Russia).
Over the years we developed a number of instruments which have been launched aboard several sounding rockets and three satellite missions. These instruments have been designed to image the Sun in X-rays and measure solar X-ray spectra emitted by plasma of hot, multimillion degree coronal structures.
The Wrolcaw group was founded in 1970 with a small staff of engineers and solar physicists and yet in 1970 first Polish space experiment took place. It was X-ray spectroheliograph with a set of pin-hole cameras. Among the people who contributed the most to the Polish space experimenting is Dr. Zbigniew Kordylewski (now retired, see the photo in Figure 1 - to the right). In Figure 1 (centre) we show, for sake of illustration, the X-ray solar image obtained using the pin-hole cameras during the flight of Vertical-1 sounding rocket. This and the other (not shown) images constitute the first Polish scientific results obtained using space techniques. The analysis of the images allowed to identify presence of the hot component within non-flaring active region plasma (Kordylewski et. al., 1973), the result recently confirmed in the study of Yohkoh observations.
From the scientific point, the programme of experimental research of the the Solar Physics Division group as defined early-on by Professor Jerzy Jakimiec (from the Astronomical Institute of Wroclaw University), was set to be the investigation of the plasma conditions (temperature, emission measure) prevailing in various coronal structures. Understanding of the plasma properties in magnetically confined plasmas of solar corona forms the ground for investigation of the primary energy release and plasma heating processes. In this respect, the experimental work in the Solar Physics Division has been focused on the instrumentation providing the imaging and spectroscopy of the hot coronal plasmas. Work in these two areas preoccupied the interests of the experimenting group.
The chronological list of the experiments flown by the Wroclaw group is presented in Table 1.
It was understand from the beginning, that the studies in these main directions were the most scientifically sounded if the experiments were placed aboard the satellite solar missions. However, the important "evolutionary'' step consisted of development of the know-how and new experimental ideas. These were possible by placing the equipment first aboard the sounding rockets, where the access to the instrument was possible after the recovery and the same instruments with small modifications can be used in flight many times. In respect with, the early 15 years of space solar experimenting in Wroclaw brought many, mostly successful sounding rocket experiments with the Polish instruments placed next to the Russian and Czech aboard the Russian-led Vertical sounding rockets flown within the framework of the INTERCOSMOS programme (officially closed in early 90-ties). The payloads were mainly equipped with pin-holes, telescopes, photometers, spectrometers and the collimators - all intended to take observations of the solar corona in the X-ray band.
In Figure 2 our first telescopic X-ray image of the Sun (Kordylewski et al., 1973) taken using the grazing incidence mirror (developed at the Astronomical Institute of the Czech Academy of Sciences in Ondrejov by Boris Valnicek group) together with the first Polish X-ray spectra of the hot solar corona (Siarkowski and Sylwester, 1985) are presented. In early 90's, with the continuous improvement of experimental skills and opened access to better technology, a new era of studies began with the use of the satellite instruments. This was also the time when the contacts of the groups' members widely opened to the West. Thanks to the earlier contacts which were set-up between Professor Jakimiec and Professor de Jager, it was possible that I spent 6 months within the Utrecht group, working with Rolf Mewe and Hans Schrijver. This period was the most fruitful in terms of learning the basics of quantitative X-ray spectroscopy. The next step was the involvement in the operations of the most advanced Solar Maximum Mission, launched by NASA in 1980 with the X-ray polychromator abroad. Thanks to the generosity of Professor Len Culhane, Director of the Mullard Space Science Laboratory (UK) one of the XRP PI's, it was possible to take part in the operations of this instrument from the NASA GSFC and use the best-quality X-ray spectra in the plasma diagnostics. The analysis of these spectra brought in 1984 the discovery of plasma composition variations between flares (Sylwester, Lemen & Mewe, 1984).
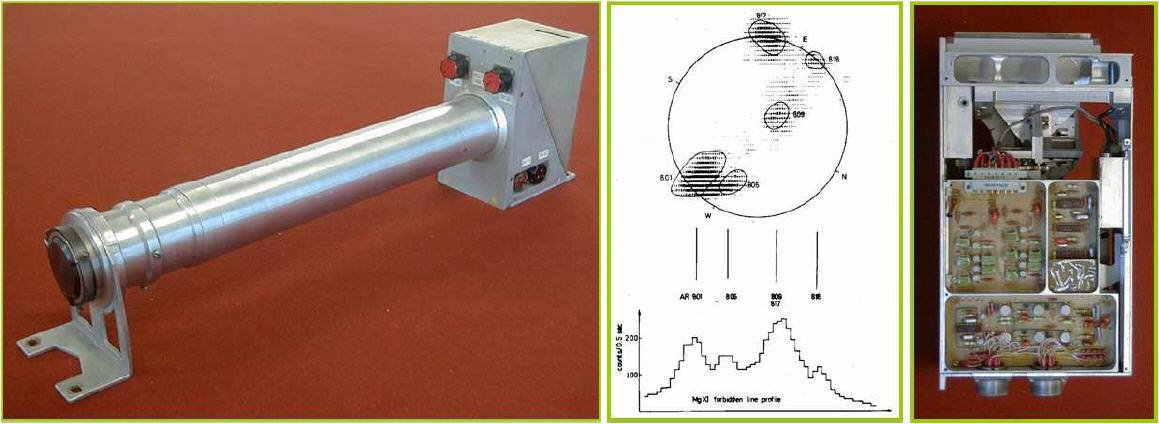
Figure 2: Left: The grazing-incidence Volter type-II solar telescope assembly. The mirror was designed by the Czech group from Ondrejov Astronomical Institute. The mechanical part including the shutter has been developed in Wrocaw. The instrument has been included aboard the Vertical-8 and -9 payloads flown in 1979 and 1980 respectively.
Centre: An example of experimental results showing digitized X-ray image of the corona obtained in the spectral range 8 Å - 12 Å (upper part) together with the corresponding brightness cut as seen in the resonance line of Mg XI ion recorded with the scanning Bragg crystal spectrometer MRF.
Right: Photo of the MRF Bragg, scanning, flat ADP crystal spectrometer (designed by M. Hłond), a part of the Polish instrument packages aboard Vertical-8 and -9 payloads.
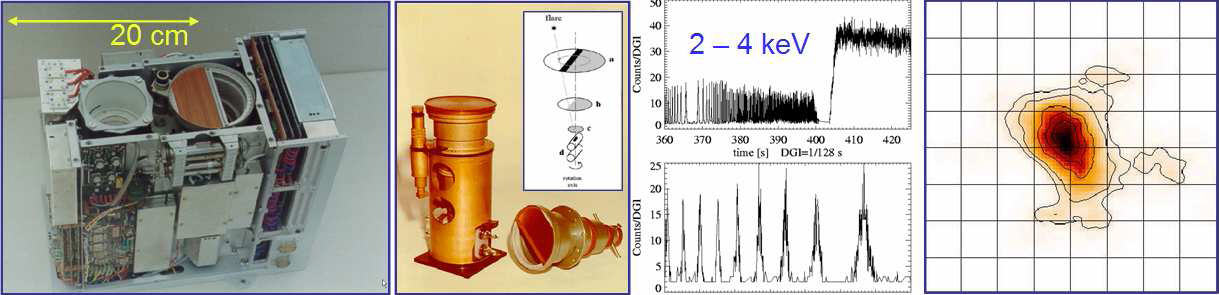
Figure 3: Left: General appearance of the RF15-I soft X-ray Photometer-Imager with the instrument cover removed. The box which contains both the photometer and the imager is placed atop the solar oriented platform of the INTERBALL-Tail.
Centre-left: The rotationally modulated collimator of a novel design, where the three wired grid planes replace five of the standard design, were sufficient to achieve ~ 10 ąrcsec angular resolution on the reconstructed image. As shown on the insert, the modullation pattern is present during only a half of the rotation which allows to study the intrinsic solar flux time variability with the resolution of 0.01 s.
Centre-right: The example of the time record of the modulated signal measured on 1995 October 20 around 06:14 UT, when the M1 class flare reached the maximum phase. The time indicated is in [s] elapsed from the beginning of the flare sequence. The spin period of the Sun-pointed satellite was ~ 120 s. The bottom part shows a part of the record enlarged in order to see the details.
Right: Numerically reconstructed image of the flare showing the overall shape of the active region plasma contributing to the 2 keV - 4 keV emission. The grid mesh is drawn 50 arcsec apart.
In the rest of this presentation, I shall focus on the important items of the recent satellite experimenting. These are the RF15-I X-ray photometer aboard the INTERBALL-Tail Probe and the two Bragg crystal spectrometers presently in orbit aboard the Coronas-F satellite.
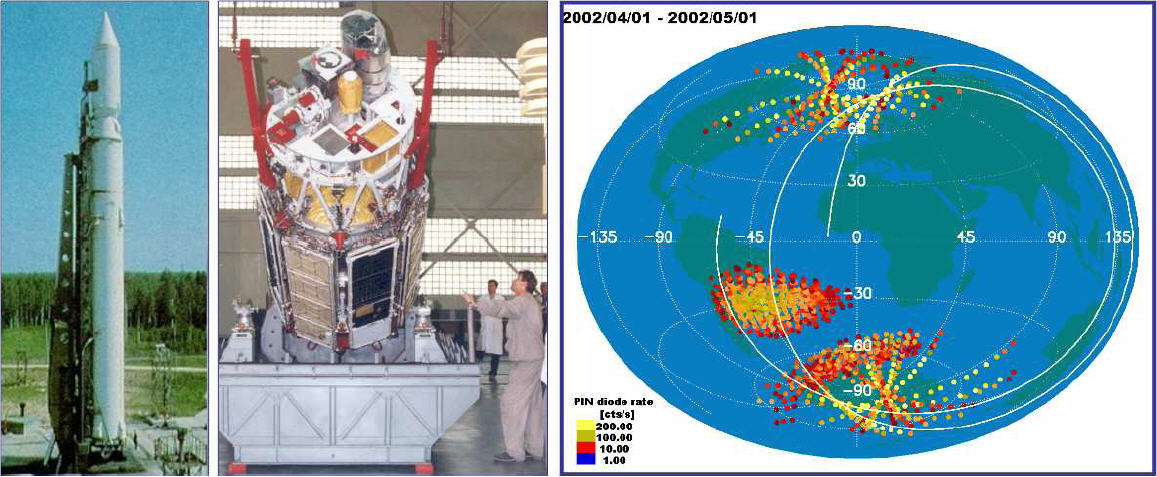
Figure 4: Left: The SS-14 Cyclon booster which put the CORONAS-F solar mission on the circular, semi-Sun-synchronous polar 500 km orbit on 31 June 2001.
Centre: The payload consisted of a dozen of solar instruments, including two Polish Bragg spectrometers: flat crystal, scanning Diogeness and bent crystal RESIK.
Right: The background particle environment at the CORONAS-F orbital heights as recorder by RESIK own PIN particle detectors. The SAA region as well as the polar ovals are clearly seen. In these high background areas, the spectrometers' proportional detectors were switched-OFF due to health reasons.
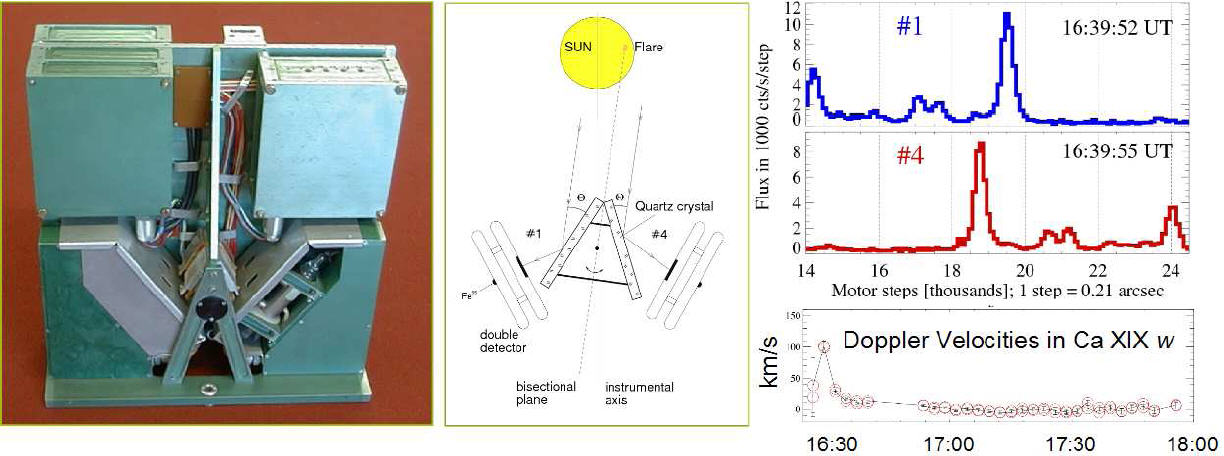
Figure 5: Left: Overall view of Diogeness scanning spectrometer. The four Bragg crystals are seen fixed to the moving arm which rocks within the range of ~ 140 arcmin relative to the line pointing to the Sun centre.
Centre: The scheme of Dopplerometer configuration adopted in the experiment. Bi-sector plane of the crystal pair #1 and #4 (dotted line) points momentarily towards the source (flare). Crystals are fixed mechanically at the exactly twice the Bragg angle. By rocking the fixed crystal section back and forward, the Bragg-reflected spectra in the vicinity of strong lines are measured by a pair of double proportional counters. In the ideal case of perfect co-alignment and for the source plasma being at rest, the line centres are recorded in channels #1 and #4 at the very same time during the scans performed in the opposite wavelength sense (upper right panels). Any radial motions of the hot flaring plasma will displace (in time) the relative position of lines (lower panel). The displacement is proportional to the line Doppler shift and is independent of the position of the source (flare) on the disc and/or the relative pointing, provided they are stable.
Right: In the upper part an example of measured spectra recorded nearly simultaneously in Dopplerometer channels #1 and #4 during the maximum phase of the X5.3 flare is shown plotted against the motor step number. Indicated are the times, when the centre of the strongest resonance line is measured. In the lower part, velocities as determined from X-ray line shifts observed by Diogeness are drawn. A high blue-shifts observed early in flare are of similar value in all lines measured. The uncertainties shown represent combined relative error of wavelength scale determination. For Ca XIX w line the uncertainties of velocity determinations (around the flare maximum phase) are few km/s only.
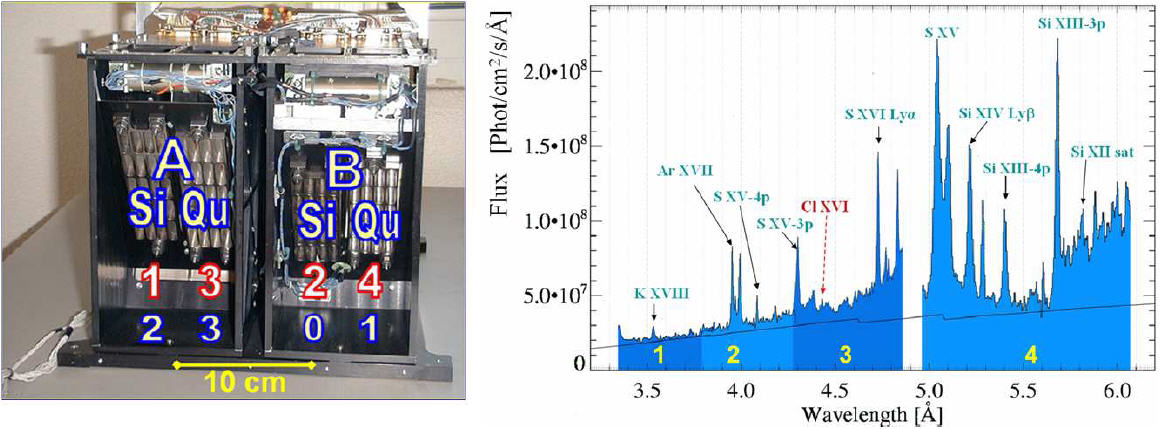
Figure 6: Left: Overall view of the RESIK spectrometers A and B with the back cover removed in order to show the bent crystal supports. The code-names for channels are indicated.
Right: Example reduced RESIK spectrum showing main prominent emission lines atop the X-ray continuum. The ions responsible for the line emission are indicated. The spectrum shown has been collected during the 20-minute rise phase of the M1.9 East-limb flare on 2003 January 21.
The RF15-I instrument, comprising a solar photometer and an imager, was designed (Sylwester et al., 2000) for multiband high time resolution measurements of integral solar fluxes in the energy range between 2 keV and 240 keV as well as for imaging of solar flares in the 2 - 8 keV energy range. The instrument was launched in August 1995 aboard the INTERBALL-Tail spacecraft. It has been making measurements since August 6, 1995 till 2000. As a partner in the RF15-I experiment, the Astronomical Institute of Czech Academy of Sciences in Ondrejov played a leading role. The Wroclaw team became involved in the programme in 1986, contributing to the unique X-ray Tomograph-Imager (XTI), a novel part of the instrument. The photometer and XTI were physically and electronically separated. They were however controlled by a common onboard computer PRAM. The INTERBALL-Tail was a spin-stabilized satellite placed on a highly elongated orbit, with ~ 180 000 km apogee and ~ 24 000 km perigee. The orbital period was ~ 96 hours.
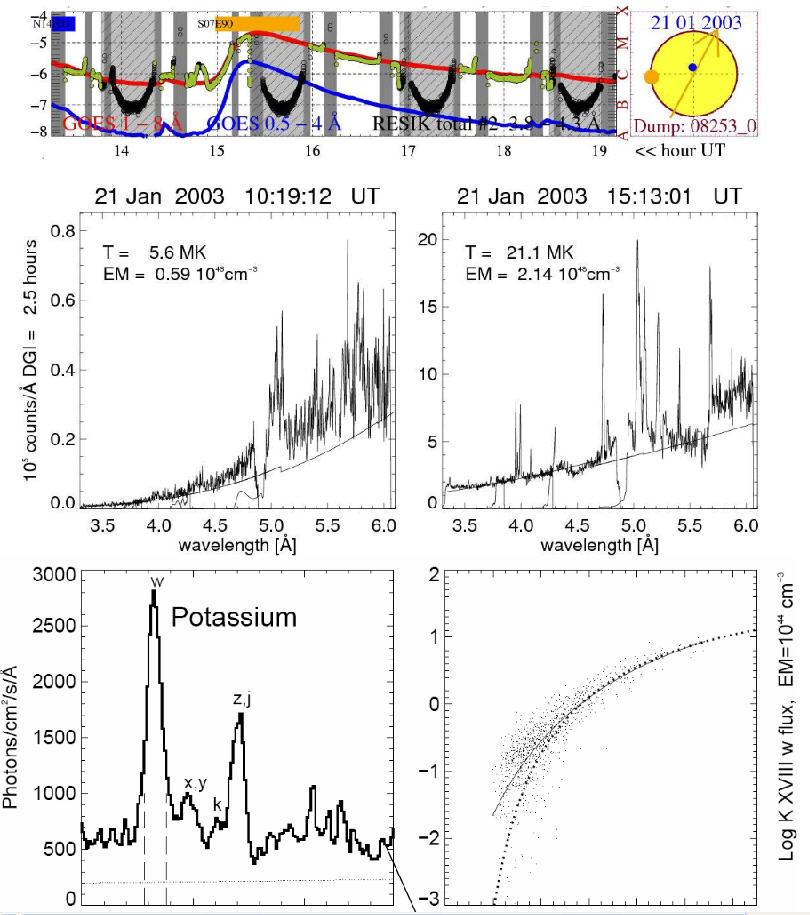
Figure 7: Upper: A header of one (among thousand) page from the RESIK catalogue showing a well observed flare. The X-ray lightcurves are plotted in red and blue for the GOES and in green for RESIK. Shaded areas correspond to transitions through radiation belts and/or SAA. Hatched areas correspond to spacecraft nights. Color bars correspond to flares which locations are shown on the solar disc in respective colors. The size of the color dot correspond to the flare importance.
Middle left: Pre-flare spectrum recorded several hours before the considered event. The thin line drawn corresponds to the continuum level calculated for the indicated values of temperature and emission measure.
Middle right: Spectrum recorded during the rise phase of flare. The plasma temperature is much higher and many emission lines are seen above the continuum in the spectral range below 5 Å.
Lower left: Average spectrum showing the spectral region in vicinity of the so-called He-like triplet of K xviii ion. This is the first observation of this spectral region with such a high spectral resolution.
Lower right: A comparison between the observed (points) and theoretically calculated temperature dependence of the line emissivity in the resonance line of K XVIII ion. A close match is seen if the theory line is drawn using the potassium abundance of 6.00 x 10⁻⁷, four times the photospheric one.
The photometer sensitivity was approximately equivalent to that of a well-known GOES X-ray sensors. At our web site (www.cbk.pan.wroc.pl/rf15-i_www/RF15-I_observations.htm) we put all processed data from the photometer along with a short explanations. One of the important advantages of RF measurements is that there are many periods where the solar signal has been measured every 2 s continuously for up to 40 hours in the four bands covering the 2 - 15 keV energy range. The overall data coverage of the solar X-ray photometry is ~ 85%. As concerns the data collected in the higher energy channels, reliable measurements have been made for hundreds of events (Siarkowski et al., 1999).
A concept of imaging modulation collimator applied in XTI construction is based on a possibility of reconstruction of full two-dimensional images from sets of one-dimensional projections. The principles of the (rotating) modulation collimator have been described in-depth by Oda et al. (1976) and used at present in the design of the RHESSI instrument (Lin et al. 2002). In our X-ray Tomograph-Imager we incorporated a similar, but modified design. The XTI consists of two units: the X-ray collimator, and the optical solar disk sensor. The purpose of the collimator is to modulate and measure the X-ray signal from flares and the hottest parts of active regions. Since the rotation axis of the INTERBALL-Tail satellite is mostly offset from the X-ray source by a few degrees, the recurrent transmission windows of the collimator become available for modulation of X-rays, as the phase of source relative to the optical plane of the collimator changes. The concept of the collimator construction adopted in XTI is presented in Figure 3. Due to rotation of the satellite, the X-rays from a solar source are modulated, depending on the actual phase of the rotation. The collimator field of view has a radius of ~ 11°, and the collimator has been designed to have a number of narrow transmission windows separated by 4.8 arc min. These selected design characteristics allow to isolate a flaring area in the Sun covering thus the entire flare without overlapping. In order to have a simpler pattern of modulation fringes, we decided to make grids of circular cross-section wires. A cheap and easy solution was to use standard copper wires. The wire orientation has been fixed exactly parallel (to within 1mm) between the three grid planes using an interferometric technique. The grid plane positions, exact wire diameters and the pitch have been designed according to the physical requirements. The exact location of the grid planes have been calculated according to a novel strategy. The novelty of the solution is the use of semi-numerical interactive method of placing the grids. In case of the XTI, we specified the approximate values for the collimator length, thickness of grids, desired resolution and transmission fringe separation and found the optimum collimator design. In Figure 3, an example of the XTI modulated signal for the 1995 October 20 flare is shown. There are hundreds of periods identified already where the imaging sequences have been executed. The RF15-I was one of the most sensitive solar photometers in the 10 - 15 keV band and the only X-ray instrument measuring solar flux in the entire energy range 2 - 240 keV. By observing the Sun since September 1995 till 2000 this photometer has supplied complementary data to GOES, BATSE and HXT (Yohkoh) measurements. Many flares have been detected with the hard X-ray emission extending up to 30 keV - 60 keV which have fallen into times of the BATSE and/or Yohkoh nights and hence have not been reported. A number of weak (GOES class B) flares have been observed to pronounce exceptionally hard X-ray spectra extending up to ~ 120 keV energy (Siarkowski et al., 1999). RF15-I data are still under analysis (Siarkowski et al., 2005).
The CORONAS-F spacecraft is the second of two Russian space observatories devoted to solar and magnetospheric physics, designed to be operational during present, close to the end, 23rd solar activity cycle. The third mission CORONAS-Photon is due to be launched early into the 24th activity cycle. The primary objectives of these Missions are the study of solar global oscillations, variations in the solar ultraviolet radiation, and flare and active region X-ray, gamma-ray, and particle emission. Except Polish spectrometers which results are shortly outlined here, there are dozen of Russian instruments, discussed elsewhere (Kuznetsov et al., 2005) placed aboard CORONAS-F. The spacecraft is put in a near-circular orbit with an altitude ranging from 501 km to 549 km, with an orbital plane inclined at 82°.5 to the equator, and orbital period of 95 minutes. The near-polar orbit allows periods of uninterrupted observations of the Sun for up to about 20 days: the longest satellite night lasts ~ 35 minutes. Passages through the Earth's radiation belts require most X-ray instruments to be turned off in order to secure their health; these include passages through the South Atlantic Anomaly (SAA) as well as the auroral oval (AO) regions near the magnetic poles. In Figure 4, the satellite orbit is plotted over the Earth map, with the regions of enhanced particle background indicated, as detected from RESIK radiation particle sensors. Diogeness is the uncollimated scanning flat crystal spectrometer observing flare X-ray spectra in four narrow wavelength bands in vicinity of Ca XIX, S XV and Si XIII He-like line "triplets'' around 3.18 Å, 5.04 Å and 6.65 Å. In two spectral channels, the same emission lines around Ca XIX 3.178 Å resonance are scanned in opposite directions, being diffracted from precisely adjusted identical Quartz crystals mounted on the common shaft in so-called Dopplerometer configuration. The idea of relative measurements of the Doppler shifts is explained on a schematic diagram in Figure 5 (centre panel). During early phase of the CORONAS-F Mission, a number of big flares have been observed by Diogeness. In particular, tens of high resolution spectra have been measured during initial, maximum and decay phase of 2001 August 25, X5.3 flare. We made the analysis of these spectra, performed prompt line identification, announcing observations of new spectral features corresponding to transitions in a number of H- and He-like ions (Sylwester B., 2005). In Figure 5 (right part) we show example spectral records and the results of their analysis which led to precise determinations of plasma radial motions during the X5.3 flare.
Early interpretation of the spectra measured indicates for substantial variations of average plasma temperature during the observed flare. When defining our recent programme of experimental spectroscopic studies of the corona, we have noticed that large ``gaps'' are still present in detailed observations of solar spectra in the soft X-range, below ~ 7 Å. Therefore we decided to devise a new spectrometer intended to cover this spectral region with observations in a systematic way. In collaboration with leading groups from Naval Research Laboratory, USA (NRL), Mullard Space Science Laboratory (MSSL), Rutherford-Appleton Laboratory (RAL, both from UK) and IZMIRAN (Russia) we constructed REntgenovsky Spektrometr s Izognutymi Kristalami (RESIK), the bent crystal spectrometer, described in details by Sylwester et al., (2005). RESIK has the best ever spectral resolution and sensitivity in the range between 3.3 Å and 6.0 Å. Spectra from solar flares seen by RESIK include strong emission lines of highly ionized Si, S, and Ar atoms, together with lines from the low-abundance, odd-Z elements K and Cl (see Figure 6). Some of these lines are also seen in the spectra of bright, non-flaring active regions, and several lines have been observed for the first time in the astrophysical spectra. RESIK has collected over 500 000 spectra of flares, active regions and ``quiet corona'' over approximately two years of its operation since launch. At present its activity is suspended by problems with the power supply. Some of the details concerning the operation of the instrument may be found in the RESIK Weekly Newsletters (http://www.cbk.pan.wroc.pl/weekly_archive/szablon.htm). Scientific issues being presently addressed in the ongoing analysis of RESIK data include:
In Figure 7, we present a collage of figures and plots showing example data and results obtained with RESIK. Upper part is a section of the RESIK on-line web catalogue where the lightcurve of example flare is presented atop the GOES X-ray standard measurements and spacecraft environment. Examples of reduced absolute spectra are shown in the middle row. The high-temperature spectrum has been collected during the flare fast rise. The low temperature spectrum has been measured few hours before the event, when no flare was in progress. In the lower panel, we show an average spectrum of the narrow wavelength band in vicinity of the potassium 'triplet' which never before was observed in such a high resolution. The lower-left plot constitute the first ``empirical'' determination of the potassium He-like ion resonance line temperature-emissivity curve compared with recent theory (CHIANTI).
Among the most important scientific results already obtained from the interpretation of RESIK and Diogeness spectra are: identification of several new lines, including the triplet lines of He-like Cl (Sylwester B. et al., 2005), higher members of resonance series (Kepa et al, 2005), new satellite diagnostic based on interpretation of n = 3 satellite line intensities (Phillips et al., 2005).
Experimental successes of the Wroclaw group paved the way for a new adventure. At the moment the construction of the new spectrophotometer SphinX (Solar photometer in X-rays) is underway. The instrument will be capable of taking solar spectra at the rate of ~ 100/s, two orders of magnitude faster than presently possible. It will act also as the flare watch for the TESIS large telescope complex under construction by our Russian partner from P.N. Lebedev Physical Institute at Moscow.
Acknowledged is the financial support for space experimenting received from the Polish Ministry of Science grants: 2 2150 92 03p/24, 2 Z6Z6 001 05p11, 2 P03C 005 08, 2 P03C 006 13, 2.P03D.024.17, 2.P03D.002.22 and PBZ-KBN-054/P03/2001, and the Exchange Visitors Programme between The Royal Society and The Polish Academy of Sciences. The help from our Russian partners was essential in providing a free lift of all Wroclaw space experiments and their free ground support including spacecraft control, steering and telemetry necessary to allow the operation of the instruments in real time.
I would like to thank Barbara Sylwester for useful discussions and help in preparing this review.