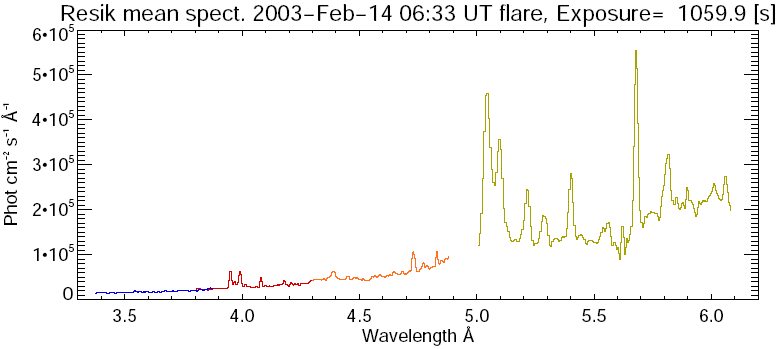
| INSTRUMENT | STRING | INSTRUMENT NAME |
| OBSERVATION_TYPE | STRING | TYPE OF OBSERVATION |
| SPECTRA_UNITS | STRING | UNITS OF RESIK ABSOLUTE SPECTRA |
| WVL_UNITS | STRING | WAVELENGTHS UNITS |
| SPC_N | LONG | NUMBER OF SPECTRA IN THE FILE |
| BIN_N | INT | NUMBER OF BINS per RESIK CHANNEL |
| CHAN_N | INT | NUMBER RESIK CHANNELS |
| SPEC_ID | LONG | SPECTRUM NUMBER (starting from 0) |
| STIME_ST | STRING | SPECTRUM START TIME |
| STIME_CE | STRING | SPECTRUM CENTRAL TIME |
| STIME_EN | STRING | SPECTRUM END TIME |
| TIME_ST | DOUBLE | SPECTRUM START TIME - JULIAN TIME |
| TIME_CE | DOUBLE | SPECTRUM CENTRAL TIME - JULIAN TIME |
| TIME_EN | DOUBLE | SPECTRUM END TIME - JULIAN TIME |
| EXPDUR | FLOAT | SPECTRUM EXPOSURE DURATION IN SECONDS |
2) data - the RESIK data cube is a (256, 16, n) array where n is the number of spectra read by resik_read_fits.
data(*, 0:3, *) - wavelengths of particular RESIK channels
data(*, 4:7, *) - absolute RESIK spectra
data(*, 8:11, *) - uncertaintees of RESIK spectra
data(*, 12:15, *) - Level-0 data, RESIK spectra corrected for orbital background
Using RESIK data within IDL environment (examples)
Plotting single spectrum in selected channel with uncertainties
1) plot resik spectrum for channel 1
plot, data[*, 0, 0], data[*, 4, 0], yst=10, xra=[3.3, 3.9],xst=1
errplot, data[*, 0, 0], data[*, 4, 0]*(1-data[*, 8, 0]), data[*, 4, 0]*(1+data[*, 8, 0])
2) Plotting spectrum selected channel integrated over all spectra with
uncertainties
a) summing the array
zz=total(reform(data[*, 4, *]),2)
b) processing uncertainties (summation of assumed Gaussian dispersions)
uu=sqrt(total(reform(data[*, 8, *]^2),2))/n_elements(index)
plot,data[*, 0, *],zz,psym=10,xra=[3.3, 3.9],xst=1,yst=1
errplot,data[*, 0, 0],zz*(1-uu),zz*(1+uu)

