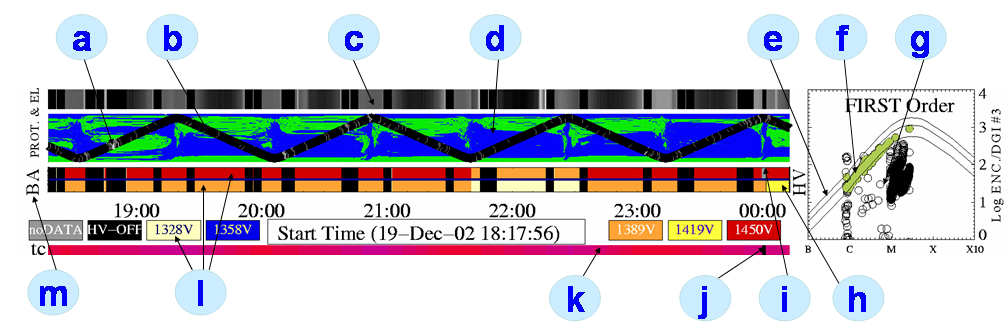
a - Particles (protons) from PIN detectors due to SAA passage.
b - Orbital position of CORONAS at each time.
c - Electron particle environment of the satellite as derived from so-called „rubbish” PHA bins (0 and 31). Brighter colours correspond to larger particle fluxes.
d - Earth map in projection where equal are longitude zones crossed by S/C in each DGI.
e - Proportionality band on the RESIK Channel #3 vs GOES 1 - 8 Å flux plot, where spectra are assumed to be of good quality, solar origin.
f - Measurements taken during favourable environmental conditions i.e. low background during S/C day (in green).
g - Measurements taken during unfavourable times i.e. S/C nights or high particle background emission or in the third order mode (in black) (see Legend „Higher Order” for more info).
h - The HV on detector B changed from 1389 V to 1419 V.
i - Data gap for detector A indicated as dark gray band.
j - Data gap for detector A indicated as d
| k - Crystal temperature indicator. Darker green represents ~10oC, purple ~40oC (see temperature bar). |
 |
l - Detectors’ High Voltage indicator. Changing colours represent actualvoltage settings see colour boxes.