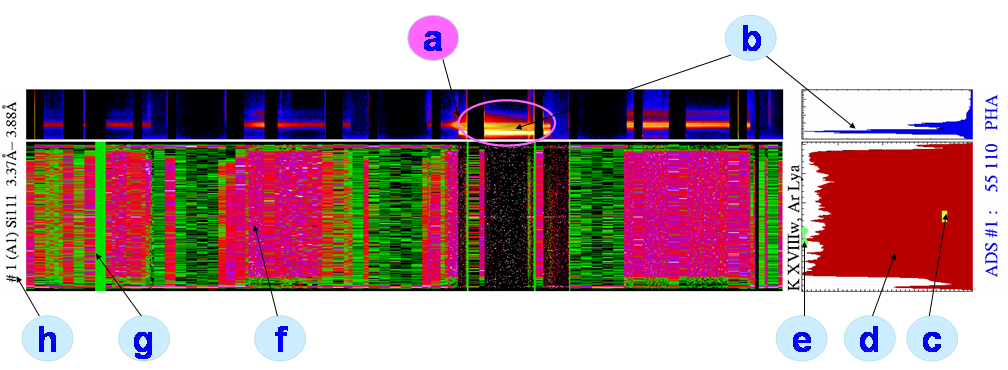
b - PHA amplitude histogram (in bins 0÷30) for each DGI. The peak corresponds to Si fluorescence emission from the crystals. Crystals – reflected solar emission is seen in the wings of fluorescent peak towards higher bins. The average histogram of PHA distribution over entire time displayed is shown in blue
c - The size of the bar represents the maximum shift in the line position due to changing location of flare on the solar disc.
d - The sum of all normalized spectra taken over entire time range displayed for given band. All day & night periods are included. This representation ENHANCES the weak spectral structures and noise. .
f - Spectra normalized to their maxima. Orbital background is removed. So the observed intensity variations represent RELATIVE changes.