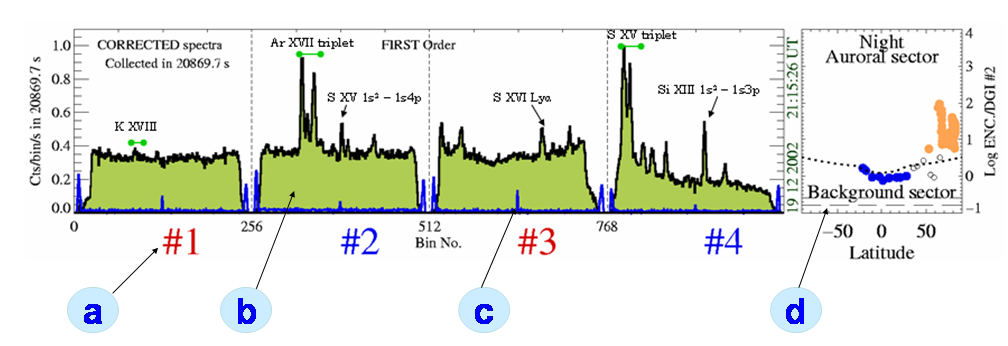
b - The solar spectrum representing the average taken over all good intervals contained in the presented time range. The average has been taken over promptly corrected individual spectra. The orbital background has been removed and notch correction applied. For some of the stronger lines the inentification is given. The work is in progress. See also Week 40, 2002. The overall time for which the spectrum shown has been collected is indicated. The end bins for each channel are shown on the horizontal axis (cf. vertical dashed lines).
c - Background signal distribution over spectral bins (in blue). This background has been removed from the solar spectrum.
d - Plot of the spectral signal (encoded events) measured during the night portion of the orbit. On the vertical axis the count rate in the spectrum observed in #2 is indicated and on the horizontal axis, the geographical latitude of the spacecraft. In blue are indicated points, where the spectral signal represents „pure” orbital background. The average spectrum for these observations is treated as the particle background and is appropriately subtracted from the solar spectra. In the light brown are indicated points collected during transits of the auroral regions, where in-situ X-ray emission may contaminate the measured spectrum. The dotted line is the division line between the auroral and background regimes. Points falling below the long-dashed horizontal line are being rejected from the analysis.