(Week 47, 2002, 18 Nov. - 24 Nov.)
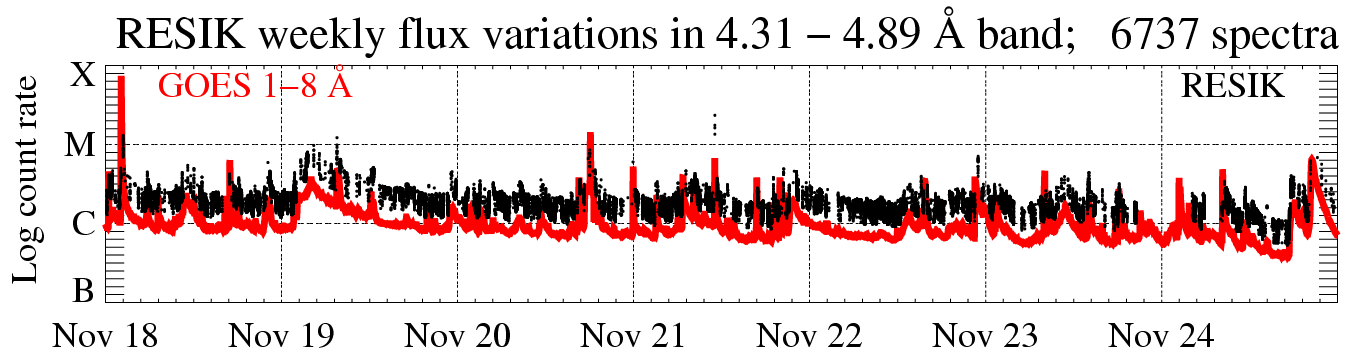
In the display above (click to enlarge), the solar X-ray fluence seen by RESIK (black points) is plotted atop GOES red line. Only periods with good spectral measurements are indicated. The total number of good spectral measurements is given in the title line.
| New mode: | Tests
of the '3rd order reflections' (ORD3) operating mode have been performed (on Nov 19 03:30:00 UT) with full success. We have new 'standard' mode 'ORD3' from 20 Nov 17:00:00 UT . The settings are below. |
|||||
| Calibrations made: |
No calibrations made | |||||
| ADS Settings: | HV: Det. A - 1450 V, Det. B - 1389 V. ADS are below. | |||||
 |
||||||
|
Channel |
l Band | ADS | ||||
| #1 | #2 | 3.37 - 3.88 Å : 35 - 85 | ||||
| #2 | #0 | 3.82 - 4.33 Å : 70 - 120 | ||||
| #3 | #3 | 4.31 - 4.89 Å : 55 - 110 | ||||
| #4 | #1 | 4.96 - 6.09 Å : 90 - 160 | ||||
|
|
|
software indexes | ||||
| spectroscopic notation (papers) | ||||||
Data gaps due to missing telemetry: ~10 hours.
Examples of Well-observed Events:
03 August 2002, 19:07 UT
For this time we have selected short duration limb flare of GOES class X. The
event has been observed by RESIK in dynamic DGI operation mode.
|
|
||
| Date: | 03 August 2002 | |
| Start, Max, End [UT]: | 18:59:00, 19:07:00, 19:11:00 | |
| GOES Importance: | X1.0 | |
| Duration: | ~12 min. | |
| Ha Class: | SF | |
| NOAA AR association: | 9893 | |
| Location (EIT): | S16 W87 | |
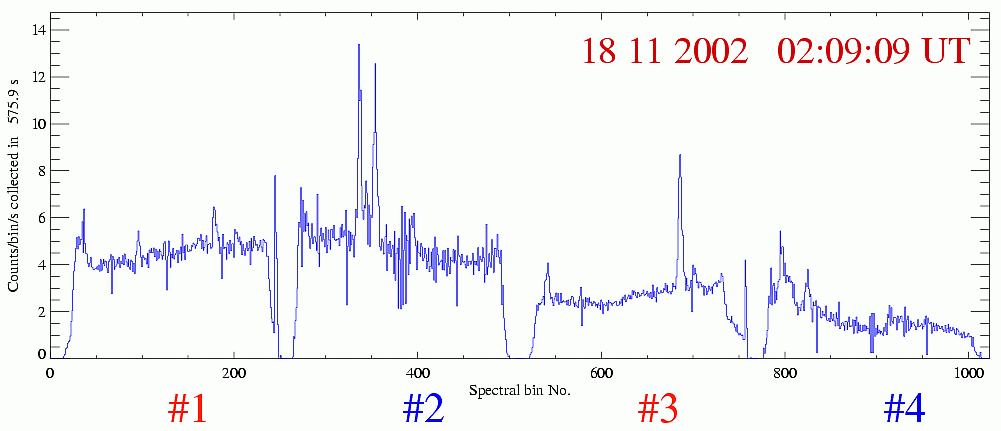
Below, the specta integrated over characteristic phases of this flare evolution are
presented.
The spectra integrated over the flare rise phase (19.0 UT-10.1 UT).
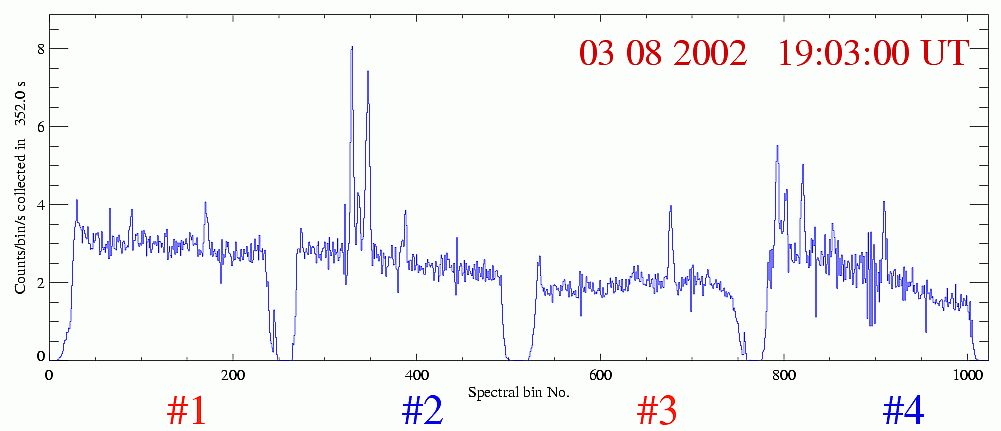
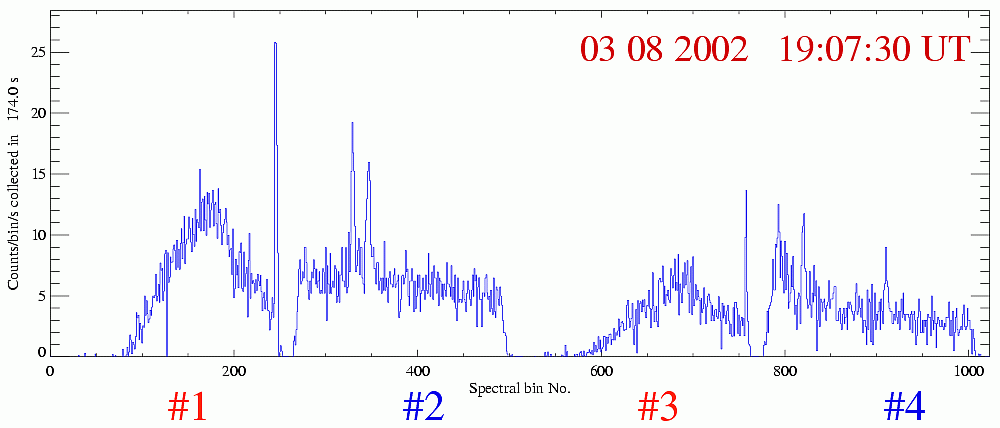
The spectra integrated over the flare maximum (19.10 UT-19.15 UT).
The spectra integrated over the early decay (19.15 UT-19.25 UT).
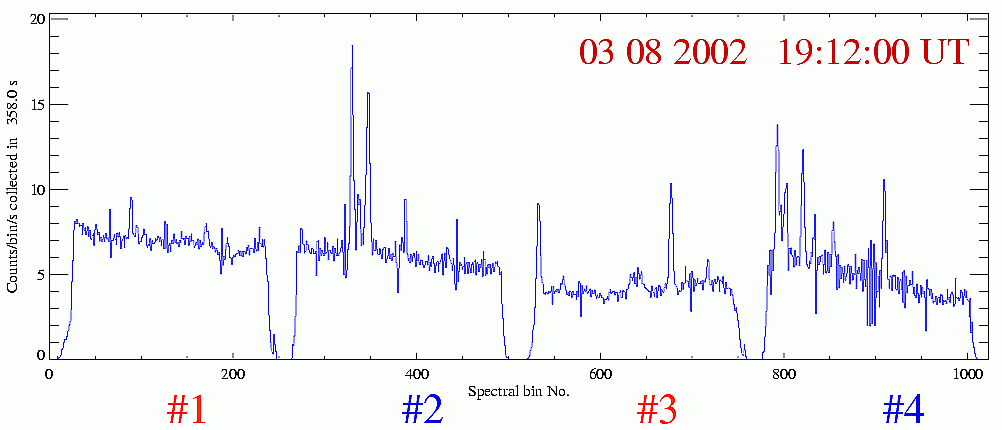
The spectra integrated over the late decay (19.25 UT-19.35 UT).
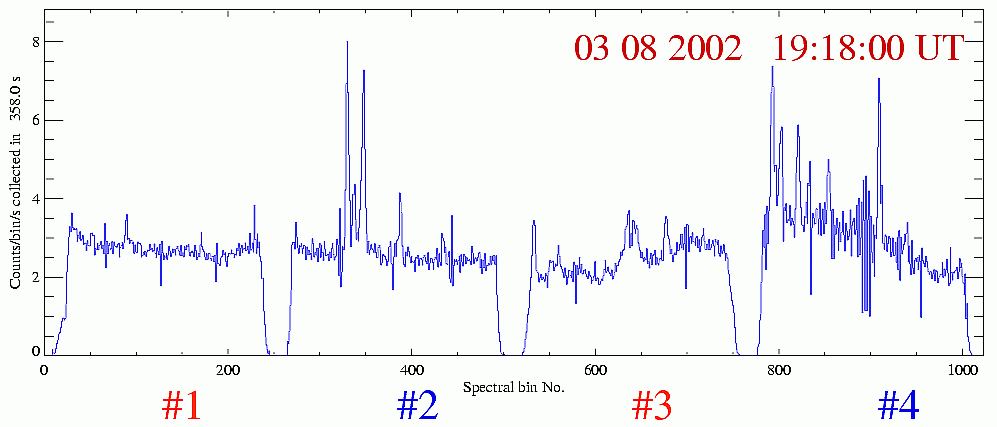
As the flare evolves the relative intensity ratios of the line observed in
individual channels are changing. Some peculiarities can be noted which make
this flare distinguishable from other events.
In #1 the He-like K XVIII ion triplet (bins
80-100) and the Ly-a line (uresolved spin doublet) due to H-like Ar
XVIII (bin no. ~170) are evident even during the decay.
In #2 the most prominent feature is He-like Ar XVII
triplet (320-350 bins). The relative ratio of resonance and forbidden line
intensities does not become reversed during the late decay as is usually observed
when plasma is cool enough. All these indicate for existing some amount of the
hot plasma at that time. Around the bin no. 390 the S XV line corresponding to
the transition 1s2- 1s4p is also present over this time. As concerns #3 the
most intense is the Ly-a doublet of S XVI ion (bin
no. ~675). The intensity of this line in comparison with near by continuum
changes during the flare evolution very much. The most evident changes of
relative intensities in #4 occur for the resonance line of S XV
(~bin no. 790) and Si XIII 1s2-1s3p transition (at ~910
bin no.).
(The spectra taken at the flare maximum are severly distorted due to detector's A saturation, so #1 and #3 can not be used to the
analysis during that time.)
Report prepared by: Barbara Sylwester bs@cbk.pan.wroc.pl
The report presented has been done in "real time" and so it may
contain jargon, blunders, or trivialities. We do not have also an English native
speaker in our Wroclaw group! We would be happy to discuss problems mentioned
above in more details if necessary.
RESIK data are in the open public domain and can be requested from: http://surfwww.mssl.ucl.ac.uk/surf/data_request.html.
Previous RESIK_weekly notes are in the
archive:
http://www.cbk.pan.wroc.pl/resik_archive.htm
Page made on 28November 2002 by: Jarek Bakala jb@cbk.pan.wroc.pl
