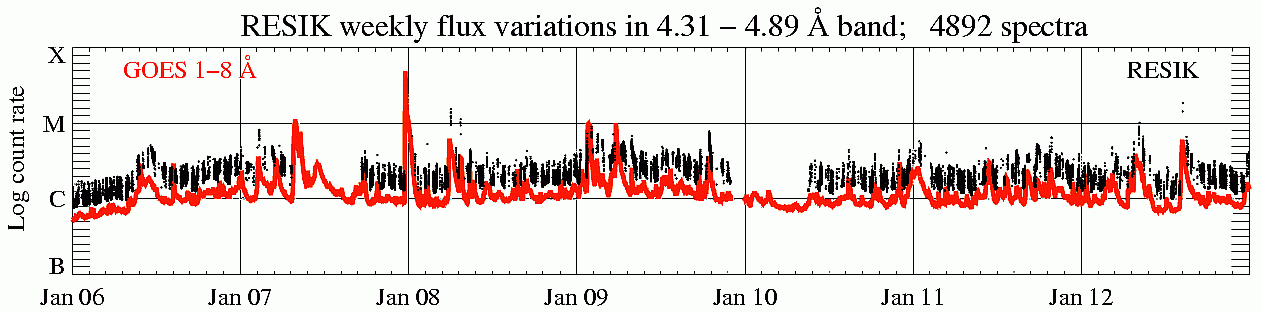
(Week 02, 2003, 06 Jan. - 12 Jan.)
In the display above (click to enlarge), the solar X-ray fluence seen by RESIK (black points) is plotted atop GOES red line. Only periods with good spectral measurements are indicated. The total number of good spectral measurements is given in the title line.
|
Operation mode: |
'3rd order reflections'
(ORD3) is used as stand-by mode. 3rd order measurements are indicated on the main catalogue page http://www.cbk.pan.wroc.pl/resik_catalogue.htm (cf. green boxes).
|
|
|
Calibrations made: |
No
calibrations made
| |
|
ADS Settings: |
||
|
| ||
| (ORD1) HV: Det. A - 1450 V, Det. B - 1419 V. | (ORD3) HV: Det. A - 1389 V, Det. B - 1328 V. | ||||||
|
Channel |
l Band |
ADS |
Channel |
l Band |
ADS | ||
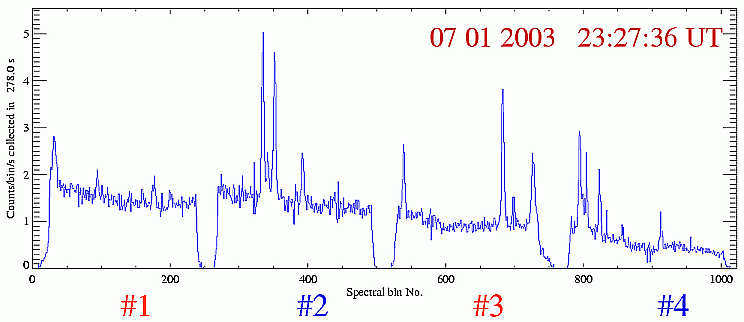
| #1 | #2 | 3.37 - 3.88 Å | 55 - 110 | #1 | #2 | 1.16 - 1.29 Å | 110 - 230 |
| #2 | #0 | 3.82 - 4.33 Å | 80 - 165 | #2 | #0 | 1.27 - 1.44 Å | 110 - 230 |
| #3 | #3 | 4.31 - 4.89 Å | 90 - 160 | #3 | #3 | 1.44 - 1.63 Å | 110 - 230 |
| #4 | #1 | 4.96 - 6.09 Å | 135 - 200 | #4 | #1 | 1.65 - 2.03 Å | 140 - 230 |
|
|
|||||||
Data gaps due to missing telemetry: ~ 10.5 h.
Note, that the link to the catalogue page has changed. It is now: http://www.cbk.pan.wroc.pl/resik_catalogue.htm. Starting from week 02, 2003, an improved catalogue page is used (c.f. W02, 2003) combining into one page the information previously reported in two pages. A new 2003 Catalogue Legend is in preparation.
Temperature is among the basic characteristics of the space instrument. In case of the Bragg spectrometer like RESIK, any large and fast variation of the crystals support's temperature may cause the bent crystal wafer to separate. If the EUV entrance filter brakes, the crystals would be directly illuminated by the solar heat flux and their temperature could rise dramatically.
RESIK spectrometer units A & B are placed atop the CORONAS-F instrument payload as illustrated in W50, 2002. Except for the entrance apertures, the instrument is covered by a general satellite thermal shield in order to lessen the effects of direct solar heating and heat exchange between the scientific payload and the open space. The instrument control unit COMP is placed quite apart from the payload (~2.5 m) inside the pressurized container filled with argon at approximately the ground pressure. So, there the thermal conditions are well stabilized with the temperature kept constant around +15ş C.
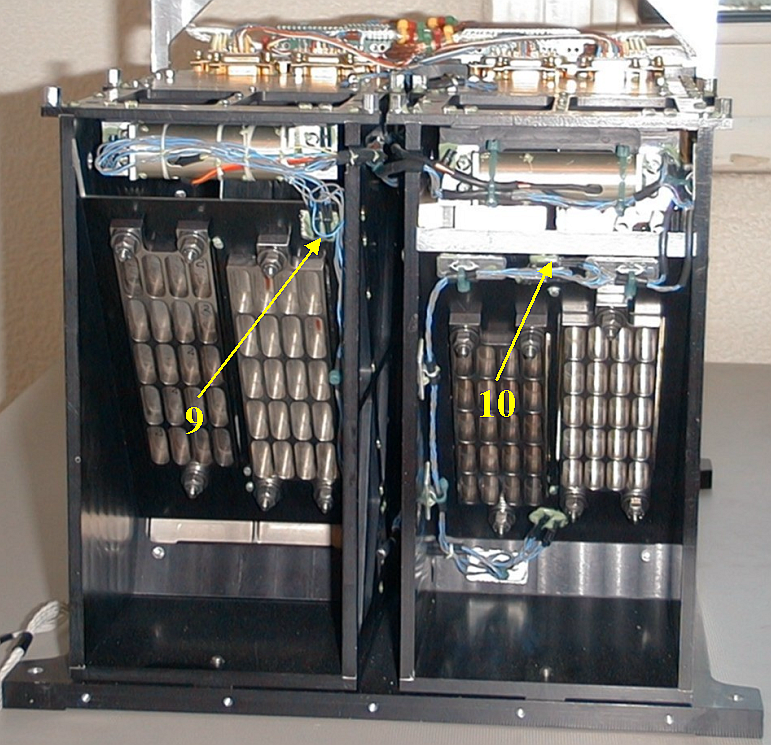
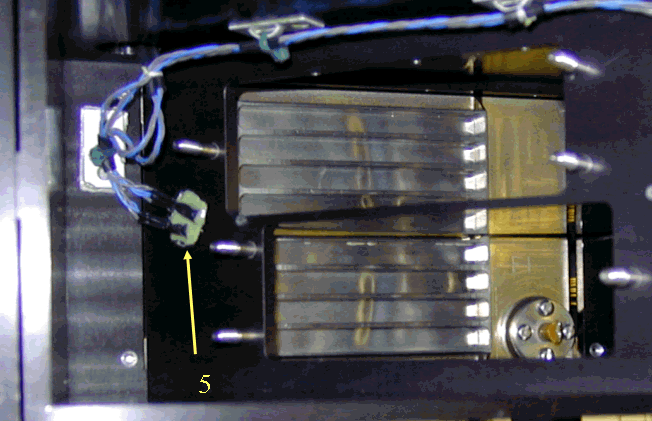
In order to better understand the thermal conditions inside the spectrometer units, we decided to glue a number (13 + 13 redundant) of standard temperature sensors to the important spectrometers units. The Table with sensors placement is given below. We have used the DS1820 units manufactured by Dallas Semiconductor as temperature sensors. They provide temperature readouts within the range 55şC ÷ +125şC (with the accuracy of ±0.5şC in the narrower range between 0şC and 70şC). The temperature readouts are being sent to the telemetry each basic DGI (now 2 s) by means of commuting through all of them in a cycle lasting 13 consecutive DGI units. In the picture below, we show photos of RESIK disassembled, indicating (with arrows) the placement of the sensors. Key numbers correspond to sensors software indexes as given in the Table.
Table 1. Location of the temperature sensors within RESIK
|
|
Placement |
|
5
|
Detector plate A
|
|
6 |
Detector plate B
|
|
7 |
HVU support plate A
|
|
8 |
HVU support plate B
|
|
9 |
Crystal plate A
|
|
10 |
Crystal plate B
|
|
11 |
Cal motor bracket A
|
|
12 |
Cal motor bracket B
|
|
13 |
Struct. Sun end A
|
|
14 |
Struct. Sun end B
|
|
15 |
Struct. base plate end A
|
|
16 |
Struct. base plate end B
|
|
17 |
Power
supply unit
|
|
18 |
Struct. base plate end A
|
|
19 |
Struct. base plate end B
|
|
20 |
Power supply unit |
* Values of respective temperatures are stored in the variable UTP_S [i,*] in RESIK data files. Stored value represents twice the temperature expressed in centigrades.
Figure 1a. Arrangement of tempearture sensors on the crystal support plates.
Figure 1b. Arrangement of tempearture sensors on the front, Sun-pointing plate of RESIK instrument.
In Fig. 2, we illustrate the variations of the temperature of RESIK crystals. The line plotted represents the average of the values measured on both A and B crystal supports. Seasonal variations are clearly seen. These variations reflect average time spent by the CORONAS-F satellite in the Sun-lit portion of the orbit. The temperatures reach plateau (around +40şC) during times when the spacecraft does not enter Earth shadow for extended periods of many days. Presence of such periods is characteristic of the semi Sun-synchronous orbit of the satellite. In addition, we plotted in Fig. 2, the seasonal variations of the low voltage provided by RESIK main power supply unit. One can notice a slight correlation of this voltage level with the temperature. Somewhat worrying is the fact that the voltage level shows decreasing trend, coming close by now to the lower nominal voltage level necessary for proper functioning of the spectrometer. In case this trend is continued, we will have to switch to the redundant power supply unit if necessary.
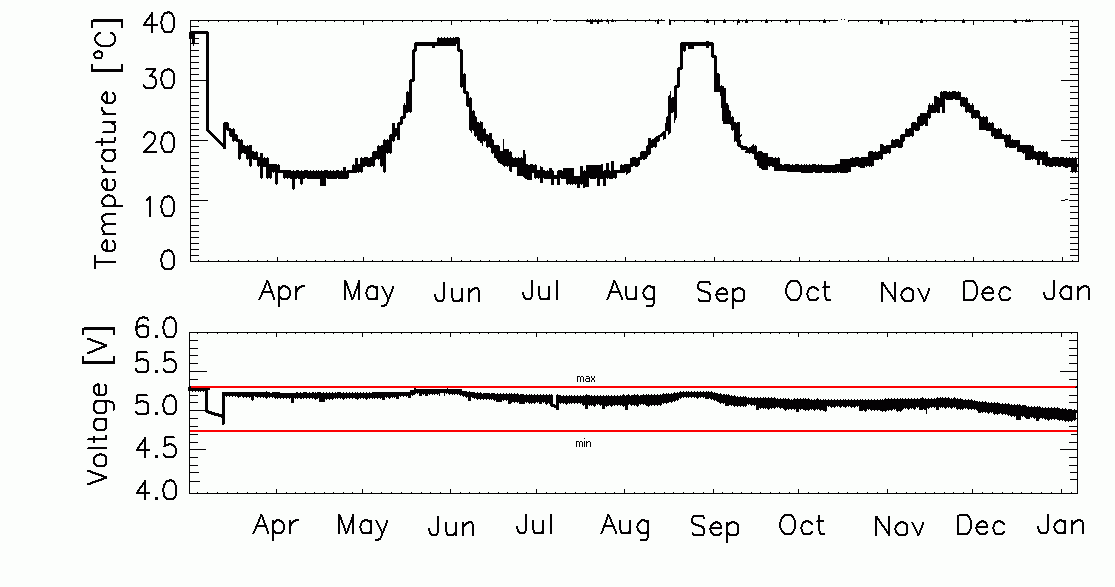
Figure 2. Behaviour of the temperatures measured on the crystal support (upper panel) over last 10 months. In the lower panel, the behaviour of the 5 V voltage provided by the low-voltage power unit is plotted for the comparison. Red horizontal lines (min, max) bound voltage region where the instruments electronics is supposed to work without problems.
In Fig. 3, we show the short-term variations of the temperature of RESIK crystal supports observed at present. The two lines plotted correspond to sections A (red) and B (blue). The variations seen are related with the orbital period of the satellite (93 min). The amplitude and the rate of changes are ± 3şC and 0.1şC/min respectively. This rate does not pose problems to the stability of the glue, sticking the crystal wafers to the cylindrical mandrel.
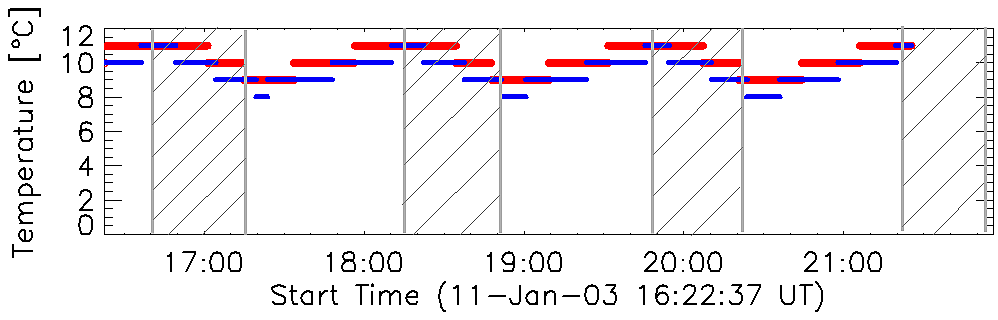
Figure 3. Behaviour of the temperatures measured on individual crystal supports A & B during three orbits. The temperatures measured show hysteresis relative to respective S/C night periods.
Report prepared by: Mirek Kowalinski mk@cbk.pan.wroc.pl, Witold Trzebinski wt@cbk.pan.wroc.pl and Janusz Sylwester js@cbk.pan.wroc.pl
The report presented has been done in "real time" and so it may contain
jargon, blunders, or trivialities. We do not have also an English native speaker
in our Wroclaw group! We would be happy to discuss problems mentioned above in
more details if necessary.
RESIK data are in the open public domain and
can be requested from: http://surfwww.mssl.ucl.ac.uk/surf/data_request.html.
Previous RESIK_weekly notes are in the archive: http://www.cbk.pan.wroc.pl/resik_archive.htm
Page made on 17 January 2003 by: Anna Kepa ak@cbk.pan.wroc.pl and Jarek Bakala jb@cbk.pan.wroc.pl