(Week 41, 2002, 07 Oct - 13 Oct.)
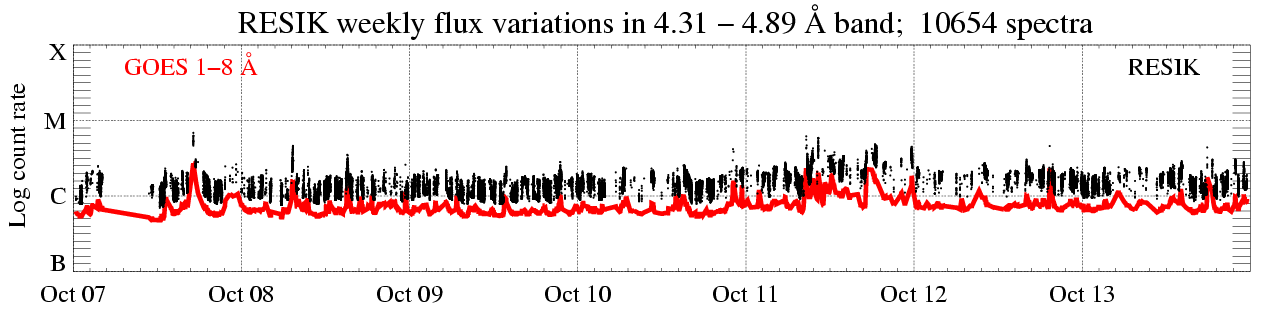
In the display above
(click to enlarge),
the solar X-ray fluence seen by RESIK
(black points) is plotted atop GOES red
line.
Only periods with good spectral measurements are indicated. The total number
of good spectral measurements is given in the title line.
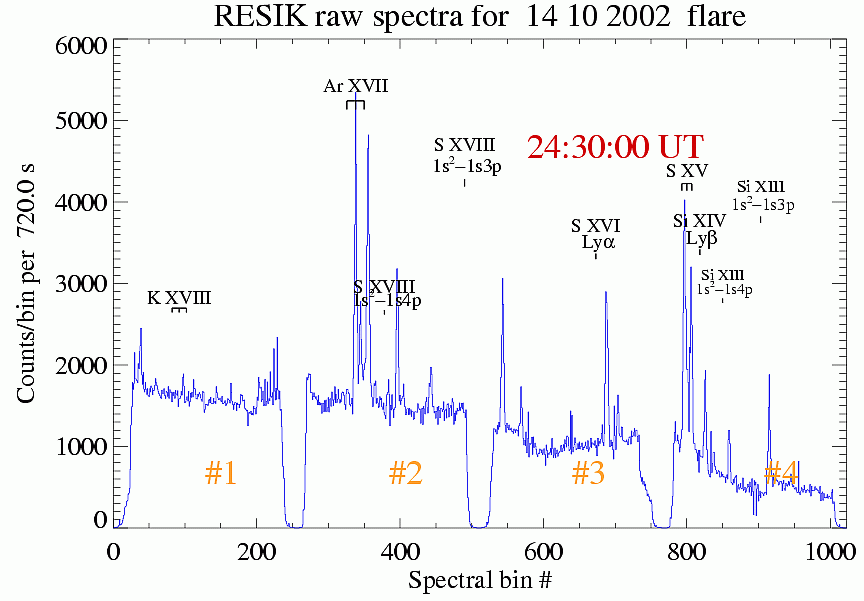
| Observing Mode: | Dynamic data gather interval (DGI) between 2 and 302 s depending on activity level. | |||||
| Calibration : | No Calibration made | |||||
| ADS Settings: | Amplitude Discriminator settings used: | |||||
 |
||||||
|
Channel |
l Band | ADS | ||||
| #1 | #2 | 3.37 - 3.88 Å : 95 - 185 | ||||
| #2 | #0 | 3.82 - 4.33 Å : 80 - 160 | ||||
| #3 | #3 | 4.31 - 4.89 Å : 150 - 215 | ||||
| #4 | #1 | 4.96 - 6.09 Å : 135 - 200 | ||||
|
|
|
software indexes | ||||
| spectroscopic notation (papers) | ||||||
Missing data due to telemetry gaps:
total ~2 h
Flare Temperatures from Diogeness S XV and Si XIV spectra
Diogeness is the uncollimated scanning flat crystal spectrometer observing flare X-ray spectra in four narrow wavelength bands (http://www.cbk.pan.wroc.pl/publications/2001/RESIK_and_Diogeness_Soft_X-ray.htm) in vicinity of Ca XIX, S XV and Si XIII He-like line 'triplets' around 3.18 Å, 5.04 Å and 6.65Å. Besides these strongest He-like triplet lines, Diogeness measure also the other lines important for plasma diagnostics.
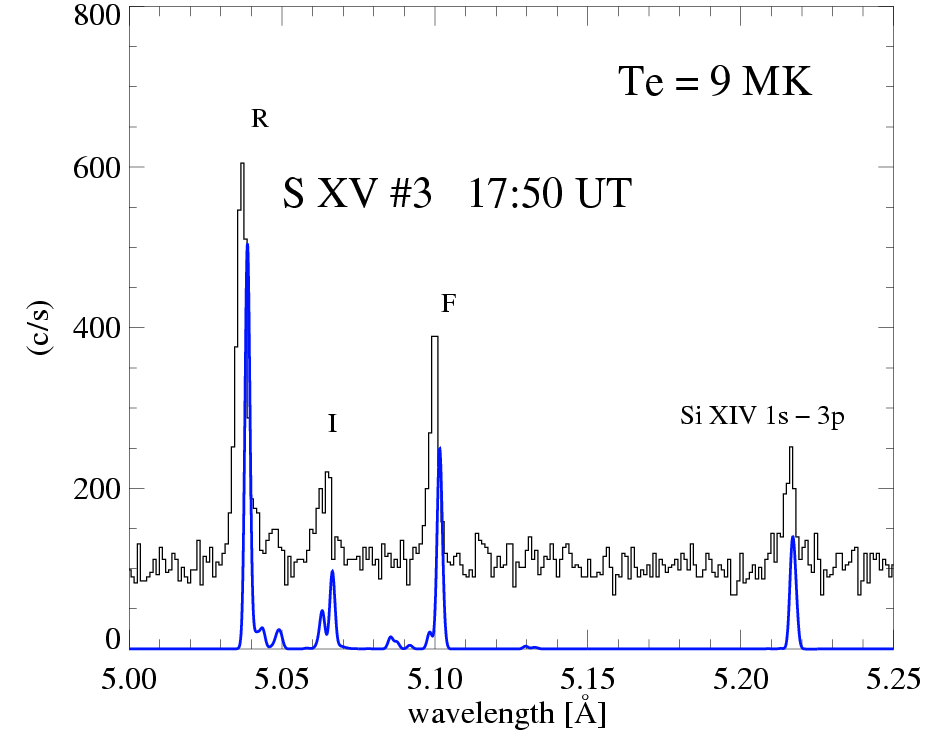
Among them, one of the most interesting is the Lyß line of Si XIV ion at 5.22 Å. As this line is mostly formed in the hottest region of the flare, its intensity rapidly falls during the decay phase of solar flares. This behaviour is presented in Figures below where spectra recorded on 25 August 2001 near maximum of large X5.3 flare (16:37 UT) and later on decay phase of this flare (17:50 UT) are shown as histograms. These spectra are compared with theoretically synthesised ones (thick blue lines in both Figures) calculated using CHIANTI (http://wwwsolar.nrl.navy.mil/ch_line_list_v4_1_50.html) spectral code, assuming simple isothermal plasma model. Standard chemical composition and ionisation balance has been assumed. The widths of lines have been assumed to be thermal, and the continuum emission has not been included in the spectral synthesis, in order to allow for better visual inspection of a good correspondence between the measured and theoretical spectra.
The
small differences between the locations of line centers for theoretical and
measured spectra result from the fact, that the wavelength scale of measured
spectra has been determined empirically while the theoretical spectra have been overplotted
with their own theoretical wavelengths scale. (We did not fit the
measured and theoretically synthesised spectra yet.)
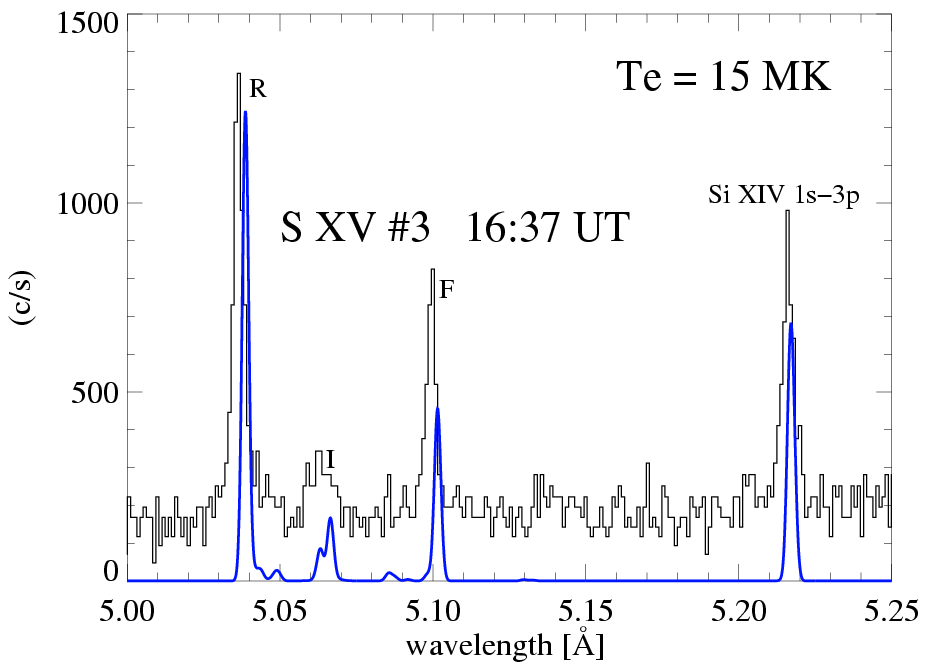
At the maximum phase of flare ( ~ 16:37 UT) the observed spectra are best matched assuming that the plasma temperature is T =15 MK. Later on during the decay phase (~ 17:50 UT) the optimum match has been obtained assuming substantially lower temperature of T = 9 MK. Isothermal approximation is of course the simplest one to be used, and the more elaborated modelling of the spectra observed (many tens of them available for the discussed event) using differential emission measure approach is in progress. We are open for collaboration on the spectra measured by Diogeness. Please contact the author of this Report.
Report prepared by: Marek Siarkowski
ms@cbk.pan.wroc.pl
The report presented has been done in "real time" and so it
may contain jargon, blunders, or trivialities. We do not have also an English
native speaker in our Wroclaw group! We would be happy to discuss problems
mentioned above in more details if necessary.
RESIK data are in the open public domain and can be requested from: http://surfwww.mssl.ucl.ac.uk/surf/data_request.html
Page made on 18 October 2002 by: Jarek Bakala jb@cbk.pan.wroc.pl