![]()
RESIK & Diogeness NEWS
|
|
(Week 15, 2003, 7 Apr. - 13 Apr.)
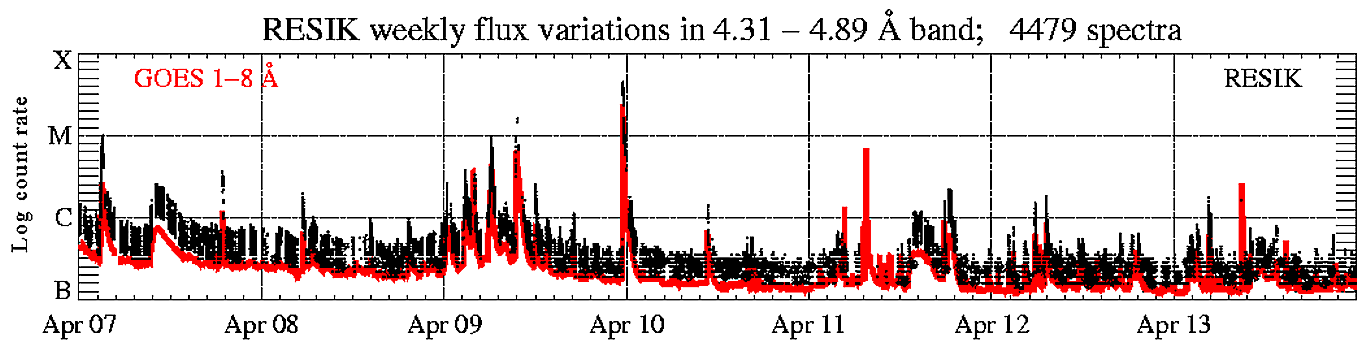
In the display above (click to enlarge), the solar X-ray fluence seen by RESIK (black points) is plotted atop GOES red line. Only periods with good spectral measurements are indicated. The total number of good spectral measurements is given in the title line.
|
Operation mode: |
2 s DGI has been used except that, '3rd order
reflections' (ORD3) is used as stand-by mode.
|
|
|
Calibrations made: |
No calibrations made
| |
|
ADS Settings: |
Since Apr. 11, 09:15:30 UT, new values are used (see
Table below). | |
|
| ||
| (ORD1) HV: Det. A - 1480 V, Det. B - 1419 V. | (ORD3) HV: Det. A - 1389 V, Det. B - 1328 V. | ||||||
|
Channel |
l Band |
ADS |
Channel |
l Band |
ADS | ||
| #1 | #2 | 3.37 - 3.88 Å | 115 - 195 | #1 | #2 | 1.16 - 1.29 Å | 110 - 230 |
| #2 | #0 | 3.82 - 4.33 Å | 75 - 170 | #2 | #0 | 1.27 - 1.44 Å | 110 - 230 |
| #3 | #3 | 4.31 - 4.89 Å | 170 - 250 | #3 | #3 | 1.44 - 1.63 Å | 110 - 230 |
| #4 | #1 | 4.96 - 6.09 Å | 145 - 205 | #4 | #1 | 1.65 - 2.03 Å | 140 - 230 |
|
|
| ||||||
Data gaps due to missing telemetry: ~ 8 h.
Note, that the link to the catalogue page is now: http://www.cbk.pan.wroc.pl/resik_catalogue.htm.
RESIK and RHESSI Observations of the Thermal Component of Flare X-ray Emission
RHESSI continues to observe X-ray emission in the 3 keV to 17 MeV energy range from solar flares. Recently a special volume of Solar Physics (vol. 210) was dedicated to a description of the RHESSI mission and some early results. Many of the flares RESIK has seen were also observed by RHESSI, and the observations from both are of great interest in getting flare X-ray fluxes in the region spanning the soft and hard X-ray ranges. This region has been recognized to be of immense interest understanding the relation of the flare non-thermal component (from energetic electrons accelerated in the flare impulsive phase) and thermal component (from very hot plasma, with temperatures up to several tens of MK).
The lower end of RHESSI's spectral energy
range (about 3 keV) overlaps with RESIK channels #1 and #2 (wavelength range for
an on-axis flare in first order is 3.37 - 4.33 Ǻ or 2.86 - 3.68 keV) offering a
highly useful means of cross-calibration. For intense flares, RHESSI often has
attenuators in place in front of its nine detectors to reduce the detector
counting-rate at low energies (less than 10 keV) to prevent saturation. However,
the exact amount of attenuation is somewhat uncertain and knowledge of the
continuum at about 3 keV which RESIK sees in its channel #1 and #2 spectra in
first order will enable this uncertainty to be much reduced. Also, flares seen
by RESIK in 3rd order diffraction, when Fe XXV line emission at about
1.85Ǻ (6.7 keV) is often a prominent feature, will help to get a
cross-calibration at this energy also as RHESSI sees the Fe lines with a 1 keV
FWHM resolution on top of the continuum.
We are making preliminary investigations of flares when both RESIK and RHESSI
were operating in order to do some cross-calibrations of this type. The April
21, 2002 flare offers the possibility of suitable data for this purpose. Figure
1 shows RESIK channels #1 and #2 spectra, plotted by JS in the unfamiliar guise
of being plotted against energy (keV), not wavelength (in Ǻ). The time interval was 03:25:30
- 03:28:41 UT.
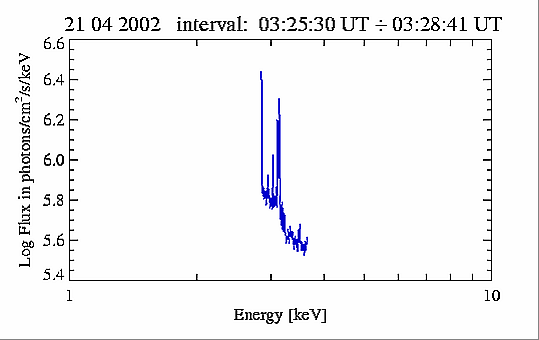
Figure 1.
RESIK spectra plotted along the energy. This kind of presentation will be used
for purposes of direct comparison with RHESSI spectra (see the text for more
details).
Figure 2 shows the RHESSI spectrum derived by Brian Dennis (RHESSI Group at
GSFC) over an interval close by in time (03:07:44 - 03:08:44 UT) with the RESIK
channels 1 and 2 spectra overplotted. RHESSI was in Earth shadow for times just
after this interval. Most likely for this slowly decaying event there is not too
much change in the flux between 03:08 and 03:25 UT. The agreement of the continuum fluxes to better than
a factor 2 shows that the RESIK and RHESSI calibrations are close to expected.
Work will be reported on this in future issues of the RESIK Weekly.
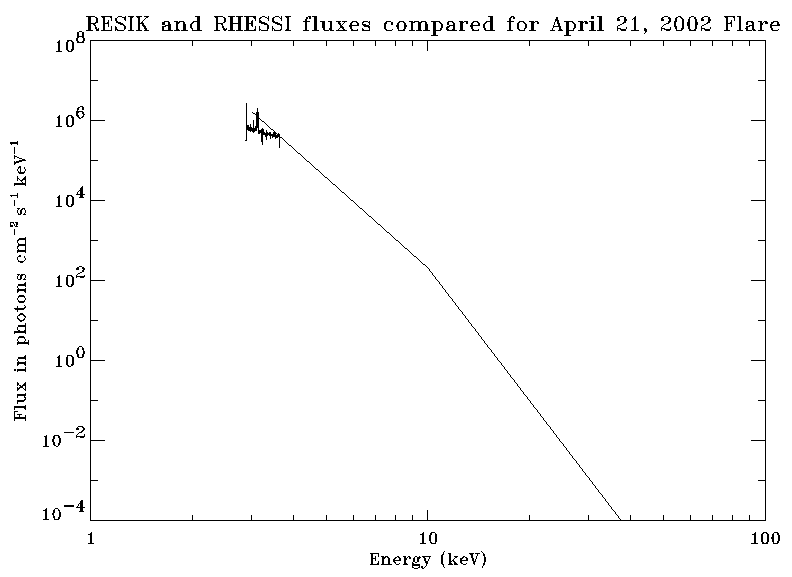
Figure 2.
RHESSI and RESIK energy spectra plotted together. Note rather good match
except for the slope of the continua. The spectra plotted have NOT been
measured simultaneously, however close in time.
Prepared by:
Ken Phillips
phillips@stars.gsfc.nasa.gov,
Janusz
Sylwester js@cbk.pan.wroc.pl, Barbara Sylwester
bs@cbk.pan.wroc.pl, Brian Dennis
Brian.R.Dennis.1@gsfc.nasa.gov
We would be happy to discuss problems mentioned above in more details if necessary.
RESIK data are in the open public domain and
can be requested from: http://surfwww.mssl.ucl.ac.uk/surf/data_request.html.
Previous RESIK_weekly notes are in the archive: http://www.cbk.pan.wroc.pl/resik_archive.htm
Page made on 18 April 2003 by: Anna Kepa ak@cbk.pan.wroc.pl and Jarek Bakala jb@cbk.pan.wroc.pl