![]()
RESIK & Diogeness NEWS
|
|
Week 24, 2003, 09 Jun. - 15 Jun. and Week 25, 2003, 16 Jun. - 22 Jun.
RESIK has been OFF since May 23rd. We are trying to get it back.
For details see
next Weekly.
Note, that the link to the catalogue page is now: http://www.cbk.pan.wroc.pl/resik_catalogue.htm.
New Collaborations
We
were quite busy last two weeks, so decided to combine two editions of the
Newsletter into one issue.
The
most of our activities last time were focussed on recovering RESIK from a limbo.
There are still chances that the instrument can be on air again, as we were able
to identify the most possible cause of the malfunction - a shortcut within one
of the electronic switchers. The software patch intended to bypass the problem
has been devised, uploaded to CORONAS (hopefully) and we have just to wait to
see the results.
Meanwhile, few people of the Wroclaw RESIK team attended the ISCS Workshop in Tatranska
Lomnica (http://www.astro.sk/iscs2003/). During JOSO session (there
are new JOSO
web page under construction: http://www.joso-info.org/JOSO_PROJEKT/main/index.htm),
JS presented the oral contribution: Patterns of X-ray Line Emission Variability
as Observed by RESIK Bragg Spectrometer. There
were quite a few people attending, representing various CORONAS-F instrument's
groups and few specialists working in atomic physics. Among the new "arrivals"
related closely to RESIK data interpretation are the following:
a) Dr. Volodya Slemzin (SPIRIT team, FIAN-Moscow) expressed interest in common data analysis between RESIK and SPIRIT. We will share with SPIRIT team our experience in the image processing (ANDRIL deconvolution). Their group will provide us with example images and precise info on the CORONAS-F attitude (as determined from EUV image analysis). Below is an example of the SPIRIT solar image (http://www.xras.lebedev.ru/spirit/pictures/images/mgxii.jpg) copied from their web site: http://www.xras.lebedev.ru/spirit/pictures/graph.htm.
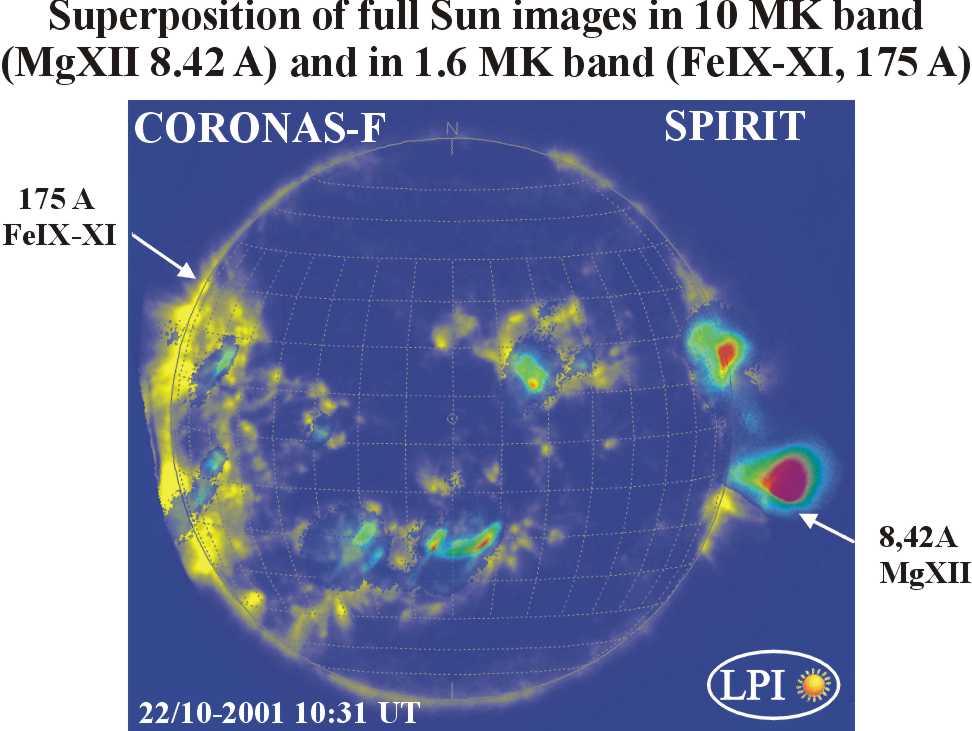
Figure 1. SPIRIT composed picture of the EUV and X-ray emission. Note the Lyα Mg XII emission patch hanging high above the western solar limb.
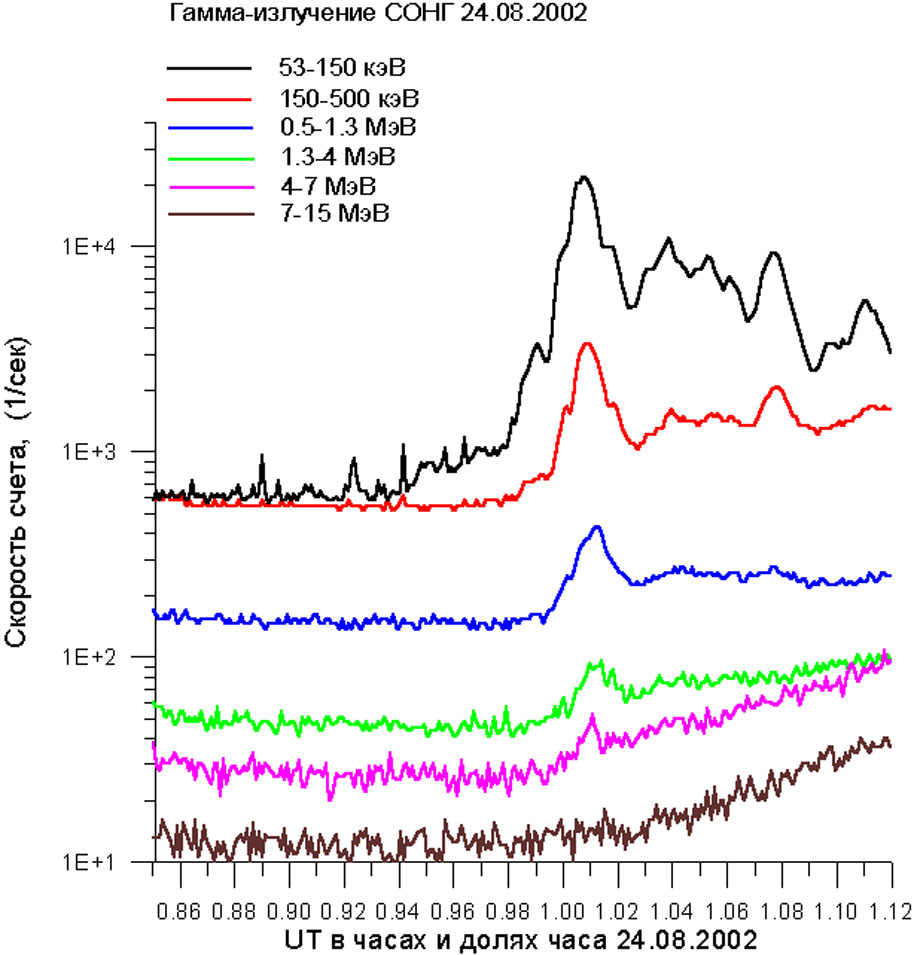
b) Dr. Irina Myagkova from Scobeltsyn Institute of Nuclear Physics, Moscow State University, showed us some of the observations obtained from SONG and SKL instruments. Their web pages (in Russian) contain graphs of the most interesting flares recorded (http://www.coronas.ru/). Below, we show the graph for one of the events well observed by SONG and RESIK.
 |
|
Figure 2. SONG X- and gamma ray fluences observed during the X3.1 flare located close to the western limb on 24 August 2002. On the horizontal axis the time in hours is given (decimal). On the verical axis the count rate (logarithmic scale). Different colours represent individual energy bands covering range from 50 keV - 15 MeV. |
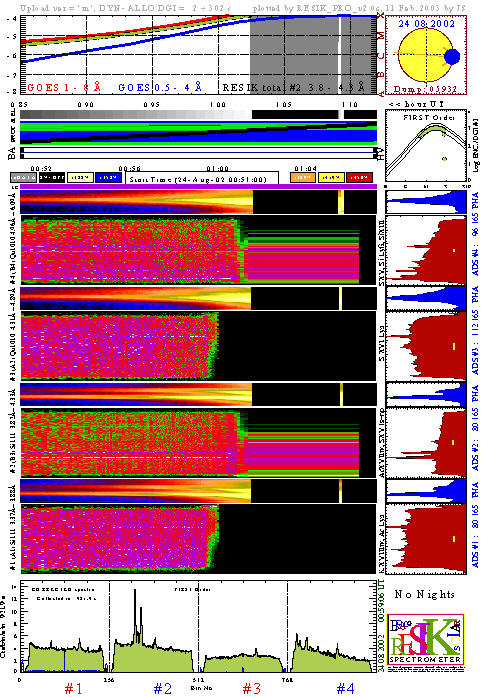
Figure
3. RESIK
catalogue page for the times corresponding to SONG measurements (24
August 2002, 00:51 - 01:06 UT). Note that around the time of flare
maximum phase, RESIK detectors become saturated. |
c) While discussing with Dr. Elena Dzifcakova (from Comenius University, Bratislava, Slovakia) we found it interesting to look for spectral signatures of possible non-Maxwellian distribution of exciters during early phase of flares. Elena agreed to make appropriate calculations for silicon using her non-Maxwellian ionisation/excitation code. Interpretation of the results may lead to development of appropriate diagnostics. In respect with this possible collaboration, we show below (Figure 4) examples of two spectra averaged during the rise and decay phases of the above-mentioned X3.1 flare. In Figure 5 we present enlarged spectra obtained in RESIK #4. It is seen how the ratios between Si XIV Lyb and Si XIII 1s2-1s(np) do change between the rise and decay phase. It is quite possible that the non-thermal contribution to observed line intensities during the rise phase can be identified.
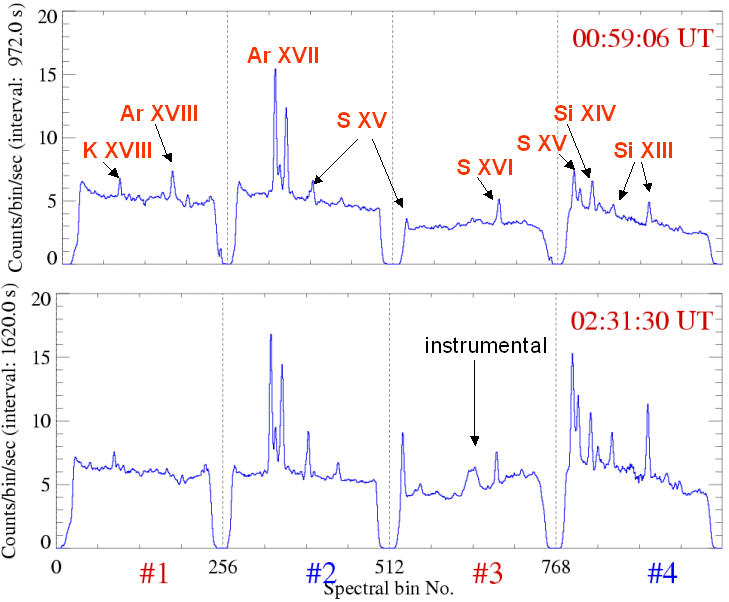
Figure 4. Examples of RESIK spectra collected over the rise (upper) and decay phases of the 24 August 2002 X3.1 flare. Note how strong are the Lyα lines in respect to the He-like resonance lines during the rise phase.
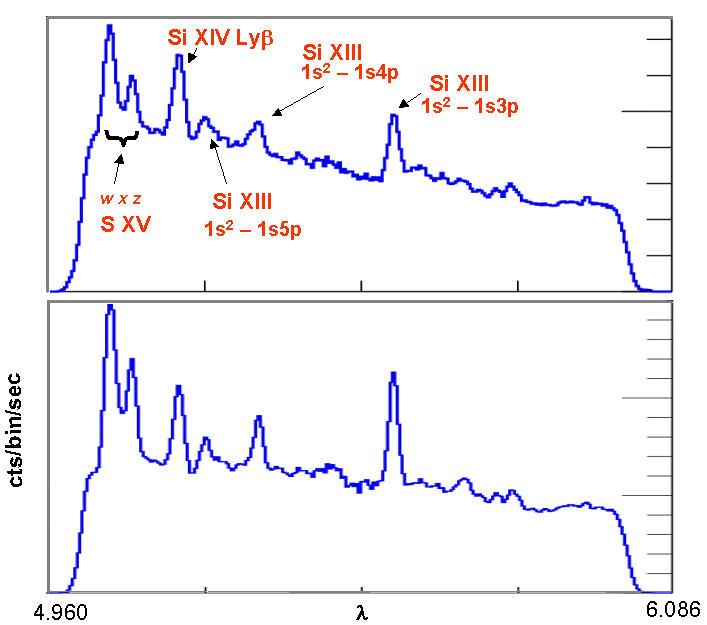
Figure 5.
Enlarged portion of RESIK spectra presented in the previous Figure.
(See Figure 4 for the vertical axis description). Only the spectra
for channel #4 collected during the rise (upper panel) and decay
phases are displayed. Note, that during rise phase, the intensity of
Si XIV Lyß line (1s-3p) exceeds the intensity of 1s2-1s3p line formed
in the Si XIII ion.
We hope that closer collaboration with the other groups having their instruments aboard CORONAS-F, or having experience in X-ray spectroscopy, may result in better understanding of RESIK measurements.
Prepared by: Janusz Sylwester js@cbk.pan.wroc.pl and Barbara Sylwester bs@cbk.pan.wroc.pl
The report presented has been done in "real time" and so it may contain jargon, blunders, or trivialities. We do not have also an English native speaker in our Wroclaw group!
We would be happy to discuss problems mentioned above in more details if necessary.
RESIK data are in the open public domain and can be requested from: http://surfwww.mssl.ucl.ac.uk/surf/data_request.html.
Previous RESIK_weekly notes are in the archive: http://www.cbk.pan.wroc.pl/resik_archive.htm