|
|
|
|
|
|
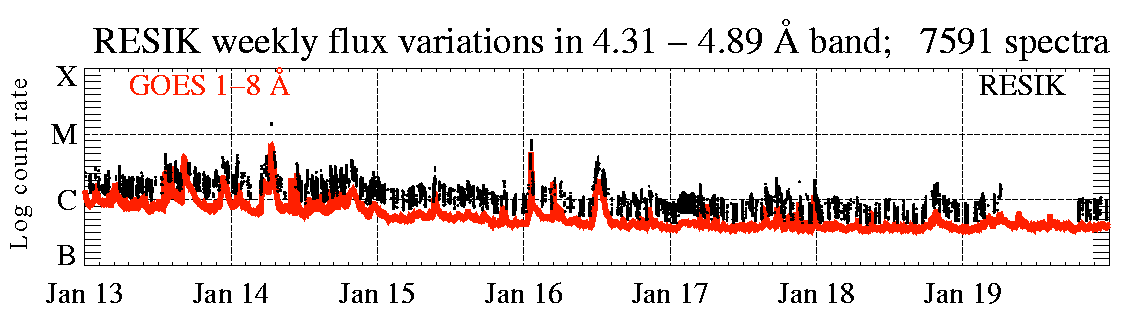
(Week 03, 2003, 13 Jan. - 19 Jan.)
In the display above (click to enlarge), the solar X-ray fluence seen by RESIK (black points) is plotted atop GOES red line. Only periods with good spectral measurements are indicated. The total number of good spectral measurements is given in the title line.
|
Operation mode: |
'3rd order
reflections' (ORD3) is used as stand-by mode. 3rd order measurements are indicated on the main catalogue page http://www.cbk.pan.wroc.pl/resik_catalogue.htm (cf. green boxes).
|
|
|
Calibrations made: |
No calibrations made
| |
|
ADS Settings: |
||
|
| ||
| (ORD1) HV: Det. A - 1450 V, Det. B - 1419 V. | (ORD3) HV: Det. A - 1389 V, Det. B - 1328 V. | ||||||
|
Channel |
l Band |
ADS |
Channel |
l Band |
ADS | ||
| #1 | #2 | 3.37 - 3.88 Å | 55 - 110 | #1 | #2 | 1.16 - 1.29 Å | 110 - 230 |
| #2 | #0 | 3.82 - 4.33 Å | 80 - 165 | #2 | #0 | 1.27 - 1.44 Å | 110 - 230 |
| #3 | #3 | 4.31 - 4.89 Å | 90 - 160 | #3 | #3 | 1.44 - 1.63 Å | 110 - 230 |
| #4 | #1 | 4.96 - 6.09 Å | 135 - 200 | #4 | #1 | 1.65 - 2.03 Å | 140 - 230 |
|
|
|||||||
Data gaps due to missing telemetry: ~ 17.25 h.
Note, that the link to the catalogue page has changed. It is now: http://www.cbk.pan.wroc.pl/resik_catalogue.htm. Starting from week 02, 2003, an improved catalogue page is used (c.f. W02, 2003) combining into one page the information previously reported in two pages. A new 2003 Catalogue Legend is in preparation.
Steep Rise Flare on 7th January 2003
In spite of very low solar activity, a number of flares occurred recently. One of them is the M4.9 limb flare (S11E89) on 7th January 2003 at 23:33 UT (maximum). It was an interesting event as the rise phase lasted only about 5 min. RESIK observed well the steep rise and late decay phases of this event as well as a short pre-flare period.
In Figure 1, we show the time plots of this event taken from the RESIK Catalogue http://www.cbk.pan.wroc.pl/2003/RDC_200301/resik_prC_08046_20030107_2257.png
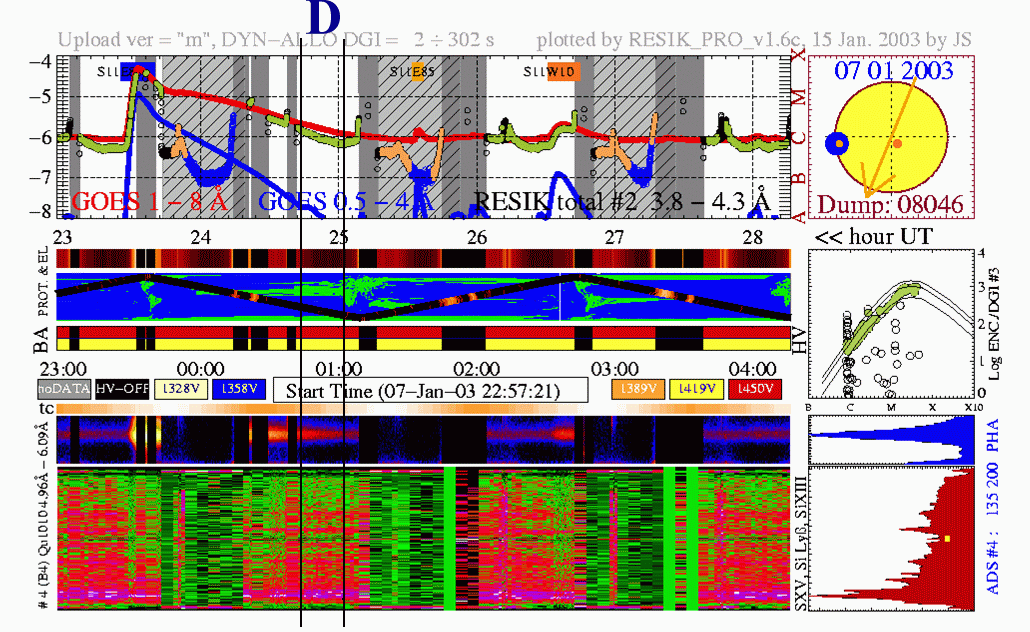
Figure 1. The upper part of (new) RESIK Catalogue page containing the flare of interest. The steep rise (5 ~ min.) and slow decay (1.5 hour) is noticeable. Green points in the upper panel correspond to times when clean RESIK spectra are available. See next Figure for more details.
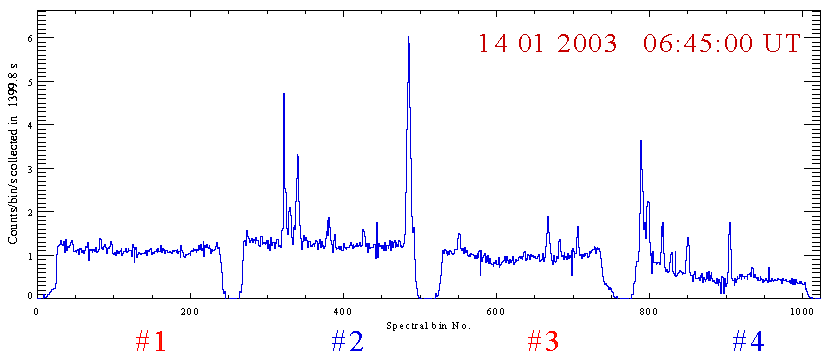
Figure 2 shows zoomed rise phase, where individual spectral DGI intervals can bee seen as distinct bands in the bottom panel.
Figure 2. The page from RESIK Clean Spectra Catalogue containing the rise phase of presented flare. The letters designate time intervals for which the spectra presented below have been integrated. See also Figure 1 for the flare decay period selected.

Figure 3. The four panels present the spectra of the 7th January 2003 event integrated over indicated times of this flare evolution. In the left corner of each panel the time of spectra integration is indicated. It is longer for the preflare and decay phases and rather short during the rise phase. Note, that the units on the vertical scale are (counts/bin/sec). At the top, the spectrum summed during the pre-flare phase (23:18 UT 23:26 UT; A) is presented. The second panel shows spectrum integrated over the early rise phase (23:26:40 UT 23:29:20 UT; B). The following panel presents spectrum collected during the interval 23:29:40 UT -23:31:50 UT just before the flare maximum (C). The bottom graph presents the spectrum obtained during the decay phase of this flare, now on 8th January between 00:45 UT and 01:05 UT (D in Figure 1).
The inspection of presented examples indicates that the character of spectra recorded by RESIK for selected event is changing dramatically during the flare evolution. In particular the trend of changing continuum inclination is noticeable. The spectra shown have been corrected for the orbital background (shown in blue at the bottom of each plot). Prompt correction for the notch effect has also been applied. It is seen that different lines dominate at each phase of flare evolution. In particular in Channel #1 the Lyα Ar XVIII line is strong before the flare reach its maximum. In Channel #2, the Ar XVII He-like line triplet is seen during the entire flare although the relative line intensities are changing substantially. In Channel #3, the Lyα line of S XVI ion dominates before the event maximum but it is seen already during the early rise phase. In Channel #4, the S XV He-like line complex is clearly seen even during the preflare phase. Also the behaviour of a number of the other lines in this channel is highly variable. In particular the Si XIII 1s2-1s3p relative line intensity rises significantly during decay phase.
Report prepared by: Barbara Sylwester bs@cbk.pan.wroc.pl and Janusz Sylwester js@cbk.pan.wroc.pl
The report presented has been done in "real time" and so it may contain
jargon, blunders, or trivialities. We do not have also an English native speaker
in our Wroclaw group! We would be happy to discuss problems mentioned above in
more details if necessary.
RESIK data are in the open public domain and
can be requested from: http://surfwww.mssl.ucl.ac.uk/surf/data_request.html.
Previous RESIK_weekly notes are in the archive: http://www.cbk.pan.wroc.pl/resik_archive.htm
Page made on 24 January 2003 by: Anna Kepa ak@cbk.pan.wroc.pl and Jarek Bakala jb@cbk.pan.wroc.pl