![]()
RESIK & Diogeness NEWS
|
|
(Week 16, 2003, 14 Apr. - 20 Apr.)
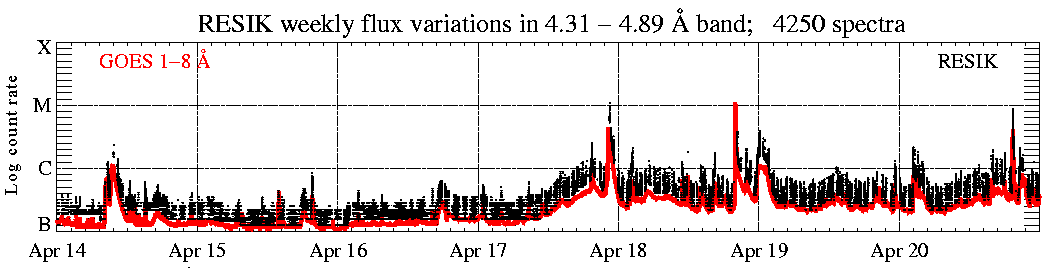
In the display above (click to enlarge), the solar X-ray fluence seen by RESIK (black points) is plotted atop GOES red line. Only periods with good spectral measurements are indicated. The total number of good spectral measurements is given in the title line.
|
Operation mode: |
1 s DGI has been used '3rd order
reflections' (ORD3) is used as stand-by mode.
|
|
|
Calibrations made: |
No calibrations made
| |
|
ADS Settings: |
| |
|
| ||
| (ORD1) HV: Det. A - 1480 V, Det. B - 1419 V. | (ORD3) HV: Det. A - 1389 V, Det. B - 1328 V. | ||||||
|
Channel |
l Band |
ADS |
Channel |
l Band |
ADS | ||
| #1 | #2 | 3.37 - 3.88 Å | 115 - 195 | #1 | #2 | 1.16 - 1.29 Å | 110 - 230 |
| #2 | #0 | 3.82 - 4.33 Å | 75 - 170 | #2 | #0 | 1.27 - 1.44 Å | 110 - 230 |
| #3 | #3 | 4.31 - 4.89 Å | 170 - 250 | #3 | #3 | 1.44 - 1.63 Å | 110 - 230 |
| #4 | #1 | 4.96 - 6.09 Å | 145 - 205 | #4 | #1 | 1.65 - 2.03 Å | 140 - 230 |
|
|
| ||||||
Data gaps due to missing telemetry: ~ 1 h.
Note, that the link to the catalogue page is now: http://www.cbk.pan.wroc.pl/resik_catalogue.htm.
RESIK Orbital Background
The nearly circular ~500 km orbit of CORONAS-F spacecraft crosses the auroral regions of van Allen belts at least four times each revolution, as the orbital plane is inclined at the angle of 82.5 degrees to the equator. In addition CORONAS-F penetrates the South Atlantic Anomaly (SAA) approximately 6 times per 24 hours. In connection with, the particle background contaminating the solar signal is fast varying, depending on the S/C geomagnetic coordinates.
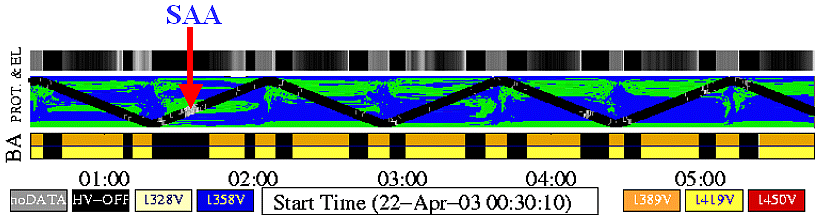
Figure 1. The
upper section of recent RESIK Catalogue page showing the CORONAS-F orbit (wavy line)
projected on the world map. Inside the wavy line, the brighter patches indicate
the increase of the signal measured by internal RESIK energetic particle sensors
(PIN diodes). These sensors have largest cross-section for detection of
energetic protons and therefore their signal increases during crossings the South Atlantic Anomaly (SAA).
The upper bar represents averaged rates measured in the rubbish bins of the
detectors PHA. Brighter regions indicate increased electron background contamination
during periods when HV is ON. In the bottom panel, the appropriate detectors
A and B high voltage (HV) settings are indicated using color schemes.
RESIK is equipped with a set of four dedicated PIN-diodes, which are sensitive to the energetic particles (protons). The signal from these sensors is constantly monitored by the on-board computer (COMP). In case there is more than 3 cts/s detected, the high voltage is taken OFF from the detectors in order to save their resources. This is illustrated in Figure 1.
We have found that the signal
in detectors PHA side bins (PHA bin number 0 and 31) in each of the four channels is
very sensitive to the presence of electron background (see the upper bar on
Figure 1). In addition, local in situ X-ray emission from auroral regions can be
seen by RESIK detectors. One of the primary task of data reduction is the removal of the unnecessary
background signal from the recorded spectra. In order to do this, we
first estimated the typical spectrum of the background emission for each
of the perturbing components.
In Figure 2, we show time averaged (over many tens of hours) background spectrum recorded in each RESIK spectral bin for detectors settings appropriate for the first order reflection spectra (ORD1).
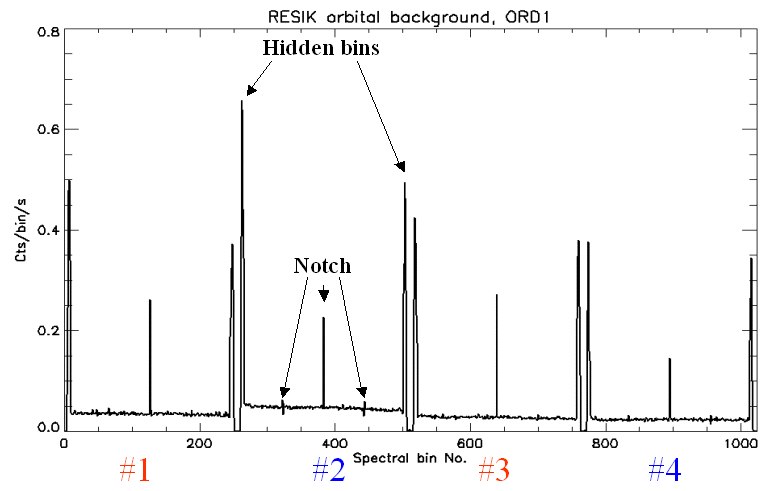
Figure 2. Plot of the averaged background in each of RESIK spectral bins first order reflection settings. The averaging is performed over the night sections of CORONAS-F orbit outside SAA, when S/C latitude is within ± 30 degrees of the equator. Total no of counts is ~105 in each channel.
It is seen that the orbital background is quite low, ~0.02 cts/s/bin and its spectrum is rather flat, except the hidden side bin areas of the position encoding and the notch. The hidden bins collect signal from these portion of the anodes which are NOT illuminated directly by crystal reflected X-rays. In addition, each hidden bin (from bin number 0 to 9 and from 246 to 255) collects the signal from the anode length which is a few times longer than that typical for the spectral bin. Therefore, the rates seen in hidden bins are larger. In the centre of the spectral range, a prominent peak is seen due to the notch (as well as smaller notch artefacts in between). The slope of the background as well as the ratio of left/right hidden peak intensity indicate that the background level is somewhat higher in this portion of the detector which is closer to the crystal. This may indicate that the origin of the background is due to X-ray characteristic emission of the crystal or crystal support (due to high energy background electrons). The intensity recorded in hidden bins can be used in order to correct the solar spectrum for this form of background. The intensity recorded in the right-hand hidden bins area can be used in order to scale-up the contribution of background to each individual spectral bin. Using of the left-hand hidden-bin intensity area is not so safe as this portion of the detector is contaminated by direct illumination from auroral X-rays. This effect is presently under the analysis.
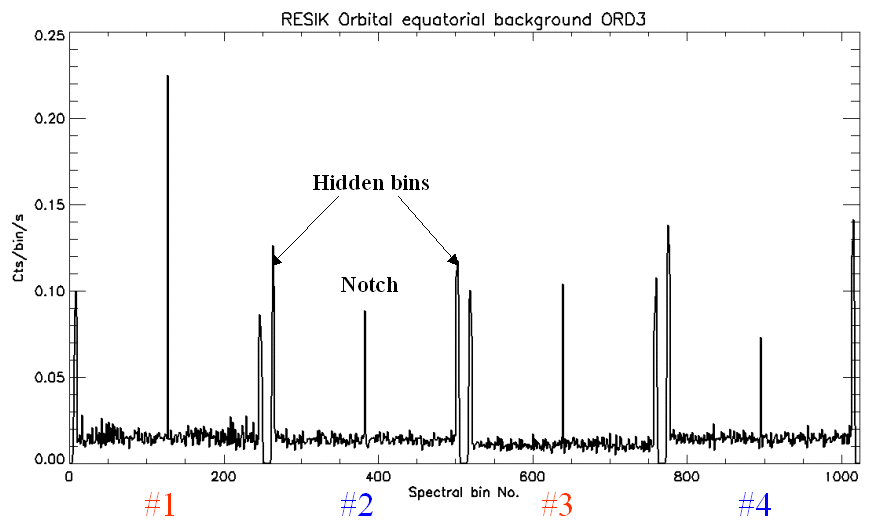
Figure 3. Plot of the averaged background in RESIK spectral bins third order reflection settings. The averaging is taken over the night sections of CORONAS-F orbit outside SAA, when S/C latitude is close to the equator (within ± 30 degrees). Total no of counts is few thousands in each channel. We will improve the statistics soon.
In Figure 3, we show background spectrum averaged over three orbits available where
the instruments settings (HV and ADS) corresponded to those for the third order
reflection during S/C nights. Here statistics is not so good, but we are
preparing for more measurements. It is seen that for the ORD3 settings, the
orbital background is at the similar level as for ORD1, but the proportion between hidden
bins spikes and the notch is substantially different from those observed for
ORD1. This means that for each order of reflection appropriate background
spectrum should be used for subtraction.
The overall level of background depends on the position of the
S/C in respect to the geomagnetic coordinates.
In Figure 4 we present a characteristic variation of background count rate (as
observed in #2) with the S/C geographical latitude.
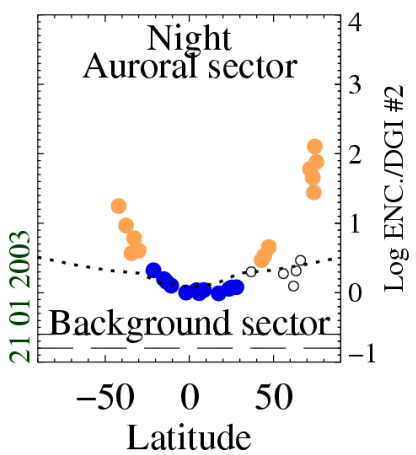
Figure 4. Latitude variation of the orbital background represented by total spectral signal observed in RESIK #2. Points in blue represent the equatorial band, while points in light brown are contaminated by the auroral X-ray emission (AXE). Dotted line represents the latitude variation of pure electron background as determined empirically.
It is seen that the background level increases at higher latitudes. In addition, a new component of the background, most probably due to auroral X-ray emission (AXE) becomes dominant. AXE is concentrated usually in narrow latitude bands and its spectrum (ORD1) has a typical pattern shown in Figure 5.
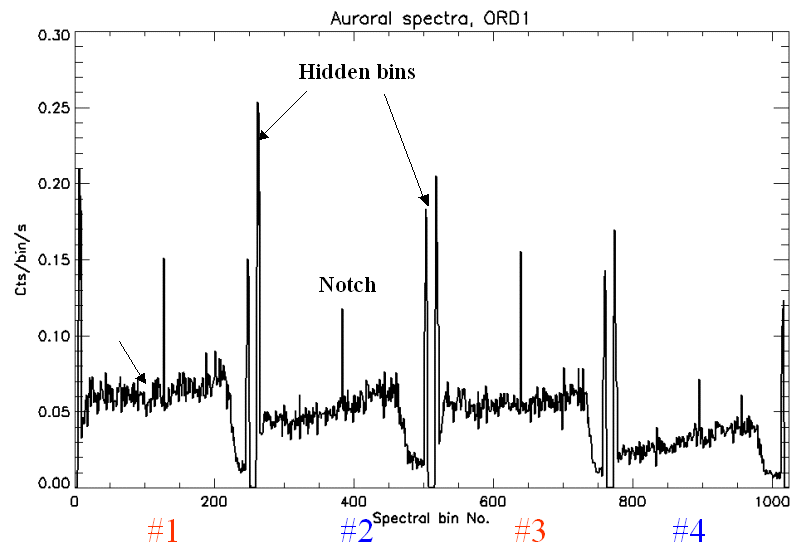
Figure 5. Plot of the averaged
auroral spectra. They represent (most probably) the pattern of
illumination of the detectors by in-situ X-ray emission formed in auroral ovals. Upper bin portions on each detector cannot
be directly illuminated which explains the decrease of the
emission towards the right-hand end of the spectrum in
each RESIK channel.
Prepared by: Janusz Sylwester js@cbk.pan.wroc.pl and Barbara Sylwester bs@cbk.pan.wroc.pl
The report presented has been done in "real time" and so it may contain jargon, blunders, or trivialities. We do not have also an English native speaker in our Wroclaw group!
We would be happy to discuss problems mentioned above in more details if necessary.
RESIK data are in the open public domain and can be requested from: http://surfwww.mssl.ucl.ac.uk/surf/data_request.html.
Previous RESIK_weekly notes are in the archive: http://www.cbk.pan.wroc.pl/resik_archive.htm
Page made on 25
April 2003 by: Anna Kepa ak@cbk.pan.wroc.pl and Jarek Bakala jb@cbk.pan.wroc.pl