(Week 51, 2002, 16 Dec. - 22 Dec.)
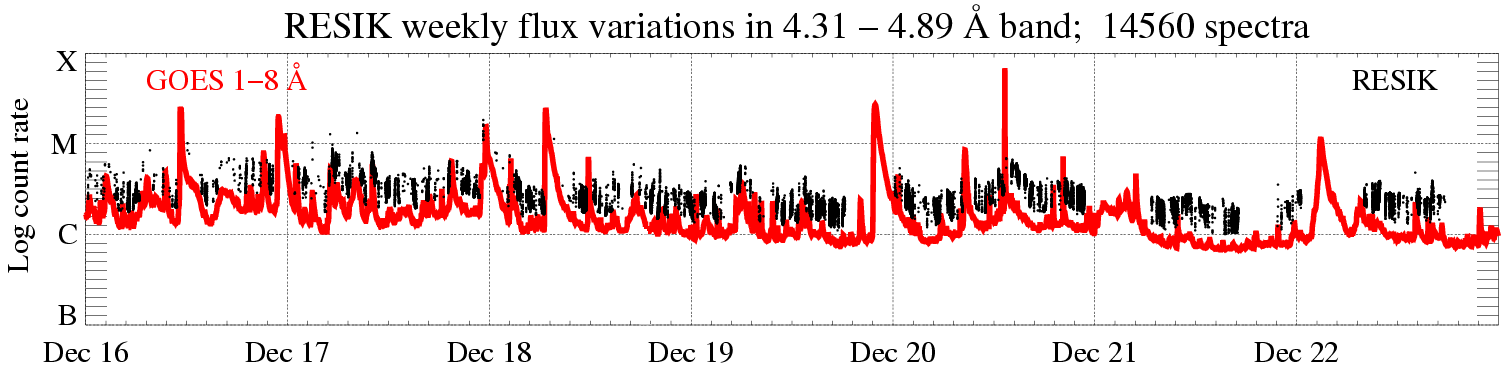
In the display above (click to enlarge), the solar X-ray fluence seen by RESIK (black points) is plotted atop GOES red line. Only periods with good spectral measurements are indicated. The total number of good spectral measurements is given in the title line.
New mode: |
'3rd order reflections' (ORD3) is used as
stand-by mode. 3rd order spectra observations are indicated on the main catalogue page http://www.cbk.pan.wroc.pl/2002.htm (cf. green boxes).
|
|
Mode tests: |
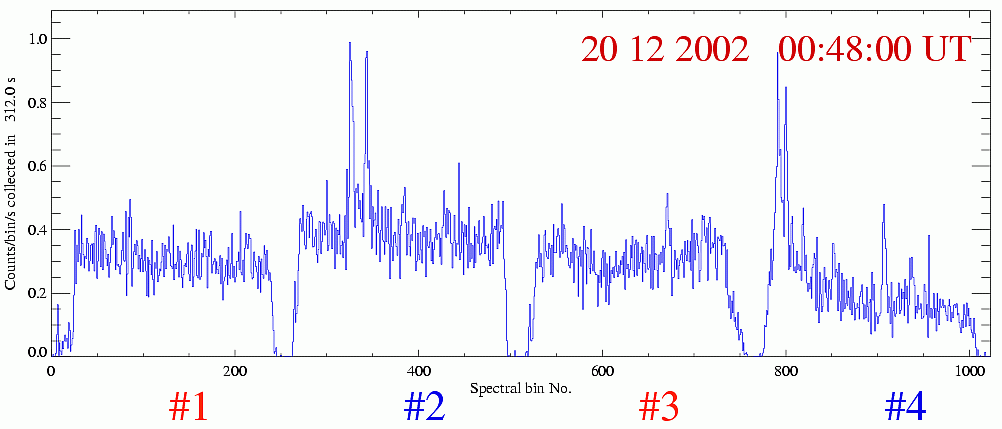
On 20 December 2002 (from 00:00 till 12:00) test of the new version of ORD1 mode
has been made . In this test the HV on detector B was set to 'old' value 1419 V.
The aim was to lessen the 'Notch' effects. Test went OK, and the ORD1 HV settings will be set to1419 V starting next week. See the
spectrum below taken during the test.
|
|
Calibrations made: |
No calibrations made |
|
ADS Settings: |
|
|
|
|
||
| (ORD1) HV: Det. A - 1450 V, Det. B - 1389 V. | (ORD3) HV: Det. A - 1389 V, Det. B - 1328 V. | ||||||
|
Channel |
l Band |
ADS |
Channel |
l Band |
ADS |
||
| #1 | #2 | 3.37 - 3.88 Å | 35 - 85 | #1 | #2 | 1.16 - 1.29 Å | 110 - 230 |
| #2 | #0 | 3.82 - 4.33 Å | 70 - 120 | #2 | #0 | 1.27 - 1.44 Å | 110 - 230 |
| #3 | #3 | 4.31 - 4.89 Å | 55 - 110 | #3 | #3 | 1.44 - 1.63 Å | 110 - 230 |
| #4 | #1 | 4.96 - 6.09 Å | 90 - 160 | #4 | #1 | 1.65 - 2.03 Å | 140 - 230 |
|
software indexes |
|
software indexes |
|||||
|
spectroscopic notation (papers) |
spectroscopic notation (papers) |
||||||
Data gaps due to missing telemetry: ~ 8 h.
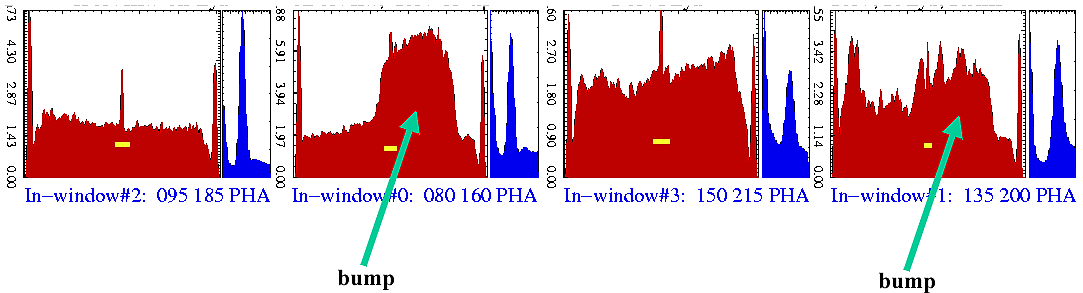
In Weekly_news No. 44 (http://www.cbk.pan.wroc.pl/resik_archive/resik_weekly_28_Oct-03_Sept/News.htm), we described strange spectral features (bumps) observed on the RESIK spectra (see below).
As the CORONAS-F satellite is pointed precisely towards the direction of the centre of solar disk
(see
Weekly_note_50), this direction moves arcoss the stellar reference frame along the ecliptic, as Earth circles the Sun. Therefore all X-ray sources which got chance to illuminate the RESIK crystals at the propper angles (fulfilling the Bragg law) may contribute to the measured spectra. In addition to this, a direct illumination of the detector Be windows is possible, since no special collimator has been
used. As explained in the sketch below, the viewing solid angle for the detectors placed inside RESIK is rather large, extending up to tens of degrees in certain directions (the viewing angle is limited in some areas of the sky due to to vignietting by a neigbour tall instruments within the CORONAS-F payload or by the RESIK instrument hardware
(i.e. the EUV filters mount).
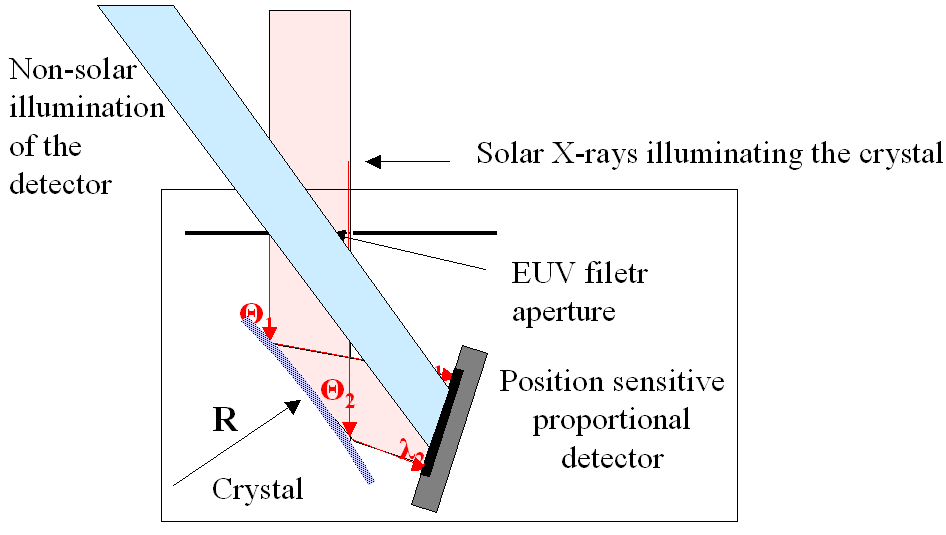
Figure 1. A scheme of X-ray beams within one section of RESIK Bragg spectrometer
It is natural, that the stellar sources moves in respect with the frame related to the Sun and as a consequence the illumination condition for these sources is changing. The relative rate of this motion is about 1degree/day.
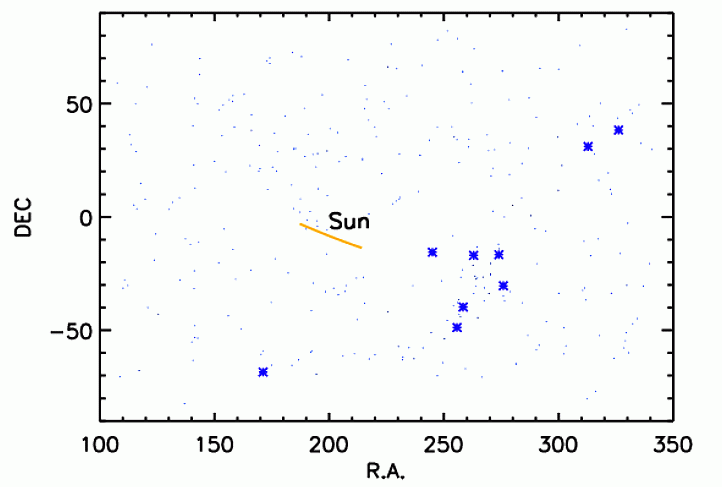
Figure 2. The trajectory (right
ascension and declination) of the Sun across the constellation of bright
X-ray sources (blue stars) is drawn for October.
As a consequence, directly illuminated portion of the detector (bluish ray path area in Fig. 1) varies smoothly in time.
We observed the position of sharp edges of the bumps seen on the detector
changing this way.
By estimating an approximate illumination angles from the momentary position of bumps edges,
we defined the variarion of the postulated non-solar illumination angle, and the
corresponding variations of the source angular distance to the Sun.
Corresponding plot is drawn in Fig. 3.
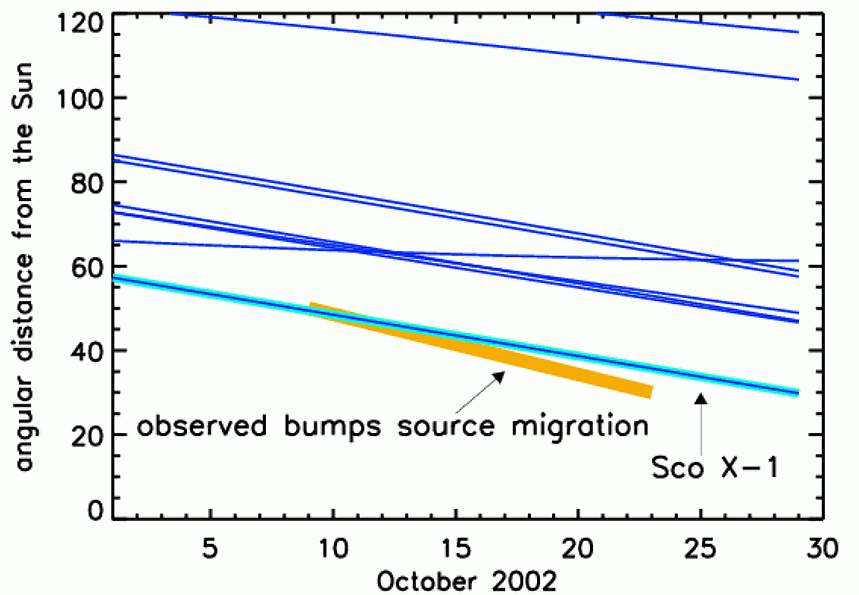
Figure 3. Predicted distance from the solar centre to a number of brighter non-solar X-ray sources in October (blue lines). Olive heavy line represents the observed variation deduced from changing position of the bump on the detector. It fits best with the predicted line drawn for the Sco X-1 source (marked).
The coincidence between the observed and predicted Sun-Sco X-1 distance variations, led us to make further attempt to locate the non-solar source with much better precision. In this respect, we used the occultation times of the non-solar source by the edge of the Earth atmosphere. It is easy to imagine that on its semi-Sun-synchonous orbit, the CORONAS-F usually enters Earth shadow each orbit. For the non-solar source, its eclipse by Earh shadow is somewhat delayed in time, in case the source is off-set by tens of
degrees.In the short period after sunset and before the source eclipse detectors
observe only the non-solar source. The source occultation time can be estimated
quite precisely, to within few seconds. Knowing the geographic location of the CORONAS-F satellite at the time of the source occultation allows to draw the position of the Earth occulting edge
projected on the sky map.
For each recorded source occultation event, we can plot respective occultation contour. An example is shown in Fig. 4.
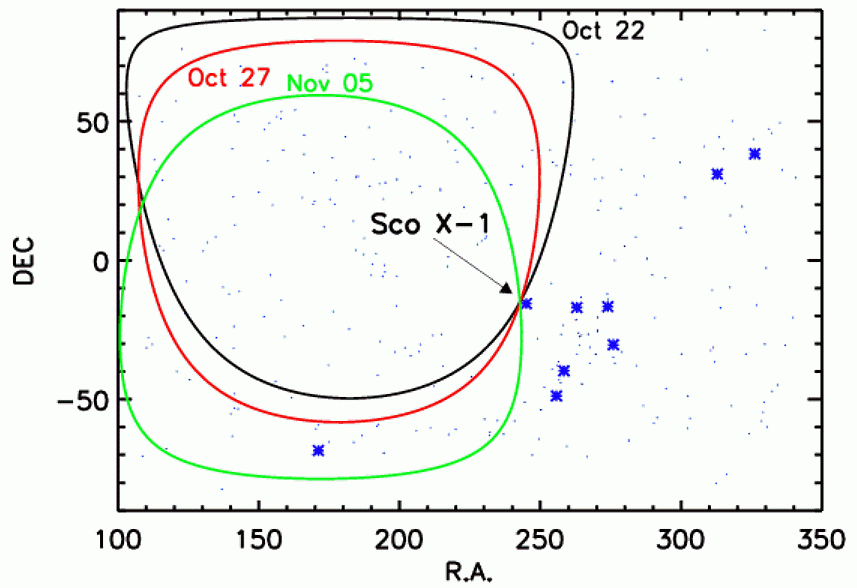
Figure 4. The positions of Earth occulted areas (the inside of ovals plotted) as determined from occultation timing for three dates:
Ocober 22, 27 and November 5, 2002. The ovals cross in two regions of the sky. In one of them is Sco
X-1 present.
We noticed that the Sco X-1 source is placed in one of these regions as shown in
Fig. 4. No other bright X-ray source share this location. After zooming the
region of interest (see Fig. 5), we noticed however, that Sco X-1 is slightly off-set from the predicted common contour intersection point.
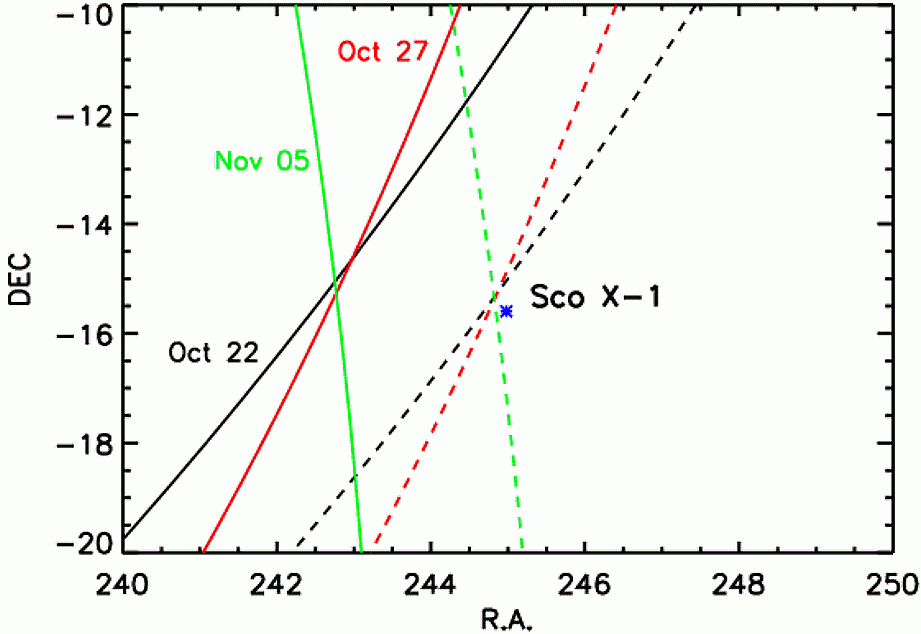
Figure 5. Enlargement of the map region where the occultation contours cross. Full colored lines representing occulting Earth edge are drawn assuming the Earth has standard radius of 6378
km. Dashed lines are drawn for the radius increased by the approximate height of X-ray non-transparent atmospere (+85 km).
On the close-up, we noticed the source being off-set from the common crossing point by few degrees, the distance much larger than the expected uncertainty of the common crossing point location. Then we realised, that the radius of Earth for occultation of the X-ray sky should be increased by 70 100 km as the atmosphere is transparent to
X-rays only above these heights. With this increased radius, the position of Sco
X-1 matches the crossing point precisely. Given the uncertainty of the Earth
radius, the occultation timing and the uncertainty of the CORONAS-F ephemeries,
the observed overlap is remarkable. This led us to the conclusion that the bumps
noticed on the RESIK spectra are due to direct illumination of detectors by Sco
X-1 (http://chandra.harvard.edu/xray_sources/sco/sco.html).
We will further analyse the observed Sco X-1 emission in order to
precisely calibrate RESIK sensitivity in relation to Chandra, Newton and
Intergral X-ray experiments. Such comparison may also allow for
determination of common
astrophysical photometric scale. Comparison of the Sco X-1 signal observed
in different sections of RESIK can be helpful in cross-calibrating the sensitivity
of individual spectrometer channels. The X-ray flux of Sco X-1 is few orders of
magnitude weaker than the solar one, therefore we do not expect to see its Bragg spectra.
Report prepared by: Marek Siarkowski ms@cbk.pan.wroc.pl
and
Zbigniew Kordylewski zk@cbk.pan.wroc.pl
Janusz Sylwester js@cbk.pan.wroc.pl
The report presented has been done in "real time" and so it may
contain jargon, blunders, or trivialities. We do not have also an English native
speaker in our Wroclaw group! We would be happy to discuss problems mentioned
above in more details if necessary.
RESIK data are in the open public domain and can be requested from: http://surfwww.mssl.ucl.ac.uk/surf/data_request.html.
Previous RESIK_weekly notes are in the
archive: http://www.cbk.pan.wroc.pl/resik_archive.htm
Page made on 27 December 2002 by: Jarek Bakala jb@cbk.pan.wroc.pl