![]()
|
|
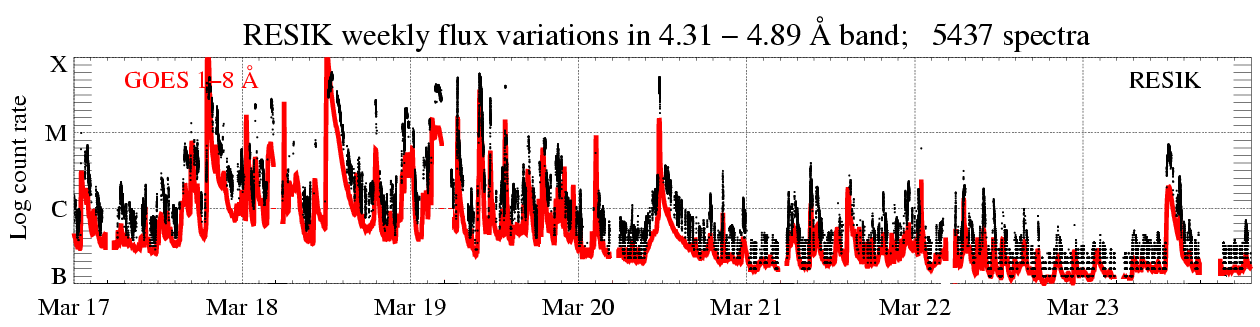
(Week 12, 2003, 17 Mar. - 23 Mar.)
In the display above (click to enlarge), the solar X-ray fluence seen by RESIK (black points) is plotted atop GOES red line. Only periods with good spectral measurements are indicated. The total number of good spectral measurements is given in the title line.
|
Operation mode: |
2
s DGI has been used.
|
|
|
Calibrations made: |
On 21 March 2003 between 12:01:15 UT and 18:00:56 UT another Amplitude
Discriminator Scan calibration has been executed with the calibration
radioactive Fe55 source ON.
| |
|
Switch to backup power supply unit: |
As explained below, on 14 March, we sent command to switch RESIK power supply to redundant unit. | |
|
ADS Settings: |
||
|
| ||
| (ORD1) HV: Det. A - 1450 V, Det. B - 1419 V. | (ORD3) HV: Det. A - 1389 V, Det. B - 1328 V. | ||||||
|
Channel |
l Band |
ADS |
Channel |
l Band |
ADS | ||
| #1 | #2 | 3.37 - 3.88 Å | 55 - 110 | #1 | #2 | 1.16 - 1.29 Å | 110 - 230 |
| #2 | #0 | 3.82 - 4.33 Å | 80 - 165 | #2 | #0 | 1.27 - 1.44 Å | 110 - 230 |
| #3 | #3 | 4.31 - 4.89 Å | 90 - 160 | #3 | #3 | 1.44 - 1.63 Å | 110 - 230 |
| #4 | #1 | 4.96 - 6.09 Å | 135 - 200 | #4 | #1 | 1.65 - 2.03 Å | 140 - 230 |
|
|
| ||||||
Data gaps due to missing telemetry: ~ 16 h.
Note, that the link to the catalogue page is now: http://www.cbk.pan.wroc.pl/resik_catalogue.htm.
Degraded Spectra of RESIK Detector A?
We are worrying that the switch-off to the backup power supply unit on March 14 (see weekly 10, 2003) caused unwanted change in the overall RESIK electronics. This change becomes apparent when we compare representative spectra collected before and after the switch, as illustrated in Figure 1.
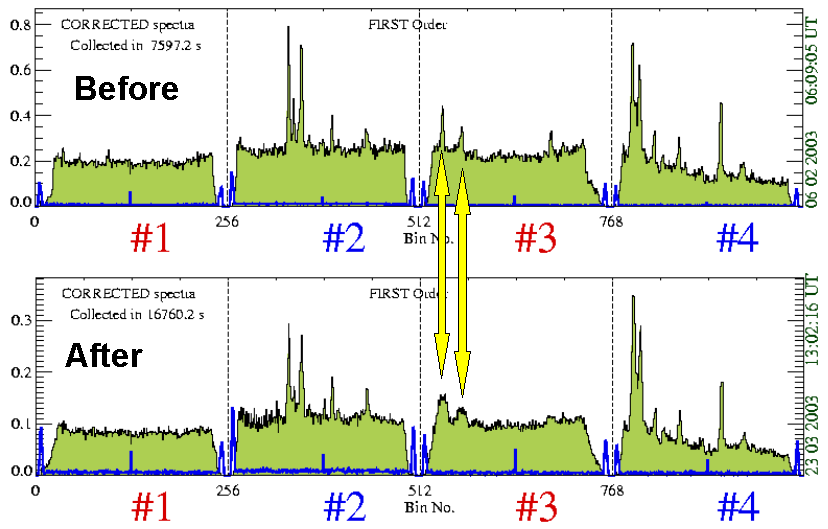
Figure 1. Comparison of the spectra collected by RESIK before and after the switch to backup power supply. Spectra have been collected during decay phases of flares, when the events were of similar intensities. The arrows points to spectral lines, for which the difference in the line shape is evidently seen.
It is seen, that spectral features indicated by arrows are much broader after the switch and have abnormal profiles. Also, we can hardly see lines at the position of the K XVIII triplet (cf. weekly 40, 2002). These indicate that operation of detector A (serving channels #1 and #3) is more affected.
The
comparison prompted us to run again
longer ADS
calibration (for 12 hours)
soon (scheduled now for March 27). Analysis of such runs will possibly allow us
to adjust a new optimum ADS settings. We presently
believe that the present HV levels did change with
the backup unit supplying the power to RESIK. There are also indications that
the backup power supply unit is more noisy. In Figure 2, we present the plot of
the temperature sensor readouts covering the period of power unit switching. The
readouts became more noisy after the switch.
Figure 2. Plot of the temperature sensor readouts for the time period enclosing the power units switch. We present the readouts from the sensor placed within the PIN high-energy particle detector as it is located close by the power units. The switch of the power from primary to backup took place on 14 marca 2003 at 8.27 UT, as indicated by the vertical (red) line.
Prepared by: Janusz Sylwester js@cbk.pan.wroc.pl and the RESIK engineering team: Mirek Kowalinski mk@cbk.pan.wroc.pl and Witold Trzebinski wt@cbk.pan.wroc.pl.
The report presented has been done in "real time" and so it may contain jargon, blunders, or trivialities. We do not have also an English native speaker in our Wroclaw group! We would be happy to discuss problems mentioned above in more details if necessary.
RESIK data are in the open public domain and
can be requested from: http://surfwww.mssl.ucl.ac.uk/surf/data_request.html.
Previous RESIK_weekly notes are in the archive: http://www.cbk.pan.wroc.pl/resik_archive.htm
Page made on 28 March 2003 by: Anna Kepa ak@cbk.pan.wroc.pl and Jarek Bakala jb@cbk.pan.wroc.pl